

Sensory salience processing moderates attenuated gazes on faces in autism spectrum disorder: a case-control study
- PMID: 36759875
- PMCID: PMC9912590
- DOI: 10.1186/s13229-023-00537-6
Sensory salience processing moderates attenuated gazes on faces in autism spectrum disorder: a case-control study
Abstract
Background: Attenuated social attention is a key marker of autism spectrum disorder (ASD). Recent neuroimaging findings also emphasize an altered processing of sensory salience in ASD. The locus coeruleus-norepinephrine system (LC-NE) has been established as a modulator of this sensory salience processing (SSP). We tested the hypothesis that altered LC-NE functioning contributes to different SSP and results in diverging social attention in ASD.
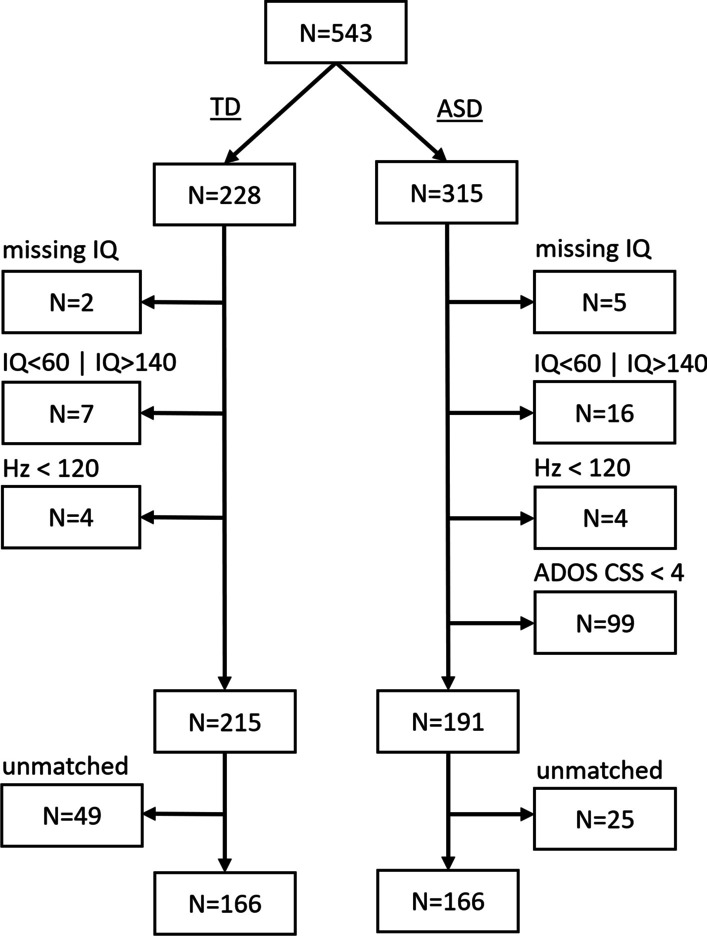
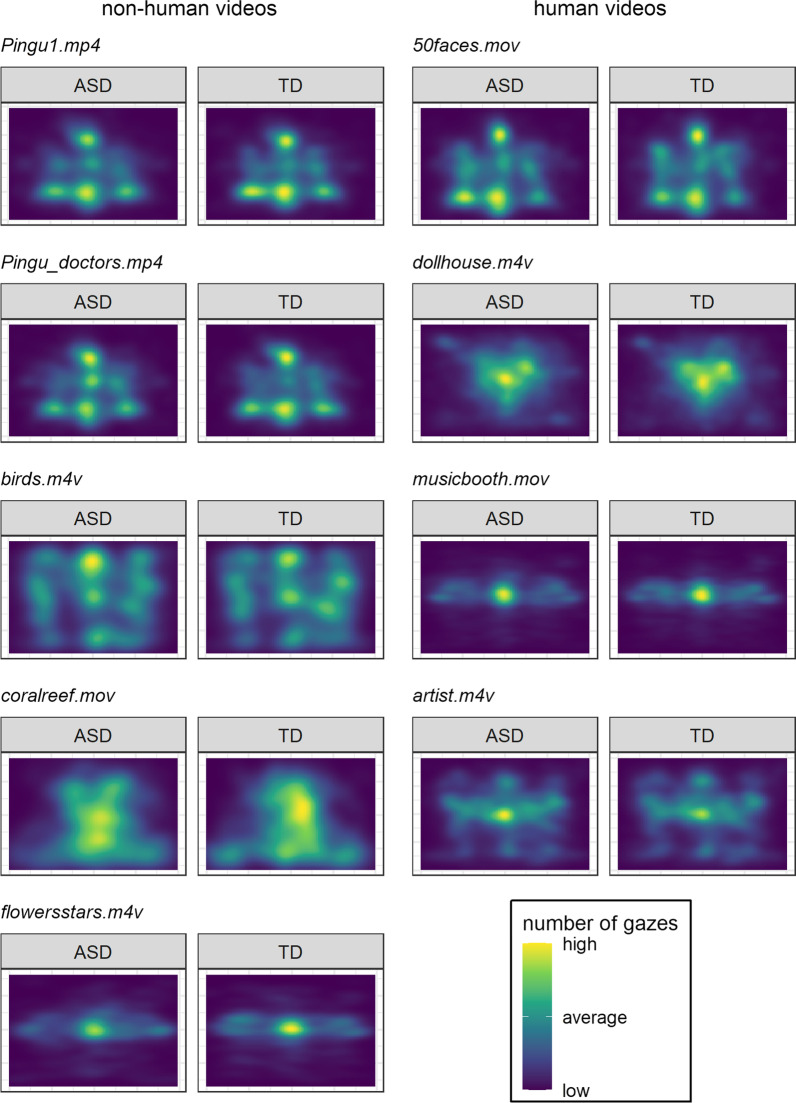
Methods: We analyzed the baseline eye-tracking data of the EU-AIMS Longitudinal European Autism Project (LEAP) for subgroups of autistic participants (n = 166, age = 6-30 years, IQ = 61-138, gender [female/male] = 41/125) or neurotypical development (TD; n = 166, age = 6-30 years, IQ = 63-138, gender [female/male] = 49/117) that were matched for demographic variables and data quality. Participants watched brief movie scenes (k = 85) depicting humans in social situations (human) or without humans (non-human). SSP was estimated by gazes on physical and motion salience and a corresponding pupillary response that indexes phasic activity of the LC-NE. Social attention is estimated by gazes on faces via manual areas of interest definition. SSP is compared between groups and related to social attention by linear mixed models that consider temporal dynamics within scenes. Models are controlled for comorbid psychopathology, gaze behavior, and luminance.
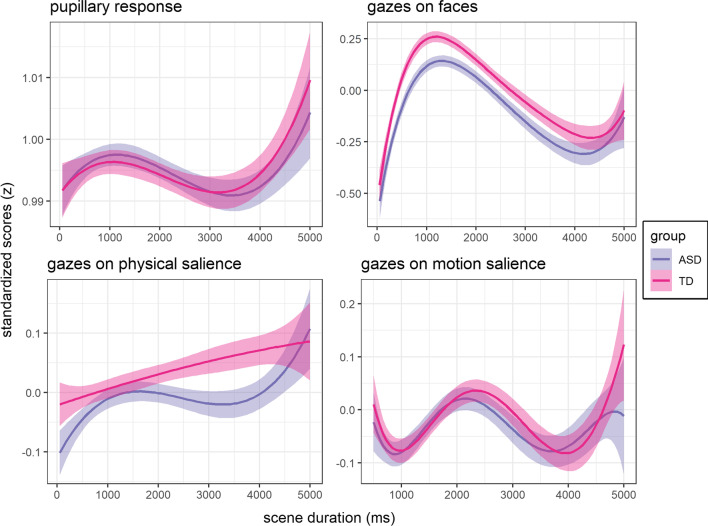
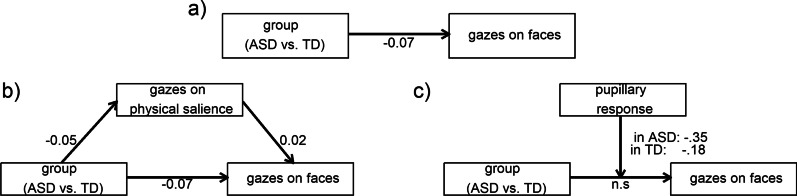
Results: We found no group differences in gazes on salience, whereas pupillary responses were associated with altered gazes on physical and motion salience. In ASD compared to TD, we observed pupillary responses that were higher for non-human scenes and lower for human scenes. In ASD, we observed lower gazes on faces across the duration of the scenes. Crucially, this different social attention was influenced by gazes on physical salience and moderated by pupillary responses.
Limitations: The naturalistic study design precluded experimental manipulations and stimulus control, while effect sizes were small to moderate. Covariate effects of age and IQ indicate that the findings differ between age and developmental subgroups.
Conclusions: Pupillary responses as a proxy of LC-NE phasic activity during visual attention are suggested to modulate sensory salience processing and contribute to attenuated social attention in ASD.
Keywords: ASD; Computer vision; Eye tracking; Locus coeruleus; Naturalistic visual attention; Norepinephrine; Pupillometry; Saliency maps; Social attention; Visual exploration.
© 2023. The Author(s).
Conflict of interest statement
CMF receives royalties for books on ASD and ADHD and further receives research funding by the German Research Foundation (DFG), the German Ministry of Science and Education and the European Commission. NB receives royalties for lecturing at institutes for training in psychotherapy and receives research funding by the German Research Foundation (DFG). TB served in an advisory or consultancy role for ADHS digital, Infectopharm, Lundbeck, Medice, Neurim Pharmaceuticals, Oberberg GmbH, Roche, and Takeda. He received conference support or speaker’s fee by Medice and Takeda. He received royalties from Hogrefe, Kohlhammer, CIP Medien, Oxford University Press; the present work is unrelated to these relationships. JB has been in the past 3 years a consultant to/member of advisory board of/and/or speaker for Takeda/Shire, Roche, Medice, Angelini, Janssen, and Servier. He is not an employee of any of these companies, and not a stock shareholder of any of these companies. He has no other financial or material support, including expert testimony, patents, royalties. The remaining authors have declared that they have no competing or potential conflicts of interest.
Figures


References
-
- Treisman AM. Selective attention in man. Br Med Bull. 1964;20(1):12–16. - PubMed
-
- Corbetta M, Shulman GL. Control of goal-directed and stimulus-driven attention in the brain. Nat Rev Neurosci. 2002;3(3):201–215. - PubMed
-
- Itti L, Koch C. Computational modelling of visual attention. Nat Rev Neurosci. 2001;2(3):194–203. - PubMed
-
- Haxby JV, Hoffman EA, Gobbini MI. The distributed human neural system for face perception. Trends Cogn Sci. 2000;4(6):223–233. - PubMed
Publication types
MeSH terms
Substances
LinkOut - more resources
Full Text Sources
Medical
