Review
. 2023 Feb;12(2):e12299.
doi: 10.1002/jev2.12299.

A compendium of single extracellular vesicle flow cytometry

Affiliations
Review

A compendium of single extracellular vesicle flow cytometry

Joshua A Welsh et al. J Extracell Vesicles. 2023 Feb.

Abstract

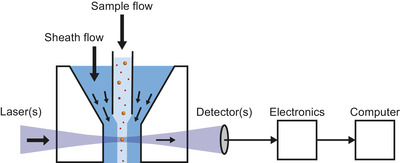
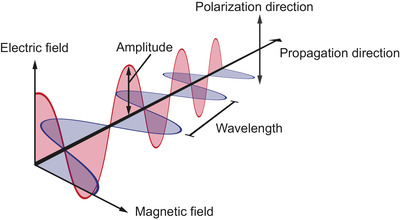
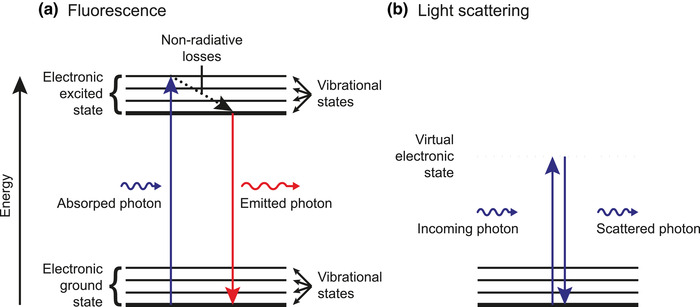
Flow cytometry (FCM) offers a multiparametric technology capable of characterizing single extracellular vesicles (EVs). However, most flow cytometers are designed to detect cells, which are larger than EVs. Whereas cells exceed the background noise, signals originating from EVs partly overlap with the background noise, thereby making EVs more difficult to detect than cells. This technical mismatch together with complexity of EV-containing fluids causes limitations and challenges with conducting, interpreting and reproducing EV FCM experiments. To address and overcome these challenges, researchers from the International Society for Extracellular Vesicles (ISEV), International Society for Advancement of Cytometry (ISAC), and the International Society on Thrombosis and Haemostasis (ISTH) joined forces and initiated the EV FCM working group. To improve the interpretation, reporting, and reproducibility of future EV FCM data, the EV FCM working group published an ISEV position manuscript outlining a framework of minimum information that should be reported about an FCM experiment on single EVs (MIFlowCyt-EV). However, the framework contains limited background information. Therefore, the goal of this compendium is to provide the background information necessary to design and conduct reproducible EV FCM experiments. This compendium contains background information on EVs, the interaction between light and EVs, FCM hardware, experimental design and preanalytical procedures, sample preparation, assay controls, instrument data acquisition and calibration, EV characterization, and data reporting. Although this compendium focuses on EVs, many concepts and explanations could also be applied to FCM detection of other particles within the EV size range, such as bacteria, lipoprotein particles, milk fat globules, and viruses.

Keywords: MIFlowCyt-EV; calibration; extracellular vesicles; flow cytometry; microparticles; nanoparticles; standardization.


Conflict of interest statement

André Görgens has equity interest in and is a consultant for Evox Therapeutics Ltd, Oxford, UK. André Görgens is inventor on patents and patent applications related to extracellular vesicle engineering, manufacturing, and analysis. An Hendrix is an inventor on patents and patent applications related to extracellular vesicle products. Edwin van der Pol is co‐founder and shareholder of Exometry BV. Joshua A. Welsh and Jennifer C. Jones are inventors on NIH patents and patent applications related to extracellular vesicle assays. John P. Nolan is CEO of Cellarcus Biosciences. Joanne Lannigan is a paid consultant for EV development work for Cytek Biosciences. Romaric Lacroix and Françoise Dignat‐George declare that they have patents on extracellular vesicles assays and have received funding from the companies Stago and Beckman Coulter. Xiaomei Yan declares a competing financial interest as a cofounder and shareholder of NanoFCM Inc.

Figures

FIGURE 1
FIGURE 1
Schematic representation of a flow cytometer. Particles in a sample flow are hydrodynamically focused by a sheath flow and guided through the center of one or more focused lasers. Fluorescence and light scattering signals from particles are detected, processed by electronics and stored on a computer. Figure 7 shows a more detailed schematic of a flow cytometer.
FIGURE 2
FIGURE 2
Physicochemical properties of extracellular vesicles (EVs) and their environment affecting flow cytometry measurements. (A) Schematic of an EV, which contains a lumen enclosed by a phospholipid membrane. The phospholipid membrane contains lipids and proteins, has a presumed refractive index (RI) of 1.40–1.52 (Ducharme et al., ; Horvath et al., ; Kienle et al., ; van Manen et al., 2008), and has a thickness of 4 nm or more depending on its composition (Arraud et al., ; Lewis & Engelman, ; Mitra et al., 2004). The lumen may contain DNA, lipids, organelles, proteins, RNA, and soluble molecules and has a presumed RI of 1.34–142 (Brunsting & Mullaney, ; Curl et al., ; Ghosh et al., ; Maltsev et al., ; Valkenburg & Woldringh, ; van Manen et al., 2008). The environment typically is phosphate‐buffered saline and has a RI close to water. In addition, the environment may contain DNA, non‐EV particles, proteins, RNA and soluble molecules. (B) Estimated size distribution of EVs (solid line) and lipoprotein particles (LPs; dotted line) in human blood plasma, which will be used throughout the manuscript as a model sample to explain typical problems involved in EV flow cytometry. The bin width is 1 nm. Due to the broad size distribution of EVs, the lower LoD (dotted lines) of different flow cytometers determines the totally measured EV concentration. The number in brackets indicates the percentage of detected EVs by a flow cytometer with given lower LoD. (C) The same size distributions as in panel B but plotted with a logarithmic vertical scale, revealing that the concentration of lipoprotein particles rapidly increases with decreasing diameter (horizontal stripes) and that the EV concentration decreases several orders of magnitude with increasing diameter (diagonal stripes). (D) Estimated number of αIIbβ3 (CD41/CD61) antigens, P‐selectin (CD62P) antigens, and IgG‐Fc receptors per EV versus the diameter of EVs in blood plasma, assuming that the number of receptors increases quadratically with the diameter of EVs. The horizontal dashed line indicates an LoD of 100 phycoerythrin (PE) molecules. The smallest detectable diameter of EVs does not only depend on the sensitivity of the detector used, but also on the properties of EVs, such as the number of stained receptors.
FIGURE 3
FIGURE 3
Schematic representation of light. Light is electromagnetic radiation, which are waves made up by coupled oscillations of electric (red) and magnetic (blue) fields. The primary properties of an electromagnetic wave are the amplitude, polarization direction, propagation direction, and wavelength.
FIGURE 4
FIGURE 4
Jablonski diagrams of fluorescence and light scattering by a molecule. (A) The horizontal lines represent the levels of energy states of a molecule. The lowest energy level corresponds to the ground state (thick line). When the electrons are in the lowest possible orbital, the molecule is in the electronic ground state. Within the electronic ground state, the molecule can occupy different vibrational states with different energies, representing different types of periodic motions of the molecule. In the process of fluorescence, an incoming photon is absorbed and temporarily excites both the electronic and vibrational state of a molecule. Next, the molecule loses energy and therefore decays to the lowest vibrational state without radiative emission (dotted arrow). Finally, the molecule relaxes to the ground state under the emission of a photon. Due to the non‐radiative energy loss, the emitted photon has a lower energy and longer wavelength than the incoming photon. (B) In the process of light scattering, an incoming photon excites the molecule to a virtual electronic state (dashed line), which is instantaneously followed by relaxation of the molecule to the ground state and emission of a photon. The energy and wavelength of the incoming and scattered photon are the same.
FIGURE 5
FIGURE 5
Irradiance of light and the physical cross section and scattering cross section of a particle. (A) Irradiance E is the power of light PL per unit area A in the focus (blue oval) of the laser beam. (B) Physical cross section σp (dotted oval) of a particle (circle) oriented perpendicular to the incoming laser beam. For clarity, σp and A (panel A) have similar dimensions, but in reality σp for extracellular vesicles is much smaller thanA. (C) The scattering cross section σs (red oval) is a hypothetical area defining which fraction of the incoming light is scattered by a particle. (D) The effective scattering cross section σΩ (red oval) is a hypothetical area defining which fraction of the power of the incoming light is scattered by a particle towards a lens with solid collection angle Ω.
FIGURE 6
FIGURE 6
Application of Mie theory calculations for flow cytometry measurements of extracellular vesicles (EVs). (A) Total scattering cross section versus diameter for EVs calculated with Mie theory (solid line) and the Rayleigh approximation for solid spheres (dotted line). (B) Mie calculation of the angular distribution of light intensity scattered by an EV with a diameter of 50 nm (circle), 100 nm (dotted line), 250 nm (dashed line) and 1000 nm (solid line). The numerical apertures of the forward scattered light (FSC) and side scattered light (SSC) detectors are 0.29 and 1.19, respectively. (C) Effective scattering cross section and scattering intensity in arbitrary units (arb. unit) versus diameter for EVs (solid line) and polystyrene beads (dashed line) calculated with Mie theory and measured (symbols) with a customized BD FACSCanto (de Rond et al., 2020). The collection angles are similar to the FSC detector in panel B. (D) Idem as panel C, but the collection angles are similar to the SSC detector in panel B. EVs were modelled as core‐shell particles having a 6 nm thick shell with a refractive index of 1.48 and a core refractive index of 1.38. Polystyrene beads were modelled as solid spheres with a refractive index of 1.6053. The model assumed an illumination wavelength of 488 nm, a medium refractive index of 1.3374. and a polarized laser beam with the electric field component being perpendicular to the plane displayed in panel B.
FIGURE 7
FIGURE 7
Schematic representation of a flow cytometer. (A) Side view of the flow cell. Particles in a sample flow are hydrodynamically focused by a sheath flow and guided through the center of one or more focused lasers. The point where the sample flow and laser beam intersect is called the interrogation point. The electric field component of the laser beam is aligned parallel to the flow direction. Part of the light scattered by illuminated particles in the sample flow is measured by the forward scattered light (FSC) detector. The laser beam is blocked by the blocker bar. Flow cytometers with the functionality to sort particles are typically equipped with a nozzle that, together with a piezo element, generates droplets. A droplet contains both sample and sheath fluid, and may contain one or more particles. To separate the droplets, an electric charge is applied to the fluid. Depending on the applied charge, a static electric field will deflect the charged droplets towards different containers. (B) Top view of the flow cell. Illuminated particles emit fluorescence and scatter light in the sidewards direction, which is collected by a positive lens, spectrally filtered, and measured by fluorescence detectors and the side scattered light (SSC) detector, respectively. The magnetic field component of the laser beam is aligned perpendicular to the flow direction.
FIGURE 8
FIGURE 8
Basic signal processing steps of the electronics of a flow cytometer. Simulated electrical signal originating from a detector (left axis) and the same signal digitized by the analog to digital converter (right axis) versus time. The signal has an offset due to amplifiers and gains and fluctuates due to background noise. The median background level is called the baseline (dashed line). At 3 μs and 15 μs, particle 1 and particle 2 pass the interrogation point, respectively, and produce a Gaussian pulse. To identify the signal associated to a particle, a trigger threshold is set at three times the standard deviation of the background noise (dash dotted line). The pulse width is the time interval wherein the pulse exceeds the trigger threshold level (dotted lines). The pulse area is the area under the pulse (gray), but above the baseline. The pulse height is the amplitude of the pulse relative to the baseline. Arb. unit: arbitrary units.
FIGURE 9
FIGURE 9
Scaling and the dynamic range of an analog to digital converter (ADC) affect the resolution of a digitized signal. (A) Simulated signal distribution of two particle populations after digitization by a 16‐bit ADC using a gain of 1. The first and second population fall within the first and fourth decade of the ADC, respectively. The first decade has only 10 channel numbers available to describe the signal, which results in poor resolution. (B) Simulated signal distribution of the same particle populations as in panel A after digitization by a 16‐bit ADC using a gain of 100. The first population falls within the third decade of the ADC and has improved resolution compared to panel A. The second population falls off scale, equals the maximum channel number, and therefore cannot be resolved from populations with similar intensities. Arb. unit: arbitrary units.
FIGURE 10
FIGURE 10
Generic experimental design of a flow cytometry experiment to characterize single extracellular vesicles (EVs). Assay controls are marked in blue. FMO: fluorescence minus one.
FIGURE 11
FIGURE 11
Schematic representation of a fluorescent antibody conjugate and processes involved in antibody staining. (A) Fluorophore conjugated to an antibody. The antibody consists of two antigen‐binding sites (Fab region) and an isotype specific fragment to bind to Fc receptors (Fc region). (B) The antigen binding sites allow the antibody to bind specifically to antigens exposed on the surface of an EV. (C) The isotype specific fragment binds to isotype‐specific Fc receptors that may be exposed on the surface of an EV. Therefore, antibodies do not bind specifically to antigens, but also to Fc receptors. (D) Fluorescent antibody conjugates, antibodies and fluorophores may form aggregates with similar dimensions as EVs. (E) Antibodies may stick to the surface of EVs or other particles. (F) Isotype control antibody with the same Fc regions (e.g., IgG1 and IgG2a) as antibodies used to stain EVs, but with a Fab region that recognizes irrelevant antigens. Isotype control antibodies therefore allow assessment of the degree of Fc receptor‐mediated binding.
FIGURE 12
FIGURE 12
The lower limit of detection (LoD) of a flow cytometer affects the statistical description of the size distribution, fluorescence intensity distribution, and light scattering intensity distribution of an extracellular vesicle (EV) sample. (A) Size distribution, (B) fluorescence intensity distribution, and (C) light scattering intensity distribution of the same population of EVs. The vertical lines denote three LoDs relating to diameters of 100 nm (dotted line), 150 nm (dashed line), and 300 nm (solid line). The effect of these LoDs for statistical descriptions of the size distribution, fluorescence intensity distribution, and light scattering intensity distribution can be found in Tables 4 and 5.
FIGURE 13
FIGURE 13
Example of the identification of EVs stained with antibodies using an assay control and a calibration. (A) Measured fluorescence intensity (Apogee A60‐Micro) versus the side scattering intensity of particles in plasma stained with CD61‐APC (Gasecka et al., 2020). The fluorescent gate (horizontal line) differentiates stained particles (CD61+) from background noise and unstained particles (CD61‐). The arbitrary units (arb. unit) preclude identification of the three positively stained populations. (B) Measured fluorescence intensity in standard units versus the diameter of particles in CD61‐APC added to phosphate buffered saline, which was the buffer used in panel A. The data confirms the presence of antibody‐fluorophore aggregates. (C) Measured fluorescence intensity in standard units versus the diameter of particles in the same sample as displayed in panel A. Owing to the calibration and the reagents in buffer control, the three populations can be readily identified as antibody‐fluorophore aggregates, EVs stained with CD61, and residual platelets.
FIGURE 14
FIGURE 14
Serial dilution to determine the minimum required dilution to prevent swarm detection. (A) Measured concentration (Apogee A60‐Micro) and (B) measured median side scattering intensity and median fluorescein (FITC) fluorescence intensity in arbitrary units (arb. unit) of particles in pooled (5 healthy male and 5 healthy female donors) cell‐depleted plasma exceeding a side scattering cross section of 10 nm2 versus dilution. Data are fitted with a linear function. The dashed circles indicate dilutions for which swarm detection occurs. The dotted circle indicates dilutions for which the background counts dominate the measured concentration. The optimal dilution is the lowest dilution for which swarm detection does not occur (arrows).
FIGURE 15
FIGURE 15
Effect of the trigger threshold on the number of measured EVs and on the number of events associated with background noise. Fluorescence intensity versus effective scattering cross section (σs) of (A) Dulbecco's phosphate‐buffered saline (DPBS) and (B) extracellular vesicles (EVs) from DC2.4 cell lines stained with carboxyfluorescein succinimidyl ester (CSFE). The fluorescence intensity of fluorescein (FITC) is calibrated into units of molecules of equivalent soluble fluorophore (MESF). The green line indicates the gate that differentiates fluorescently stained particles from fluorescent background noise. (C) Number of triggered events versus the threshold applied to the light scattering detector provided in the same units as the effective scattering cross section in panel A and B. For a decreasing threshold, the number of events associated with background noise increases more strongly than the number of measured EVs.
FIGURE 16
FIGURE 16
Relevance of checking the count rate. (A) Cumulative distribution function of the counts and (B) histogram of the counts versus time for extracellular vesicle (EV) samples measured with a stable count rate, a spike in the count rate, and a varying count rate. The samples with a stable count rate and a spike in the count rate contain particles in cell‐depleted plasma stained with CD45‐APC measured with an Apogee A60‐Micro. The sample with a varying count rate contains particles form a cell‐depleted erythrocyte concentrate stained with CD235a‐PE measured with an FACSCanto II (BD, USA). The cumulative distribution function of the counts clearly reveals flow rate variations that last long relative to the measurement time, whereas the histogram of the counts versus time makes spikes visible. For the A60‐Micro measurements, count rate fluctuations within 400 s−1 are caused by the data acquisition. (C) Fraction of the total counts and (D) CD45‐APC+ or CD235a‐PE+ EVs measured during the first and last 60 s in the same samples as measured in panels A and B. Differences in counts between the first and last 60 s of the measurement were negligible (1%–3%) for the sample with a stable count rate, negligible (1%) for the total counts of the sample with spikes in the count rate, 49% for the fluorescent positive counts of the sample with spikes in the count rate, and 14–15% for the sample with a varying count rate. Thus, spikes and variations in the count rate may lead to unreliable counts and concentration estimates.
FIGURE 17
FIGURE 17
Relevance of fluorescence calibration. (A) Probability density function of extracellular vesicles (EVs) stained with carboxyfluorescein succinimidyl ester (CFSE) measured by the fluorescein (FITC) detector of a Beckman Coulter Astrios EQ (solid line) and a Beckman Coulter CytoFLEX S (dotted line). The peak intensities are at different locations on the arbitrary units (arb. unit) scale. (B) Calibration of the FITC detectors of a Beckman Coulter Astrios EQ (solid line) and a Beckman Coulter CytoFLEX S (dotted line). The measured arb. units are related to the specified molecules of equivalent soluble fluorochrome (MESF) of reference materials using linear regression. (C) Application of the MESF calibration from panel B to the data from panel A. The calibration results in comparable CFSE‐stained EV data.
FIGURE 18
FIGURE 18
Relevance of scatter calibration. (A) Light scattering intensities of 200 and 400 nm polystyrene (PS) beads (solid line) and EVs stained with Glycophorin A (CD235a) from a cell‐depleted erythrocyte blood bank concentrate (dashed line) measured by the forward scattered light detector of a BD Influx. (B) Measured (symbols) and calculated (lines) light scattering intensity of PS (solid line) and EVs (dashed line) versus diameter for the BD Influx. The calibration factor, which relates the measured arbitrary units (arb. unit; left axis) to the theoretical scattering cross section (right axis), is 0.16. The calibration reveals that the 200 and 400 nm PS bead gate selects EVs with a diameter between ∼300 and ∼800 nm. (C) Idem as panel A, but measured with the side scattering detector of a BD LSR. (D) Idem as panel B, but for the BD LSR. The calibration factor is 1.47. The calibration reveals that the 200 nm and 400 nm PS bead gate selects EVs with a diameter between ∼800 nm and ∼1900 nm. Thus, a PS bead gate selects different EVs at different flow cytometers. EVs were modelled as solid spheres with a refractive index (n) of 1.40.
FIGURE 19
FIGURE 19
The flow cytometry scatter ratio (Flow‐SR), which is the ratio of the side to forward scattered light intensity, allows determination of the diameter of particles independent of the particle refractive index. Flow‐SR versus diameter for polystyrene (PS) beads (squares), silica beads (circles), and hollow silica beads (HOBs; triangles) measured (symbols) by an Apogee A60‐Micro operating at 405 nm wavelength (λ), calculated with Mie theory (lines), and fitted empirically with a Gaussian function (dotted line). For this flow cytometer, Flow‐SR provides a unique solution for the particle diameter between 0 nm and 600 nm.

References

    1. Aalberts, M. , van Dissel‐Emiliani, F. M. F. , van Adrichem, N. P. H. , van Wijnen, M. , Wauben, M. H. M. , Stout, T. A. E. , & Stoorvogel, W. (2012). Identification of distinct populations of prostasomes that differentially express prostate stem cell antigen, annexin A1, and GLIPR2 in humans. Biology of Reproduction, 86, 82. - PubMed
    1. Arraud, N. , Gounou, C. , Turpin, D. , & Brisson, A. R. (2016). Fluorescence triggering: A general strategy for enumerating and phenotyping extracellular vesicles by flow cytometry. Cytometry Part A, 89, 184–195. - PubMed
    1. Arraud, N. , Linares, R. , Tan, S. , Gounou, C. , Pasquet, J. M. , Mornet, S. , & Brisson, A. R. (2014). Extracellular vesicles from blood plasma: determination of their morphology, size, phenotype and concentration. Journal of Thrombosis and Haemostasis, 12, 614–627. - PubMed
    1. Austin Suthanthiraraj, P. P. , & Graves, S. W. (2013). Fluidics. Current Protocols in Cytometry, 65, 1. - PMC - PubMed
    1. Barranco, I. , Padilla, L. , Parrilla, I. , Álvarez‐Barrientos, A. , Pérez‐Patiño, C. , Peña, F. J. , Martínez, E. A. , Rodriguez‐Martínez, H. , & Roca, J. (2019). Extracellular vesicles isolated from porcine seminal plasma exhibit different tetraspanin expression profiles. Scientific Reports, 9, 1. - PMC - PubMed

Publication types

MeSH terms

LinkOut - more resources