. 2023 May 2;192(1):409-425.
doi: 10.1093/plphys/kiad081.

SCARECROW-like GRAS protein PES positively regulates petunia floral scent production

Affiliations

SCARECROW-like GRAS protein PES positively regulates petunia floral scent production

Ekaterina Shor et al. Plant Physiol. .

Abstract

Emission of scent volatiles by flowers is important for successful pollination and consequently, reproduction. Petunia (Petunia hybrida) floral scent is formed mainly by volatile products of the phenylpropanoid pathway. We identified and characterized a regulator of petunia scent production: the GRAS protein PHENYLPROPANOID EMISSION-REGULATING SCARECROW-LIKE (PES). Its expression increased in petals during bud development and was highest in open flowers. Overexpression of PES increased the production of floral volatiles, while its suppression resulted in scent reduction. We showed that PES upregulates the expression of genes encoding enzymes of the phenylpropanoid and shikimate pathways in petals, and of the core regulator of volatile biosynthesis ODORANT1 by activating its promoter. PES is an ortholog of Arabidopsis (Arabidopsis thaliana) PHYTOCHROME A SIGNAL TRANSDUCTION 1, involved in physiological responses to far-red (FR) light. Analyses of the effect of nonphotosynthetic irradiation (low-intensity FR light) on petunia floral volatiles revealed FR light as a scent-activating factor. While PHYTOCHROME A regulated scent-related gene expression and floral scent production under FR light, the influence of PES on volatile production was not limited by FR light conditions.


Conflict of interest statement

Conflict of interest statement. The authors declare no conflict of interest.

Figures

Figure 1.
Figure 1.
Transcript levels of GRAS protein-encoding PES increase during petunia flower development. A) PES expression in young buds of different lengths and in flowers at anthesis and up to 6 d post anthesis (dpa). Data are means ± SEM (n = 4–7). Data were normalized to EF1α. For statistical analysis, one-way ANOVA with post hoc Tukey HSD test was applied (P < 0.05). B) Domain and conservative motif structure of PES protein. LRI and LRII, leucine heptad repeat motifs; VHIID and PFYRE, motifs named after the most prominent residues.
Figure 2.
Figure 2.
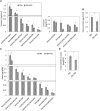
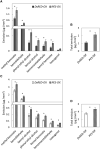
PES suppression negatively affects emission and accumulation of scent volatiles in petunia flowers under FR/D lighting. Petals were inoculated with TRV-PES for transient repression of PES, or with TRV as a control. Emission and internal pools, respectively, of individual compounds (A and C) and total emitted and accumulated volatiles (B and D) were analyzed by GC-MS. Data are means ± SEM (n = 3–6). The significance of differences between treatments was calculated using Student's t-test: *P ≤ 0.05.
Figure 3.
Figure 3.
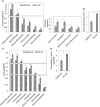
Overexpression of PES enhances emission and accumulation of volatiles in petunia petals under FR/D lighting. Petals were inoculated with Agrobacterium carrying a binary vector with 35S:PES for transient overexpression of PES (PES-OX), or with 35S:DsRED as a control (DsRED-OX). A and B) Emission levels of volatiles. A) Individual compounds. B) Total emission. C and D) Levels of internal pools. C) Individual compounds. D) Total pools. Data are means ± SEM (n = 6–9). The significance of differences between treatments was calculated using Student's t-test: *P ≤ 0.05.
Figure 4.
Figure 4.
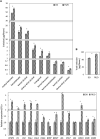
Overexpression of PES activates expression of scent-related genes in petunia flowers. A) Transcript levels of phenylpropanoid/benzenoid-biosynthesis genes and regulators and B) PES in petal tissues transiently overexpressing PES (PES-OX), or DsRED (DsRED-OX) as a control, under FR/D lighting. Samples collected at 19.00. EF1α was used as an internal reference gene. Data are means ± SEM (n = 3–6). C) ODO1 promoter is activated by PES. Expression levels of GUS and PES in petals inoculated with ODO1pro:GUS, 35S:YFP and 35S:PES (PES-OX) or 35S:DsRED (DsRED-OX) as a control. YFP was used as a normalization factor. Data are means ± SEM (n = 5–6). D) PES activates PAAS and IGS promoters. Flowers infiltrated with Agrobacterium carrying PAASpro:DsRED or IGSpro:DsRED with or without 35S:PES (+PES and −PES, respectively) together with 35Spro:YFP, used for normalization, were imaged using DsRED and YFP filters, and DsRED/YFP ratio calculated. Data are means ± SEM (n = 15–35). The significance of the differences between treatments was calculated using Student's t-test: *P ≤ 0.05.
Figure 5.
Figure 5.
FR light activates scent emission and production in petunia flowers. Volatiles were collected from flowers at anthesis and placed under DD or FR/D lighting. A and B) Emission levels of volatiles. A) Individual compounds. B) Total emission. Data are means ± SEM (n = 4–12). C) Expression of scent-related genes. Samples were collected at 1,600 h. EF1α was used as an internal reference gene. Data are means ± SEM (n = 4–6); *P ≤ 0.05 by Student's t-test.
Figure 6.
Figure 6.
PhPHYA suppression decreases scent emission from petunia petals under FR/D light conditions. Flowers at anthesis were inoculated with TRV-PHYA for transient suppression of PhPHYA, or with TRV as a control. A) Emission of separate scent compounds. B) Total volatile emission. Data are means ± SEM (n = 5–7). C) Expression levels of PhPHYA and scent-related genes. Samples were collected at 1,600 h. EF1α was used as an internal reference gene. Data are means ± SEM (n = 4–6); *P ≤ 0.05 by Student's t-test.
Figure 7.
Figure 7.
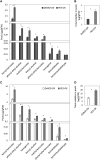
Activating effect of PES overexpression on accumulation of volatiles in internal pools under DD and WL/D conditions. Scent volatiles were analyzed in petals transiently overexpressing PES (PES-OX) or DsRED (DsRED-OX) as a control. Agroinfiltrated flowers were placed under DD (A and B) or under WL/D conditions (C and D), and samples were collected 24 h later. A and C) Individual scent compounds accumulated in internal pools. B and D) Total volatiles in internal pools. Data are means ± SEM (n = 5–8); *P ≤ 0.05 by Student's t-test.
Figure 8.
Figure 8.
PES overexpression increases emission of floral volatiles under DD and WL/D conditions. VOCs, emitted from petals transiently overexpressing PES (PES-OX) or DsRED (DsRED-OX) as a control, were analyzed. A and B) Agroinfiltrated flowers were placed under DD or C and D, under WL/D conditions, and localized headspace was initiated 24 h later. A and C) Individual emitted scent compounds. B and D) Total emitted volatiles. Data are means ± SEM (n = 7–8); *P ≤ 0.05 by Student's t-test.
Figure 9.
Figure 9.
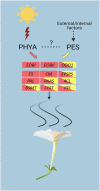
A proposed model showing involvement of FR light and PES protein in regulation of petunia floral scent. PES and PHYA act as positive transcriptional regulators of scent production in petunia flowers. Scent-related genes activated by PHYA are shown in red, and those activated by both PHYA and PES in red/yellow. Dashed arrows represent hypothetical interactions. PES, PHENYLPROPANOID EMISSION-REGULATING SCARECROW-LIKE; PHYA, PHYTOCHROME A; EOBI and II, EMISSION OF BENZENOIDS I and II; ODO1, ODORANT1; CS, CHORISMATE SYNTHASE; CM, CHORISMATE MUTASE; EPSPS, 5-ENOL-PYRUVYLSHIKIMATE-3-PHOSPHATE SYNTHASE; PAL, L-PHENYLALANINE AMMONIA LYASE; PAAS, PHENYLACETALDEHYDE SYNTHASE; BSMT, S-ADENOSYL-L-METHIONINE:BENZOIC ACID/SALICYLIC ACID CARBOXYL METHYLTRANSFERASE; 4CL, 4-COUMARATE:CoA LIGASE; CFAT, CONIFERYL ALCOHOL ACETYLTRANSFERASE; IGS, ISOEUGENOL SYNTHASE.

Similar articles

Cited by

References

    1. Albo B. Transcription factor EOB1: a key component in a network regulating production of phenylpropanoid scent compounds in petunia flowers [thesis]. The Hebrew University of Jerusalem, Rehovot, Israel. 2012.
    1. Bae G, Choi G. Decoding of light signals by plant phytochromes and their interacting proteins. Annu Rev Plant Biol. 2008:59(1):281–311. 10.1146/annurev.arplant.59.032607.092859 - DOI - PubMed
    1. Bloch G, Bar-Shai N, Cytter Y, Green R. Time is honey: circadian clocks of bees and flowers and how their interactions may influence ecological communities. Philos Trans R Soc B Biol Sci. 2017:372(1734):20160256. 10.1098/rstb.2016.0256 - DOI - PMC - PubMed
    1. Boatright J, Negre F, Chen X, Kish CM, Wood B, Peel G, Orlova I, Gang D, Rhodes D, Dudareva N. Understanding in vivo benzenoid metabolism in petunia petal tissue. Plant Physiol. 2004:135(4):1993–2011. 10.1104/pp.104.045468 - DOI - PMC - PubMed
    1. Bodenhofer U, Bonatesta E, Horejš-Kainrath C, Hochreiter S. msa: an R package for multiple sequence alignment. Bioinformatics. 2015:31(24): 3997–3999.10.1093/bioinformatics/btv494 - DOI - PubMed

Publication types

LinkOut - more resources