. 2022 Dec:102:95-132.
doi: 10.3114/sim.2022.102.03. Epub 2022 Dec 19.

Reducing the number of accepted species in Aspergillus series Nigri

Affiliations

Reducing the number of accepted species in Aspergillus series Nigri

C Bian et al. Stud Mycol. 2022 Dec.

Abstract

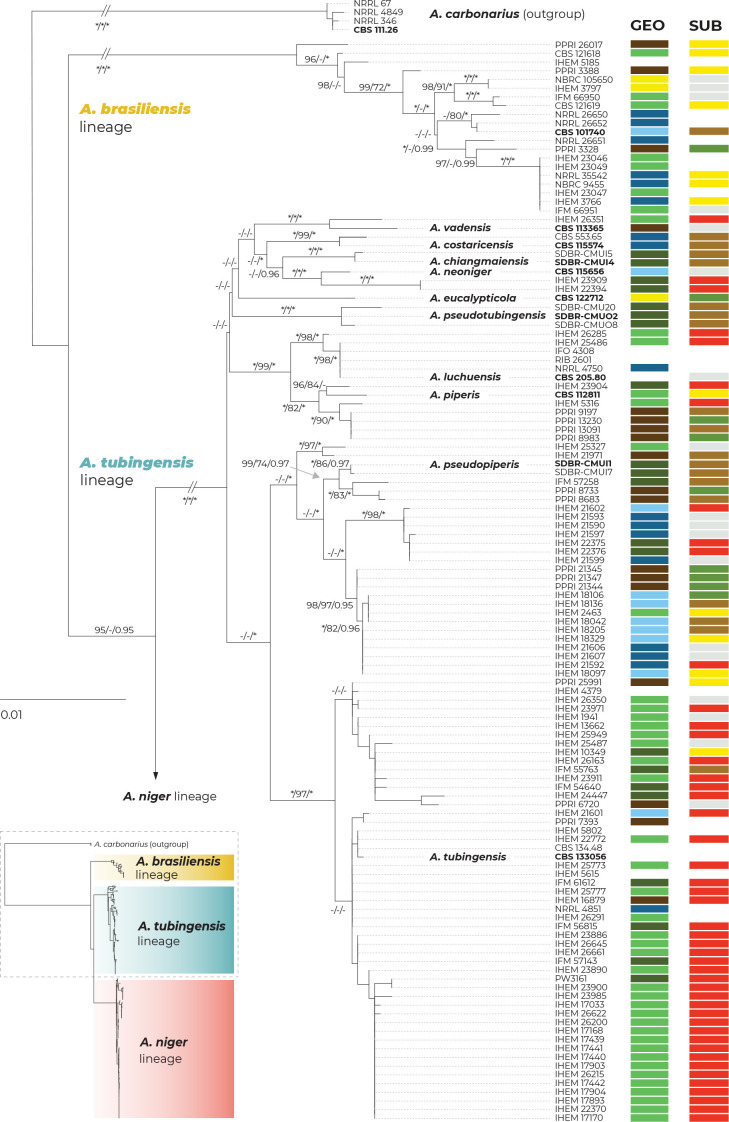
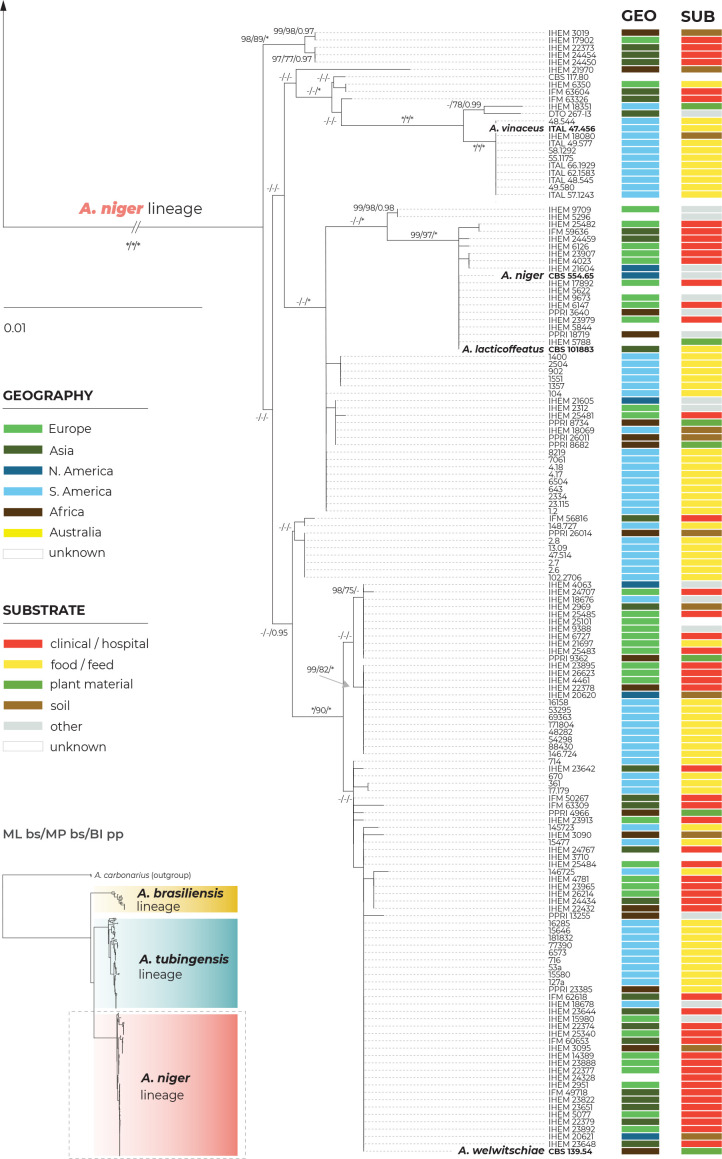
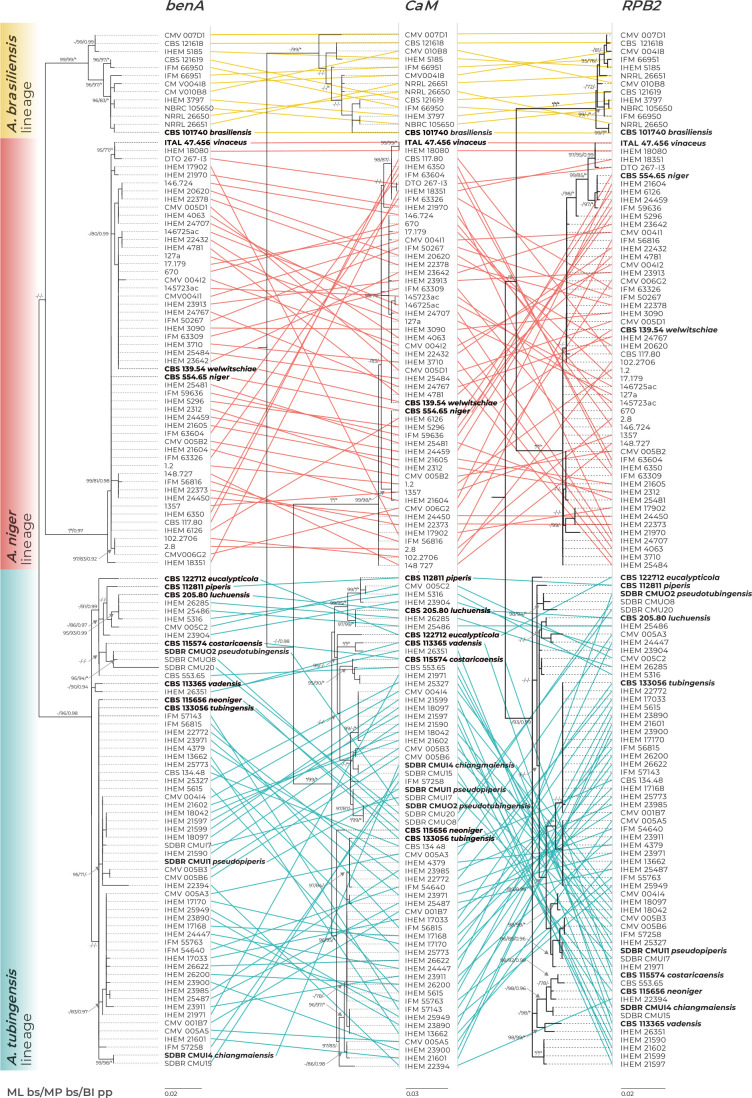
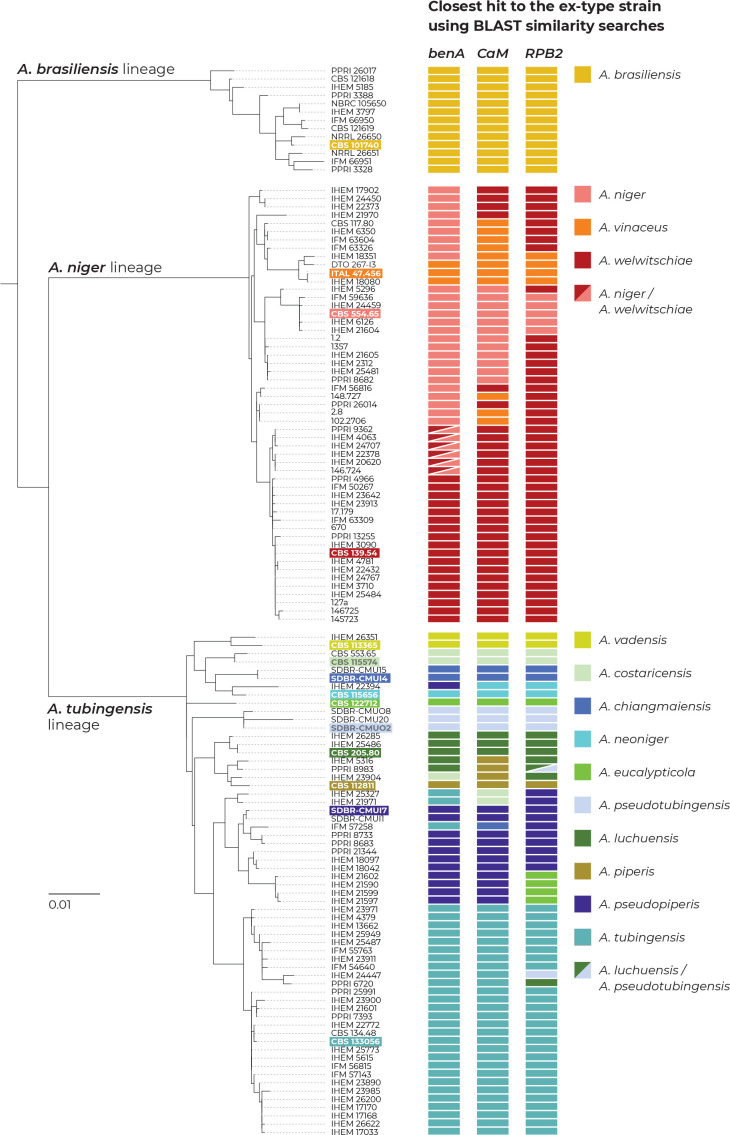
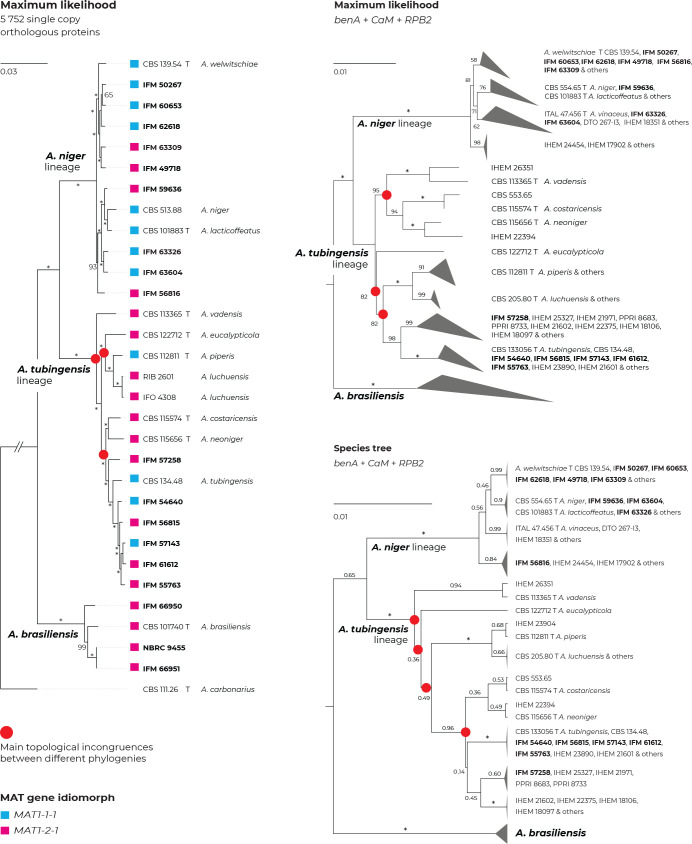
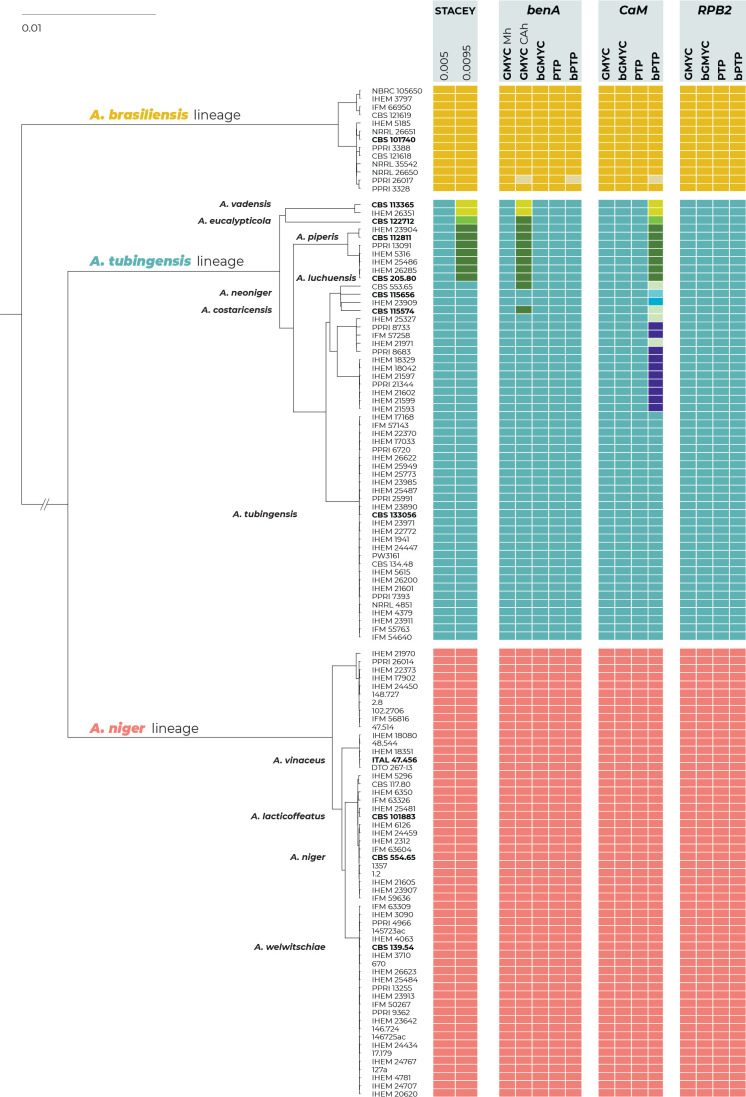
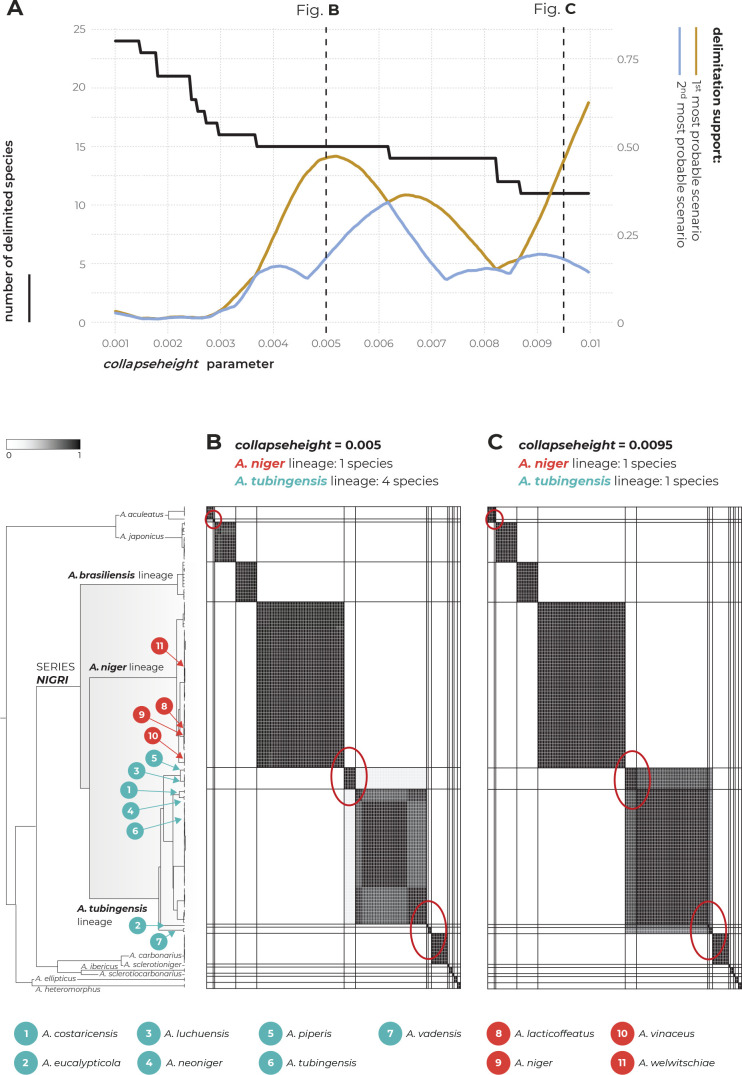
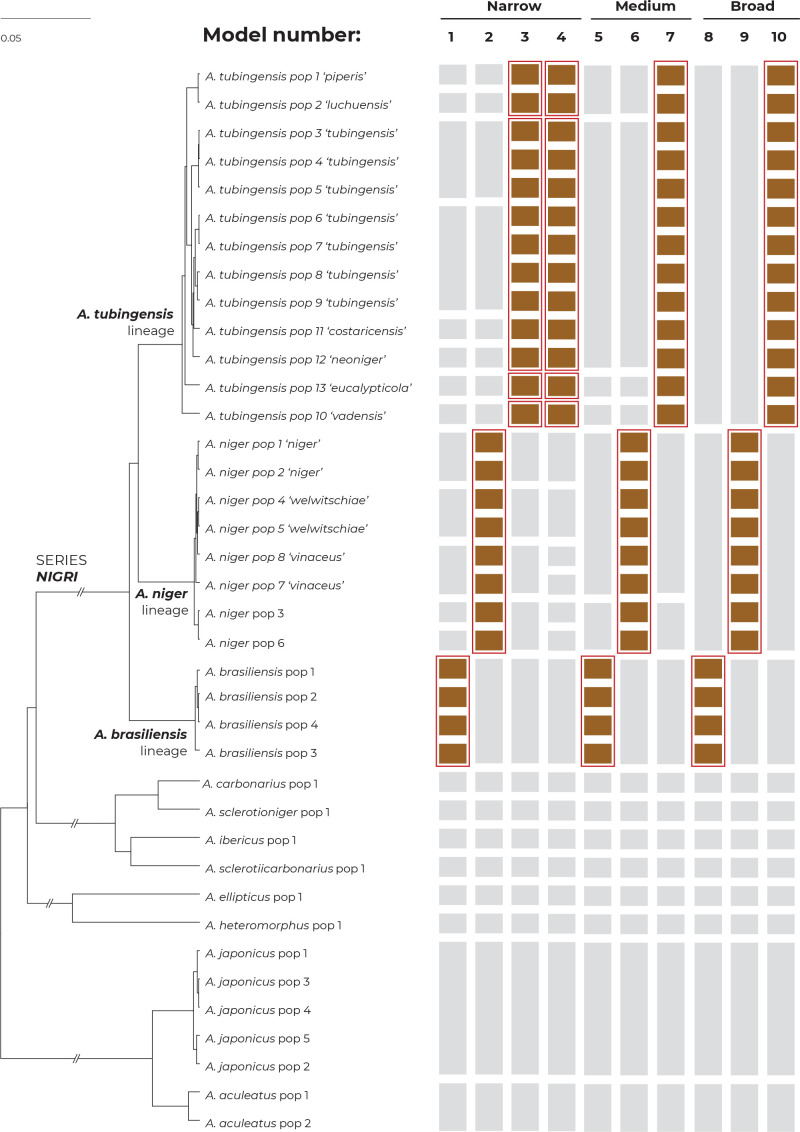
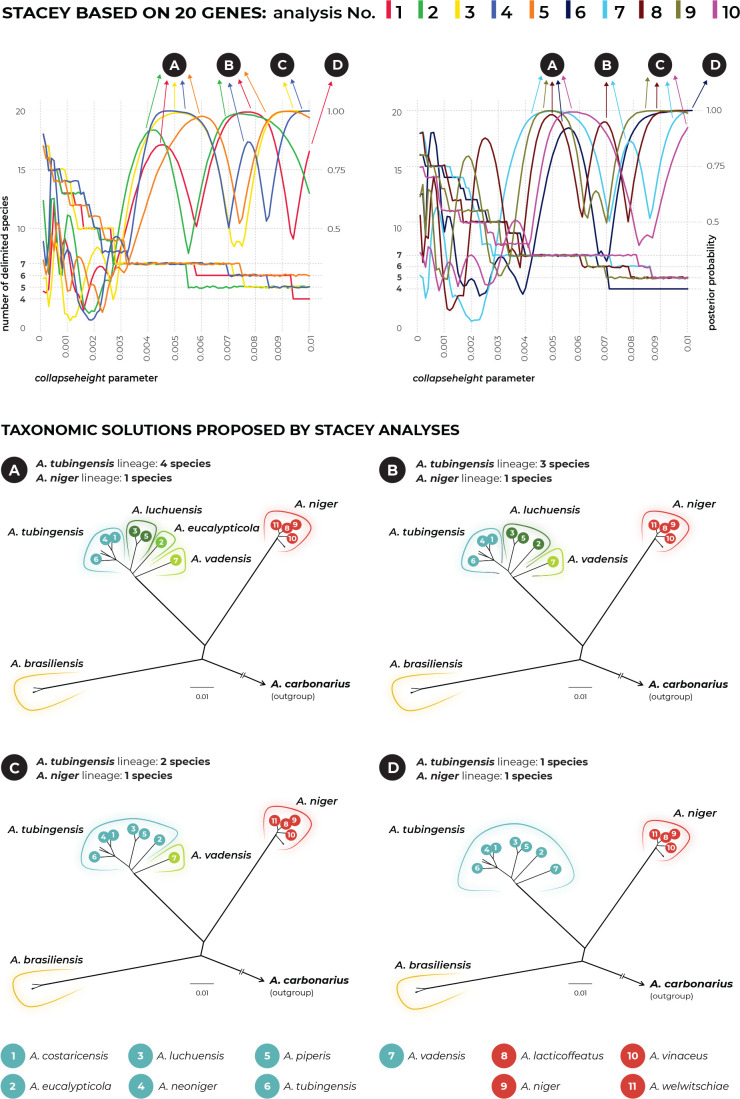
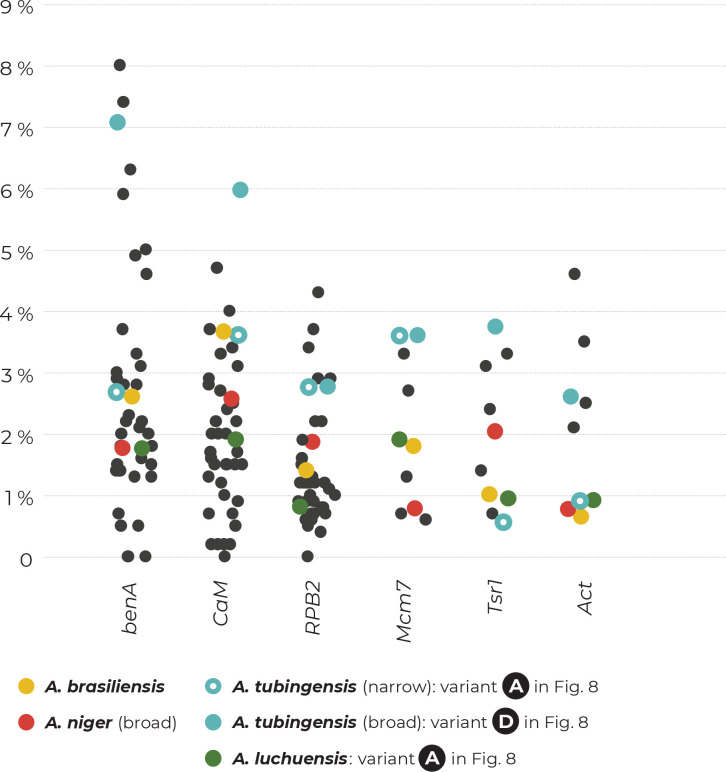
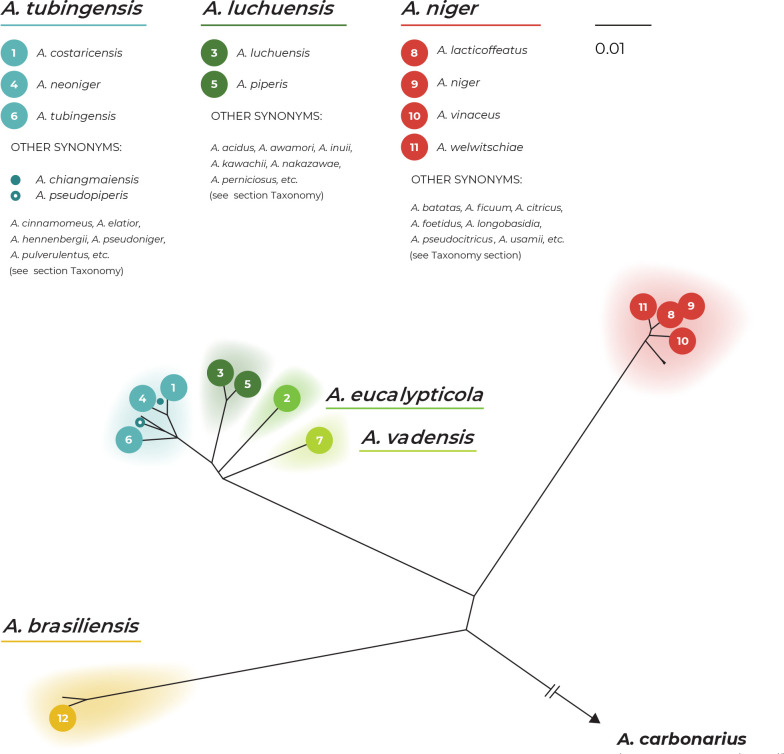
The Aspergillus series Nigri contains biotechnologically and medically important species. They can produce hazardous mycotoxins, which is relevant due to the frequent occurrence of these species on foodstuffs and in the indoor environment. The taxonomy of the series has undergone numerous rearrangements, and currently, there are 14 species accepted in the series, most of which are considered cryptic. Species-level identifications are, however, problematic or impossible for many isolates even when using DNA sequencing or MALDI-TOF mass spectrometry, indicating a possible problem in the definition of species limits or the presence of undescribed species diversity. To re-examine the species boundaries, we collected DNA sequences from three phylogenetic markers (benA, CaM and RPB2) for 276 strains from series Nigri and generated 18 new whole-genome sequences. With the three-gene dataset, we employed phylogenetic methods based on the multispecies coalescence model, including four single-locus methods (GMYC, bGMYC, PTP and bPTP) and one multilocus method (STACEY). From a total of 15 methods and their various settings, 11 supported the recognition of only three species corresponding to the three main phylogenetic lineages: A. niger, A. tubingensis and A. brasiliensis. Similarly, recognition of these three species was supported by the GCPSR approach (Genealogical Concordance Phylogenetic Species Recognition) and analysis in DELINEATE software. We also showed that the phylogeny based on benA, CaM and RPB2 is suboptimal and displays significant differences from a phylogeny constructed using 5 752 single-copy orthologous proteins; therefore, the results of the delimitation methods may be subject to a higher than usual level of uncertainty. To overcome this, we randomly selected 200 genes from these genomes and performed ten independent STACEY analyses, each with 20 genes. All analyses supported the recognition of only one species in the A. niger and A. brasiliensis lineages, while one to four species were inconsistently delimited in the A. tubingensis lineage. After considering all of these results and their practical implications, we propose that the revised series Nigri includes six species: A. brasiliensis, A. eucalypticola, A. luchuensis (syn. A. piperis), A. niger (syn. A. vinaceus and A. welwitschiae), A. tubingensis (syn. A. chiangmaiensis, A. costaricensis, A. neoniger and A. pseudopiperis) and A. vadensis. We also showed that the intraspecific genetic variability in the redefined A. niger and A. tubingensis does not deviate from that commonly found in other aspergilli. We supplemented the study with a list of accepted species, synonyms and unresolved names, some of which may threaten the stability of the current taxonomy. Citation: Bian C, Kusuya Y, Sklenář F, D'hooge E, Yaguchi T, Ban S, Visagie CM, Houbraken J, Takahashi H, Hubka V (2022). Reducing the number of accepted species in Aspergillus series Nigri. Studies in Mycology 102: 95-132. doi: 10.3114/sim.2022.102.03.

Keywords: Aspergillus luchuensis; Aspergillus niger; Aspergillus tubingensis; clinical fungi; indoor fungi; infraspecific variability; multigene phylogeny, multispecies coalescence model; ochratoxin A; species delimitation.


Conflict of interest statement

The authors declare that there is no conflict of interest.

Figures

Fig. 1.
Fig. 1.
Multilocus phylogeny of Aspergillus series Nigri based on three loci (benA, CaM, RPB2) and 276 isolates (and four A. carbonarius isolates as an outgroup). The best-scoring maximum likelihood (ML) tree inferred in the IQ-TREE is shown; ultrafast bootstrap support values (ML bs) are appended to nodes along with maximum parsimony bootstrap support values (MP bs) and Bayesian inference posterior probabilities (BI pp); only support values ≥95 %, ≥70 % and ≥0.95, respectively, are shown; a dash indicates lower statistical support for a specific node or the absence of a node in the phylogeny while an asterisk indicates full support; the ex-type strains are designated with a bold print; the information on geographic origin and isolation source is plotted on the tree (see legend). Alignment characteristics, partitioning schemes and substitution models are listed in Supplementary Table S1.
Fig. 1.
Fig. 1.
Multilocus phylogeny of Aspergillus series Nigri based on three loci (benA, CaM, RPB2) and 276 isolates (and four A. carbonarius isolates as an outgroup). The best-scoring maximum likelihood (ML) tree inferred in the IQ-TREE is shown; ultrafast bootstrap support values (ML bs) are appended to nodes along with maximum parsimony bootstrap support values (MP bs) and Bayesian inference posterior probabilities (BI pp); only support values ≥95 %, ≥70 % and ≥0.95, respectively, are shown; a dash indicates lower statistical support for a specific node or the absence of a node in the phylogeny while an asterisk indicates full support; the ex-type strains are designated with a bold print; the information on geographic origin and isolation source is plotted on the tree (see legend). Alignment characteristics, partitioning schemes and substitution models are listed in Supplementary Table S1.
Fig. 2.
Fig. 2.
Comparison of single-gene genealogies based on the benA, CaM and RPB2 loci and created by three different phylogenetic methods (only one isolate per unique multilocus haplotype is included in each phylogeny). The coloured connecting lines show changes in the positions of isolates between single-gene trees (the branches were rotated so that the trees maximally correspond to each other). Best-scoring single-locus maximum likelihood (ML) trees are shown; ML ultrafast bootstrap support values (ML bs), maximum parsimony bootstrap support values (MP bs) and Bayesian inference posterior probabilities (BI pp) are appended to nodes. Only support values ≥95 %, ≥70 % and ≥0.95, respectively, are shown. A dash indicates lower statistical support for a specific node, or the absence of a node in the phylogeny, while an asterisk indicates full support. The ex-type strains are designated with a bold print. Alignment characteristics, partitioning schemes and substitution models are listed in Supplementary Table S1.
Fig. 3.
Fig. 3.
The results of BLAST similarity searches of three loci (benA, CaM and RPB2) derived from strains with unique multilocus haplotypes across the genetic diversity of series Nigri. Coloured rectangles represent the closest hits to one of the 14 ex-type strains (every species has its unique colour; the ex-type of A. lacticoffeatus was omitted because it has an identical genotype to the ex-type of A. niger). If there was an identical similarity to two ex-type strains, the rectangles were diagonally divided. Ex-type isolates are marked with bold font and a coloured background. The phylogenetic tree was calculated in IQ-TREE using partitioned analysis and 105 ultrafast bootstrap replicates.
Fig. 4.
Fig. 4.
Comparison of topologies of phylogenetic trees constructed on the basis of different methods and data. Incongruences between phylogenies are designated with red circles. Maximum likelihood (ML) tree constructed based on the 5 752 orthologous proteins extracted from the 31 whole genome sequences (WGS; Supplementary Table S3) (left side); ML tree based on benA, CaM and RPB2 loci estimated in IQ-TREE (top right); species tree based on benA, CaM and RPB2 loci estimated in starBEAST (bottom right); the last two mentioned trees were constructed from combined three-gene alignments reduced to unique multilocus haplotypes (Table S5), and A. chiangmaiensis, A. pseudopiperis and A. pseudotubingensis were excluded. The most significant differences can be observed in the positions of A. neoniger, A. costaricensis and A. eucalypticola. Bootstrap support values or posterior probabilities are appended to the nodes, the support values equal to 100 % and 1.00, respectively, are designated with an asterisk; the ex-type strains are designated with the letter “T”. Isolates for which whole genomic sequences were generated in this study are designated with a bold print; mating-type gene idiomorphs are plotted on the tree based on the WGS data.
Fig. 5.
Fig. 5.
Schematic representation of the results of species delimitation methods in the series Nigri. One multilocus method (STACEY) and four single-locus methods (GMYC, bGMYC, PTP, bPTP) were applied to a dataset of three loci (benA, CaM, RPB2). The results are depicted by coloured bars with different colours or shades indicating species delimited by specific methods and settings. Ex-type isolates are highlighted with a bold print. The STACEY results with two collapseheight parameter values, 0.005 and 0.0095, are shown. For the GMYC method, the coalescent constant population tree model was used as an input with both common ancestor heights (CAh) and median height (Mh) settings (both settings are only shown when they produced different delimitation results). The phylogenetic tree was calculated by STACEY analysis and is used solely for the comprehensive presentation of the results from different methods.
Fig. 6.
Fig. 6.
The results of species delimitation by using the STACEY method based on the three loci: benA, CaM and RPB2. (A) Dependence of the delimitation results on the collapseheight parameter. The black solid line represents the number of delimited species (left y-axis) depending on the changing value of the collapseheight parameter (x-axis). The yellow line represents the probability (range from 0 to 1, right y-axis) of the most likely scenario at specific collapseheight value. The blue line represents the probability of the second most probable scenario at a specific collapseheight value; curves representing other less probable scenarios are omitted. Dashed vertical lines mark two values of the collapseheight parameter (0.005 and 0.0095) whose results are shown in detail by similarity matrices in subfigures B and C. The similarity matrices give the posterior probability of every two isolates belonging to the same multispecies coalescent cluster (tentative species). The darkest black shade corresponds to a posterior probability of 1, while the white colour is equal to 0. Thicker horizontal and vertical lines in the similarity matrices delimit species or their populations that gained delimitation support in some scenarios.
Fig. 7.
Fig. 7.
Species delimitation using DELINEATE software. In total, ten models of species boundaries were set up and tested. The brown bars represent unassigned populations left free to be delimited, while the grey bars represent the predefined species. The resulting solutions suggested by DELINEATE are depicted by red frames around the bars. The populations were delimited by using BPP software; isolates belonging to each population are listed in Supplementary Table S2. The displayed tree was calculated in starBEAST based on the benA, CaM and RPB2 loci and is only used for the comprehensive presentation of the results from different models.
Fig. 8.
Fig. 8.
Species delimitation results from ten independent STACEY analyses, each based on 20 genes randomly selected from genomes of series Nigri species (n = 30; plus one genome of A. carbonarius as the outgroup). The upper part of the figure shows the dependence of the delimitation results on the changing value of the collapseheight parameter; each analysis is designated with a different colour. There are two curves for each analysis, the first representing the number of delimited species (left y-axis) and the second representing the probability of the most likely species delimitation scenario at a specific collapseheight value (ranging from 0 to 1, right y-axis). Every analysis proposed two to three taxonomic solutions having similar probabilities. In total, there were four possible scenarios (A, B, C, D) differing in the number of delimited species within the A. tubingensis lineage (one to four species). These delimitation results are schematically shown in the lower part of the figure. The list of genes used in every analysis can be found in Supplementary Table S4.
Fig. 9.
Fig. 9.
Jitter plot showing maximum sequence dissimilarity between isolates of the same Aspergillus species whose species limits have been delimited using methods based on a multispecies coalescent model. Only species represented by isolates from at least three countries were included to ensure relevant sampling and thus representative intraspecific genetic variability. In total, 34 species were included that were classified outside section Nigri. The data from benA, CaM and RPB2 were collected from all 34 species, while less common markers (minichromosome maintenance factor 7 - Mcm7, ribosome biogenesis protein - Tsr1 and actin - Act) were available for only a limited number of species. Species belonging to the series Nigri are designated with coloured circles. The basic data used for construction of the jitter plot are listed in the Supplementary Table S6.
Fig. 10.
Fig. 10.
Taxonomic rearrangement of series Nigri into six species with marked synonymizations. The proposed taxonomy is schematically shown in the form of a radial tree (species tree based on benA, CaM and RPB2 calculated in starBEAST). The positions of A. chiangmaiensis and A. pseudopiperis are approximated based on the tree shown in Figs 1, 3 as they were not included in this phylogenetic analysis.

Similar articles

Cited by

References

    1. Ahrens D, Fujisawa T, Krammer H-J, et al. (2016). Rarity and incomplete sampling in DNA-based species delimitation. Systematic Biology 65: 478–494. - PubMed
    1. Alcazar-Fuoli L, Mellado E, Alastruey-Izquierdo A, et al. (2009). Species identification and antifungal susceptibility patterns of species belonging to Aspergillus section Nigri. Antimicrobial Agents and Chemotherapy 53: 4514–4517. - PMC - PubMed
    1. Al-Musallam (1980). A revision of the black Aspergillus species. Ph.D. dissertation. Rijksuniversiteit; Utrecht, Netherlands.
    1. Andersen MR, Salazar MP, Schaap PJ, et al. (2011). Comparative genomics of citric-acid-producing Aspergillus niger ATCC 1015 versus enzyme-producing CBS 513.88. Genome Research 21: 885–897. - PMC - PubMed
    1. Bairoch A, Apweiler R. (2000). The SWISS-PROT protein sequence database and its supplement TrEMBL in 2000. Nucleic Acids Research 28: 45–48. - PMC - PubMed

LinkOut - more resources