. 2023 Jan 25:9:1018298.
doi: 10.3389/fmed.2022.1018298. eCollection 2022.

Senescent renal tubular epithelial cells activate fibroblasts by secreting Shh to promote the progression of diabetic kidney disease

Affiliations

Senescent renal tubular epithelial cells activate fibroblasts by secreting Shh to promote the progression of diabetic kidney disease

Dan Wang et al. Front Med (Lausanne). .

Abstract

Introduction: Diabetic kidney disease (DKD) is one of the complications of diabetes; however, the pathogenesis is not yet clear. A recent study has shown that senescence is associated with the course of DKD. In the present study, we explored whether senescent renal tubular cells promote renal tubulointerstitial fibrosis by secreting Sonic hedgehog (Shh) which mediates fibroblast activation and proliferation in DKD.

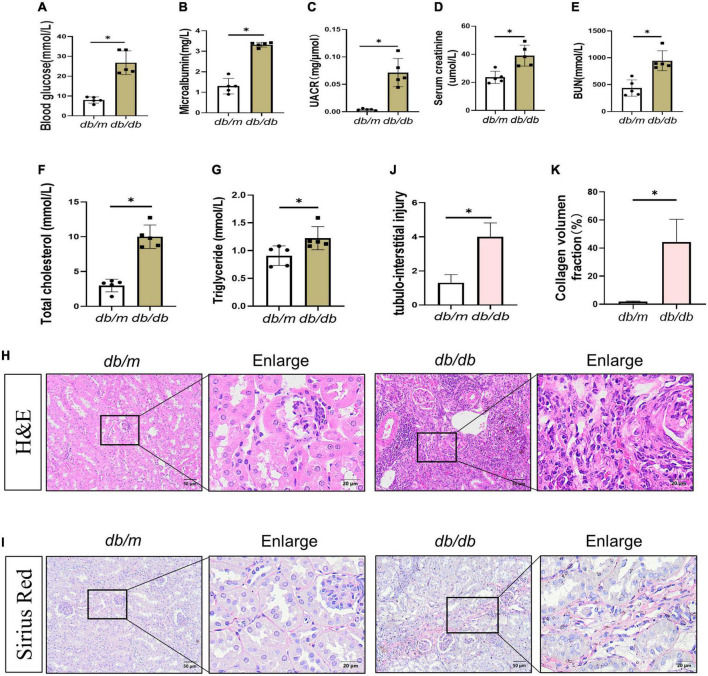
Methods: A 36-week-old db/db mice model and the renal tubular epithelial cells were cultured in high glucose (HG, 60 mmol/L) medium for in vivo and in vitro experiments.

Results: Compared to db/m mice, blood glucose, microalbuminuria, serum creatinine, urea nitrogen, and UACR (microalbuminuria/urine creatinine) were markedly increased in db/db mice. Collagen III, monocyte chemoattractant protein-1 (MCP-1), and tumor necrosis factor-alpha (TNF-α) were also increased in db/db mice kidneys, suggesting fibrosis and inflammation in the organ. Moreover, the detection of SA-β-galactosidase (SA-β-Gal) showed that the activity of SA-β-Gal in the cytoplasm of renal tubular epithelial cells increased, and the cell cycle inhibition of the expression of senescence-related gene cell cycle inhibitor p16 INK4A protein and p21 protein increased, indicating that renal fibrosis in db/db mice was accompanied by cell senescence. Furthermore, Shh is highly expressed in the injured renal tubules and in the kidney tissue of db/db mice, as detected by enzyme-linked immunosorbent assay (ELISA). The results of immunofluorescence staining showed increased positive staining for Shh in renal tubular epithelial cells of db/db mice and decreased positive staining for Lamin B1, but increased positive staining for γH2A.X in cells with high Shh expression; similar results were obtained in vitro. In addition, HG stimulated renal tubular epithelial cells to secrete Shh in the supernatant of the medium. D-gal treatment of renal tubular epithelial cells increased the protein levels of Shh and p21. We also found enhanced activation and proliferation of fibroblasts cultured with the supernatant of renal tubular epithelial cells stimulated by HG medium but the proliferative effect was significantly diminished when co-cultured with cyclopamine (CPN), an inhibitor of the Shh pathway.

Discussion: In conclusion, HG induces renal tubular epithelial cell senescence, and the secretion of senescence-associated proteins and Shh mediates inflammatory responses and fibroblast activation and proliferation, ultimately leading to renal fibrosis.

Keywords: SASP; Shh; diabetic kidney disease; inflammation; renal tubular epithelial cells; senescence.


Conflict of interest statement

The authors declare that the research was conducted in the absence of any commercial or financial relationships that could be construed as a potential conflict of interest.

Figures

FIGURE 1
FIGURE 1
Changes in biochemical indexes and renal morphology in db/db mice. (A–E) Blood glucose (A), microalbumin (B), UACR (C), serum creatinine (D), blood urea nitrogen (E), total cholesterol (F), and triglyceride (G) levels were increased. H&E staining (H) showed kidney histologic changes in db/db mice and db/m mice at 36 weeks and to assess the tubular injury index (J). Bar = 50 μm. Boxed areas are enlarged. Bar = 20 μm. (I,K) Sirius red staining (SR) showed collagen deposition in db/db mice kidneys at 36 weeks (I), collagen deposition fraction (K). Boxed areas are enlarged. Bar = 20 μm. All data are presented as mean ± standard deviation (SD) from three independent experiments. n = 5; *P < 0.05 vs. db/m group.
FIGURE 2
FIGURE 2
Senescence in the process of diabetic kidney disease (DKD). Western blot analyses showed kidney p21 and p16INK4A protein in renal tissues. Representative Western blot (A) and quantitative data (B,C) are presented. (D,F) Immunohistochemical staining showed p16INK4A expression in db/db mice and db/m mice diseased kidneys. Black arrows indicate positive staining in tubules. Boxed areas are enlarged. Bar = 20 μm. (E,G) Detection of SA-β-galactosidase (SA-β-Gal) activity in renal tissue. (E) Representative images of renal tissues are shown. Scale bar = 50 μm. The ratio of SA-β-Gal-positive cells is presented in the panel (G). All data are presented as mean ± standard deviation (SD) from three independent experiments. n = 5; *P < 0.05 vs. db/m group.
FIGURE 3
FIGURE 3
Fibrosis and senescence-associated secretory phenotype (SASP) in the process of diabetic kidney disease (DKD). (A,D) Western blot analyses showed FN, PDGFR-β, and Vimentin protein in renal tissues. Representative Western blot (A) and quantitative data (D) are presented. (B,C,E,F) Western blot analyses showed Sonic hedgehog (Shh) (precursor), Shh-N, tumor necrosis factor-alpha (TNF-α), and MCP-1 protein in renal tissues. Representative Western blot (B,C) and quantitative data (E,F) are presented. (G,H) Representative micrographs showed immunofluorescence staining of Collagen-III in different groups (G), and quantitative analysis (H). DAPI staining (blue) represents cell nucleus, Bar = 20 μm. All data are presented as mean ± standard deviation (SD) from three independent experiments. n = 5; *P < 0.05 vs. db/m group.
FIGURE 4
FIGURE 4
Expression and distribution of Sonic hedgehog (Shh) in the process of diabetic kidney disease (DKD). (A) The content of Shh in renal tissue was detected by enzyme-linked immunosorbent assay (ELISA). (B,C) Representative micrographs show immunohistochemical staining of Shh in different groups (B) and quantitative analysis (C) of Shh. (D) Representative micrographs showed immunofluorescence staining of Lamin B1 and Shh in different groups. DAPI staining (blue) represents cell nucleus, Bar = 20 μm. The enlarge images indicate the co-expression of positive staining cells. Bar = 5 μm. (E) Representative micrographs showed immunofluorescence staining of γH2A.X and Shh in different groups. White arrows indicate the co-expression of positive staining cells. DAPI staining (blue) represents cell nucleus, Bar = 20 μm. All data are presented as mean ± standard deviation (SD) from three independent experiments. n = 5; *P < 0.05 vs. db/m group.
FIGURE 5
FIGURE 5
High glucose (HG) mediates renal tubular epithelial cell senescence and fibrosis. (A,B) Western blot analyses showed p16INK4A protein in each cell group. Representative Western blot (A) and quantitative data (B) are presented. (C,D) Detection of SA-β-galactosidase (SA-β-Gal) activity in renal tubular epithelial cells. (C) Representative images of renal tubular epithelial cells are shown. The ratio of SA-β-Gal-positive cells is presented in the panel (D). Scale bar = 200 μm. (E,F) Western blot analyses showed the FN protein level in each cell group. Representative Western blot (E) and quantitative data (F) are presented. (G,H) Flow cytometry analysis of each group of cell cycle (G) and quantitative data (H). HG prevents cell exit from G1 into S phase. Represents the high percentage of G1 phase in the HG group than in the NG group. (I,J) Western blot analyses showed Sonic hedgehog (Shh) and p21 protein in each cell group. Representative Western blot (I) and quantitative data (J) are presented. (K) 4 mg/ml D-gal intervention in NRK-52E cells. Representative micrographs showed immunofluorescence staining of γH2A.X and Shh in different groups. DAPI staining (blue) represents cell nucleus, Bar = 10 μm. All data are presented as mean ± standard deviation (SD) from three independent experiments. n = 3; *P < 0.05 vs. NC group.
FIGURE 6
FIGURE 6
Activation and proliferation of fibroblasts stimulated by HG condition medium. (A) Schematic diagram of NRK-49F cell culture with supernatant of condition medium. (B–D) Western blot analyses showed Sonic hedgehog (Shh) and p21 protein in each group. Representative Western blot (B) and quantitative data (C,D) are presented. (E) Shh was detected by enzyme-linked immunosorbent assay (ELISA) in condition medium of each group. (F,G) NRK-49F cells were cultured with condition medium for 72 h. Western blot analysis showed Vimentin, proliferating cell nuclear antigen (PCNA), and PDGFR-β protein in each group. Representative Western blot (F) and quantitative data (G) are presented. (H,I) NRK-49F cells cultured in the condition medium with or without CPN (5 nM, 10 nM). Western blot analysis showed Vimentin, PCNA, and PDGFR-β protein in each group. Representative Western blot (H) and quantitative data (I) are presented. All data are presented as mean ± standard deviation (SD) from three independent experiments. n = 3; *P < 0 05 vs. NC group.

Similar articles

Cited by

References

    1. Cloete L. Diabetes mellitus: an overview of the types, symptoms, complications and management. Nurs Stand. (2022) 37:61–6. 10.7748/ns.2021.e11709 - DOI - PubMed
    1. Wouk N. End-stage renal disease: medical management. Am Fam Phys. (2021) 104:493–9. - PubMed
    1. Fu B, Yang J, Chen J, Lin L, Chen K, Zhang W, et al. Preventive effect of Shenkang injection against high glucose-induced senescence of renal tubular cells. Front Med. (2019) 13:267–76. 10.1007/s11684-017-0586-8 - DOI - PubMed
    1. Luo C, Zhou S, Zhou Z, Liu Y, Yang L, Liu J, et al. Wnt9a promotes renal fibrosis by accelerating cellular senescence in tubular epithelial cells. J Am Soc Nephrol. (2018) 29:1238–56. 10.1681/ASN.2017050574 - DOI - PMC - PubMed
    1. Kitada K, Nakano D, Ohsaki H, Hitomi H, Minamino T, Yatabe J, et al. Hyperglycemia causes cellular senescence via a SGLT2- and p21-dependent pathway in proximal tubules in the early stage of diabetic nephropathy. J Diabetes Complications. (2014) 28:604–11. 10.1016/j.jdiacomp.2014.05.010 - DOI - PMC - PubMed