. 2023 Jan 24:13:974172.
doi: 10.3389/fpsyg.2022.974172. eCollection 2022.

Perception of effort and the allocation of physical resources: A generalization to upper-limb motor tasks

Affiliations

Perception of effort and the allocation of physical resources: A generalization to upper-limb motor tasks

Marie Payen de la Garanderie et al. Front Psychol. .

Abstract

Purpose: The perception of effort (PE) is widely used to prescribe and monitor exercise during locomotor and resistance tasks. The present study examines the validity of PE to prescribe and monitor exercise during upper-limb motor tasks under various loads and speed requirements.

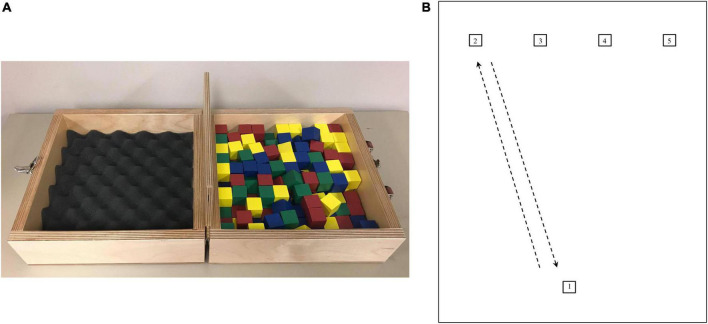
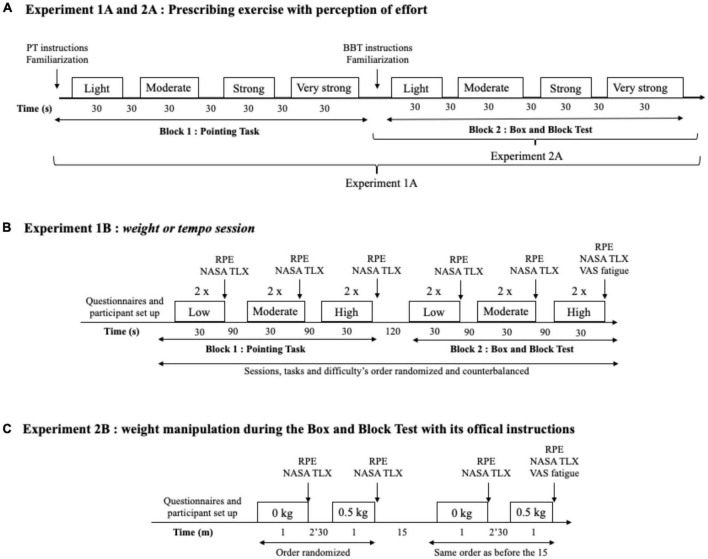
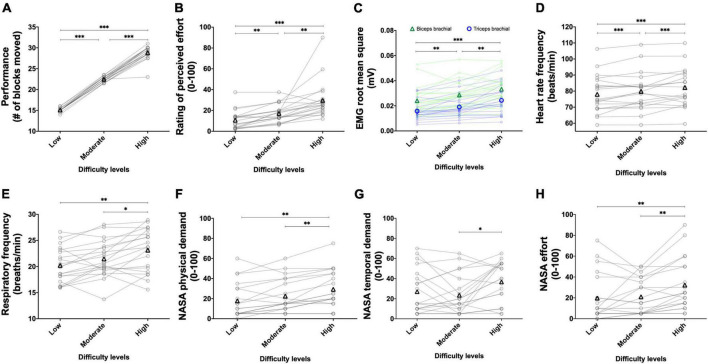
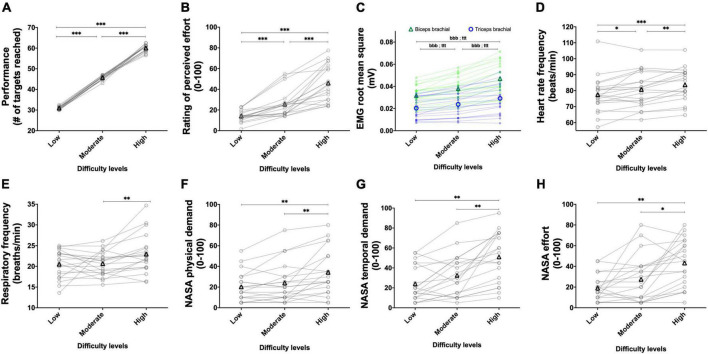
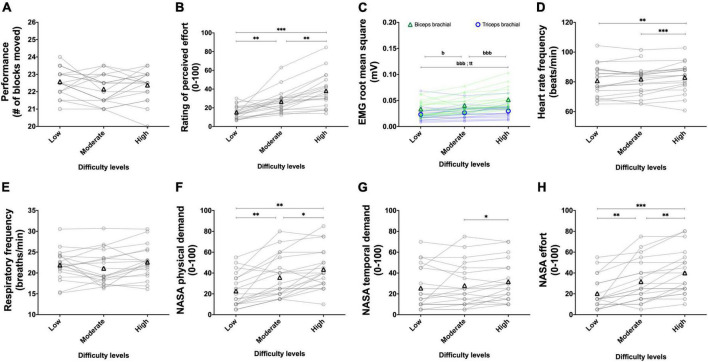
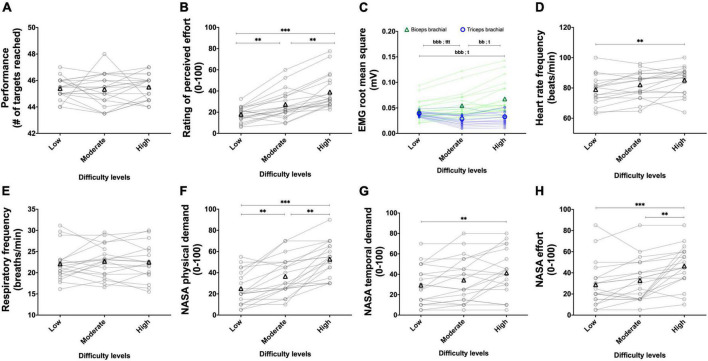
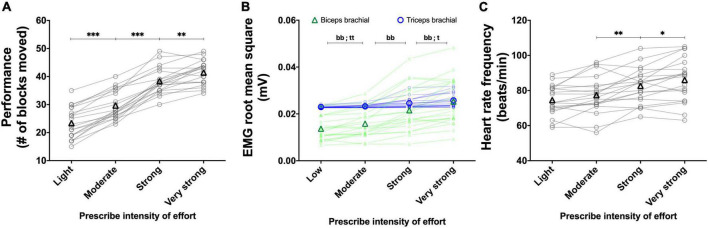
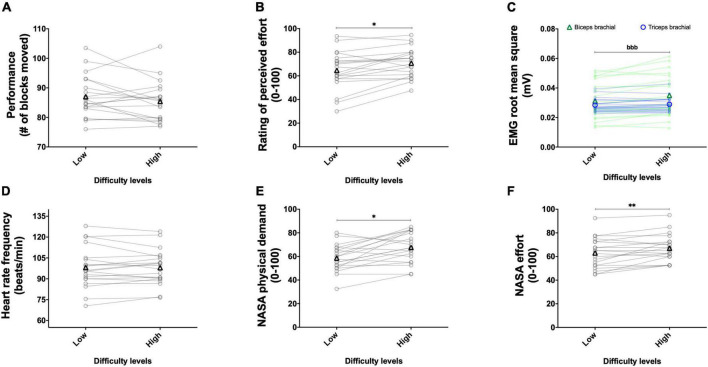
Methods: Forty participants volunteered in two experiments. In experiment 1, we used four PE intensities to prescribe exercise on a modified version of the box and block test (BBT) and a pointing task. We investigated the possibility of monitoring the exercise intensity by tracking changes in PE rating in response to three different tempos or additional weights. Experiment 2 replicated the possibility of prescribing the exercise with the PE intensity during the BBT and explored the impact of additional weights on performance and PE during the standardized version of the BBT. Muscle activation, heart rate, and respiratory frequencies were recorded.

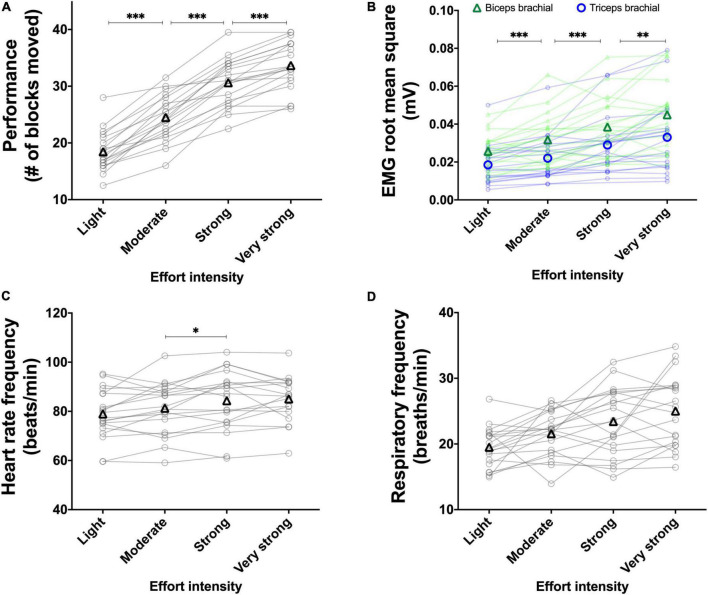
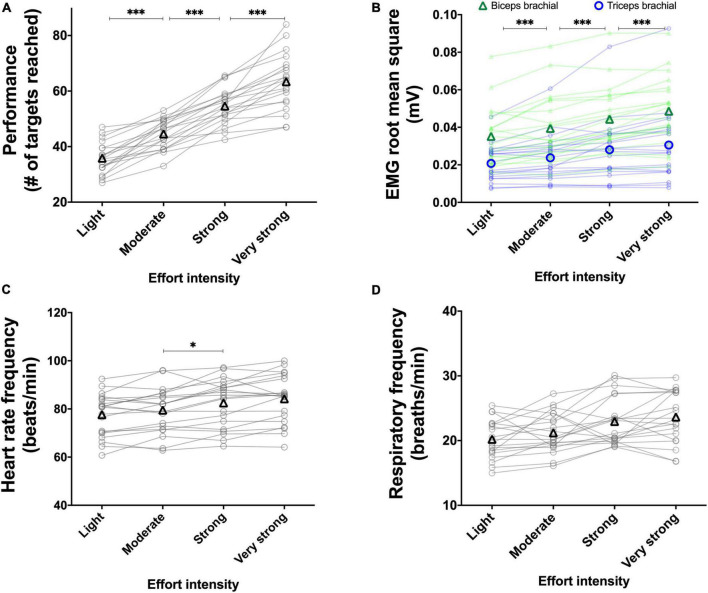
Results: In experiment 1, increasing the PE intensity to prescribe exercise induced an increased performance between each intensity. Increasing task difficulty with faster movement tempo and adding weight on the forearm increased the rating of PE. Experiment 2 replicated the possibility to use PE intensity for exercise prescription during the BBT. When completing the BBT with an additional weight on the forearm, participants maintained performance at the cost of a higher PE. In both experiments, changes in PE were associated with changes in muscle activation.

Conclusion: Our results suggest that PE is a valid tool to prescribe and monitor exercise during upper-limb motor tasks.

Keywords: CR100 scale; box and block test; motor control; perceived exertion; pointing tasks; psychophysiology; upper-limb task.


Conflict of interest statement

The authors declare that the research was conducted in the absence of any commercial or financial relationships that could be construed as a potential conflict of interest.

Figures

FIGURE 1
FIGURE 1
(A) Illustration of the box and block test (Mathiowetz et al., 1985) used in experiments 1 and 2. Briefly, participants had to grasp one block at a time with the dominant hand, transport the block over the partition, and release it into the opposite compartment. (B) Illustration of the pointing task used in experiment 1. Starting from target 1, participants had to go back and forth between each target. Right-handed participants started by reaching target 2 for their first-round trip, while left-handed participants started by reaching target 5 for their first-round trip. Measures are being taken from the center of all squares (1 × 1 cm). The distance between each upper square is 5.1 cm. The distance between targets 1–2 and 1–5 is 22.3 cm, respectively. The distance between targets 1–3 and 1–4 is 21 cm, respectively.
FIGURE 2
FIGURE 2
(A) Experiments 1A and 2A overview: The procedures used to test the possibility to prescribe exercise using the perception of effort. The exercise was prescribed at four intensities of perceived effort via the CR100 scale: light (13/100), moderate (23/100), strong (50/100), and very strong (70/100). While both the pointing task (PT) and the box and block test (BBT) were performed in experiment 1A, only the BBT was performed in experiment 2A. (B) Experiment 1B overview. Set up consisted of the placement of the respiratory frequency belt, heart rate monitor, and EMG surface electrodes. Then, participants completed the indicated questionnaire or visual analog scale (VAS). Participants performed two repetitions per level of difficulty with 30 s of recovery in between. Rating of perceived effort (RPE) and subjective workload using NASA TLX scale were assessed in-between each level of difficulty. (C) Experiment 2B overview. Participants performed the box and block test for 60 with the absence (0 kg) or presence (0.5 kg) of additional weights. Set up consisted of the placement of the heart rate monitor and the EMG surface electrodes. Then, participants completed the indicated questionnaire or scale.
FIGURE 3
FIGURE 3
Experiment 1A: Using the perception of effort to prescribe the exercise during the box and block test. Effect of increasing the prescribed effort intensity on performance (A, n = 20), EMG root mean square of the biceps (green line) and triceps (blue line) brachial muscles (B, n = 19), heart rate frequency (C, n = 18), and respiratory frequency (D, n = 20) during the box and block test. The exercise was prescribed at four intensities of perceived effort via the CR100 scale: light (13/100), moderate (23/100), strong (50/100), and very strong (70/100). Data are presented as the main effect of effort intensity (A, C, D) and effort intensity × muscle interaction (B). The n indicates the number of participants with all the data in each four effort intensities. Changes in the n reflect data loss due to the issue with equipment or movement artifact. Individual data are presented in light markers and means in dark markers. *Main effect of intensity, the difference between two effort intensities. *p < 0.05, **p < 0.01, and ***p < 0.001.
FIGURE 4
FIGURE 4
Experiment 1A: Using the perception of effort to prescribe the exercise during the pointing task. Effect of increasing the prescribed effort intensity on performance (A, n = 20), EMG root mean square of the biceps (green line) and triceps (blue line) brachial muscles (B, n = 20), heart rate frequency (C, n = 20), and respiratory frequency (D, n = 20) during the pointing task. The exercise was prescribed at four intensities of perceived effort via the CR100 scale: light (13/100), moderate (23/100), strong (50/100), and very strong (70/100). Data are presented as the main effect of effort intensity (A, C, D) and effort intensity × muscle interaction (B). Individual data are presented in light markers and means in dark markers. *Main effect of intensity, the difference between two effort intensities. *p < 0.05, ***p < 0.001.
FIGURE 5
FIGURE 5
Experiment 1B: Manipulating the tempo to alter task difficulty during the box and block test. Effect of manipulating the tempo during the box and block test on performance (A, n = 20), rating of perceived effort (B, n = 20), EMG root mean square of the biceps (green line) and triceps (blue line) brachial muscles (C, n = 20), heart rate frequency (D, n = 18), respiratory frequency (E, n = 20) and NASA TLX scores for physical demand (F, n = 20), temporal demand (G, n = 20), and subjective effort (H, n = 20). For the low difficulty, a 0.5 Hz tempo was imposed. For moderate difficulty, a 0.75 Hz tempo was imposed. For the high difficulty, a 1 Hz tempo was imposed. Data are presented as the main effect of difficulty, except for panel (C) presenting the difficulty × muscle interaction. The n indicates the number of participants with all the data in each of the three levels of difficulties. Changes in the n reflect data loss due to issues with equipment or movement artifact. Individual data are presented in light markers and means in dark markers. *Main effect of difficulty, the difference between two difficulty levels. *p < 0.05, **p < 0.01, and ***p < 0.001.
FIGURE 6
FIGURE 6
Experiment 1B: Manipulating the tempo to alter task difficulty during the pointing task. Effect of manipulating the tempo during the pointing task on performance (A, n = 20), rating of perceived effort (B, n = 20), EMG root mean square of the biceps (green line) and triceps (blue line) brachial muscles (C, n = 20), heart rate frequency (D, n = 18), respiratory frequency (E, n = 20) and NASA TLX scores for physical demand (F, n = 20), temporal demand (G, n = 20) and subjective effort (H, n = 20). For the low difficulty, a 1 Hz tempo was imposed. For the moderate difficulty, a 1.5 Hz tempo was imposed. For the high difficulty, a 2 Hz tempo was imposed. Data are presented as the main effect of difficulty, except for panel C presenting the difficulty × muscle interaction. The n indicates the number of participants with all the data in each of the three levels of difficulties. Changes in the n reflect data loss due to issues with equipment or movement artifact. Individual data are presented in light markers and means in dark markers. *Main effect of difficulty, the difference between two difficulty levels. b and t difference between two difficulty levels for the biceps and triceps brachial muscles, respectively. One symbol: p < 0.05, two symbols: p < 0.01, and three symbols: p < 0.001.
FIGURE 7
FIGURE 7
Experiment 1B: Adding weight on the forearm to alter task difficulty during the box and block test. The effect of manipulating the weight during the box and block test on performance (A, n = 20), rating of perceived effort (B, n = 20), EMG root mean square of the biceps (green line) and triceps (blue line) brachial muscles (C, n = 20), heart rate frequency (D, n = 16), respiratory frequency (E, n = 20) and NASA TLX scores for the physical demand (F, n = 20), the temporal demand (G, n = 20), and the subjective effort (H, n = 20). Movements were performed at a fixed tempo of 0.75 Hz. For the low difficulty, no additional weight on the forearm was added. For the moderate difficulty, a weight of 0.5 kg was added. For the high difficulty, a weight of 1 kg was added. Data are presented as the main effect of difficulty, except for panel (C) presenting the difficulty × muscle interaction. The n indicates the number of participants with all the data in each of the three levels of difficulties. Changes in the n reflect data loss due to issues with equipment or movement artifact. Individual data are presented in light markers and means in dark markers. *Main effect of difficulty, the difference between two difficulty levels. b and t difference between two difficulty levels for the biceps and triceps brachial muscles, respectively. One symbol: p < 0.05, two symbols: p < 0.01, and three symbols: p < 0.001.
FIGURE 8
FIGURE 8
Experiment 1B: Adding weight on the forearm to alter task difficulty during the pointing task. Effect of manipulating the weight during the pointing Task on performance (A, n = 20), rating of perceived effort (B, n = 20), EMG root mean square of the biceps (green line) and triceps (blue line) brachial muscles (C, n = 20), heart rate frequency (D, n = 17), respiratory frequency (E, n = 20) and NASA TLX scores for the physical demand (F, n = 20), the temporal demand (G, n = 20) and the subjective effort (H, n = 20). Movements were performed at a fixed tempo of 1.5 Hz. For the low difficulty, no additional weight on the forearm was added. For the moderate difficulty, a weight of 0.5 kg was added. For the high difficulty, a weight of 1 kg was added. Data are presented as the main effect of difficulty, except for panel (C) presenting the difficulty × muscle interaction. The n indicates the number of participants with all the data in each of the three levels of difficulties. Changes in the n reflect data loss due to the equipment. Individual data are presented in gray circles and means in black triangles. *Main effect of difficulty, the difference between two difficulty levels. b and t difference between two difficulty levels for the biceps and triceps brachial muscles, respectively. One symbol: p < 0.05, two symbols: p < 0.01, and three symbols: p < 0.001.
FIGURE 9
FIGURE 9
Experiment 2A: Using the perception of effort to prescribe the exercise during the box and block test. Effect of increasing the prescribed intensity of effort on performance (A, n = 20), EMG root mean square of the biceps (green line) and triceps (blue line) brachial muscles (B, n = 20), heart rate frequency (C, n = 20) during the box and block test. The exercise was prescribed at four intensities of perceived effort via the CR100 scale: light (13/100), moderate (23/100), strong (50/100), and very strong (70/100). Data are presented as the main effect of effort intensity, except for panel (B) presenting the effort intensity × muscle interaction. Individual data are presented in light markers and means in dark markers. *Main effect of difficulty, the difference between two difficulty levels. b and t are the difference between two difficulty levels for the biceps and triceps brachial muscles, respectively. One symbol: p < 0.05, two symbols: p < 0.01, and three symbols: p < 0.001.
FIGURE 10
FIGURE 10
Experiment 2B: Adding weight on the forearm to alter task difficulty during the box and block test with its validated instructions. Effect of weight manipulation on performance (A, n = 20), rating of perceived effort (B, n = 20), EMG root mean square of the biceps (green line) and triceps (blue line), brachial muscles (C, n = 20), heart rate frequency (D, n = 20), and NASA TLX scores for physical demand (E, n = 20) and effort (F, n = 20) during the box and block test with its official instructions. Data are presented as the main effect of difficulty, except for panel (C) presenting the effort difficulty × muscle interaction. Individual data are presented in light markers and means in dark markers. *Main effect of difficulty, the difference between two difficulty levels. b is the difference between two difficulty levels for the biceps and triceps brachial muscles, respectively. One symbol: p < 0.05 and two symbols: p < 0.01.

Similar articles

Cited by

References

    1. Amann M., Light A. R. (2014). Reply: To PMID 24142455. Exp. Physiol. 99 836–836. 10.1113/expphysiol.2014.078832 - DOI - PMC - PubMed
    1. Au J. S., Totosy D. E. Z. J. O., Macdonald M. J. (2017). Modeling perceived exertion during graded arm cycling exercise in spinal cord injury. Med. Sci. Sports Exerc. 49 1190–1196. 10.1249/MSS.0000000000001203 - DOI - PubMed
    1. Azevedo A. D., Matos L. F. D., Nakamura F. Y., Pereira G. (2016). Perception of effort monitors internal load during compounded circuit training. Motriz 22 90–93.
    1. Backman C., Gibson S. C. D., Parsons J. (1992). Assessment of hand function: The relationship between pegboard dexterity and applied dexterity. Can. J. Occup. Ther. 59 208–213. 10.1177/000841749205900406 - DOI
    1. Barhorst E. E., Andrae W. E., Rayne T. J., Falvo M. J., Cook D. B., Lindheimer J. B. (2020). Elevated perceived exertion in people with myalgic encephalomyelitis/chronic fatigue syndrome and fibromyalgia: A meta-analysis. Med. Sci. Sports Exerc. 52 2615–2627. 10.1249/MSS.0000000000002421 - DOI - PMC - PubMed

LinkOut - more resources