

Exploitation of a shared genetic signature between obesity and endometrioid endometrial cancer
- PMID: 36761027
- PMCID: PMC9902493
- DOI: 10.3389/fsurg.2023.1097642
Exploitation of a shared genetic signature between obesity and endometrioid endometrial cancer
Abstract
Aims: The findings in epidemiological studies suggest that endometrioid endometrial cancer (EEC) is associated with obesity. However, evidence from gene expression data for the relationship between the two is still lacking. The purpose of this study was to explore the merits of establishing an obesity-related genes (ORGs) signature in the treatment and the prognostic assessment of EEC.
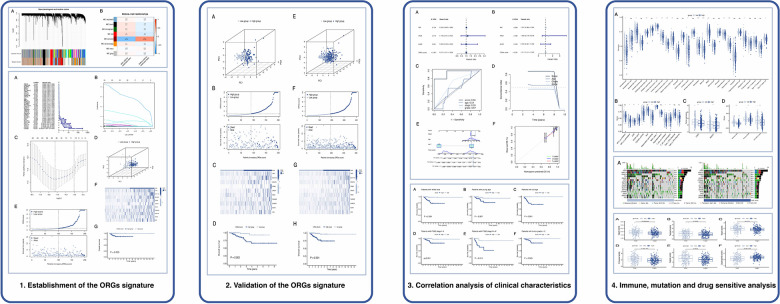
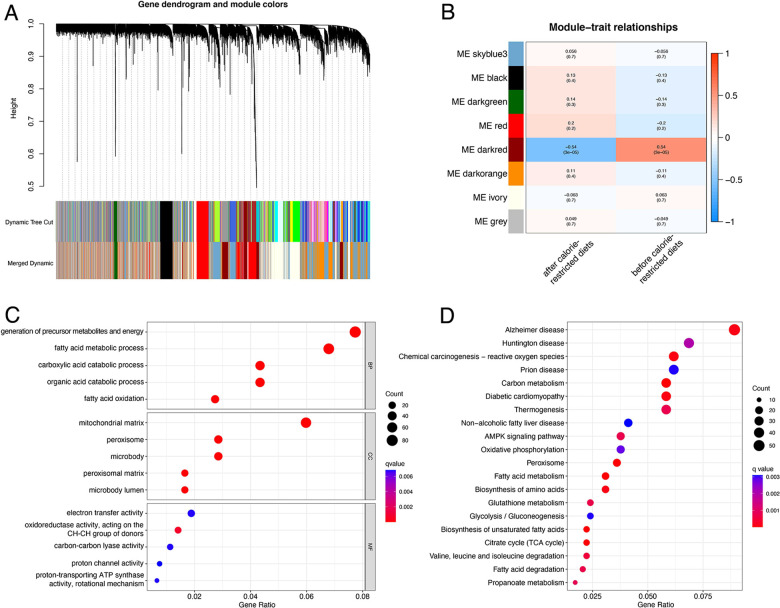
Methods: Microarray data from GSE112307 were utilized to identify ORGs by using weighted gene co-expression network analysis. Based on the sequencing data from TCGA, we established the prognostic ORGs signature, confirmed its value as an independent risk factor, and constructed a nomogram. We further investigated the association between grouping based on ORGs signature and clinicopathological characteristics, immune infiltration, tumor mutation burden and drug sensitivity.
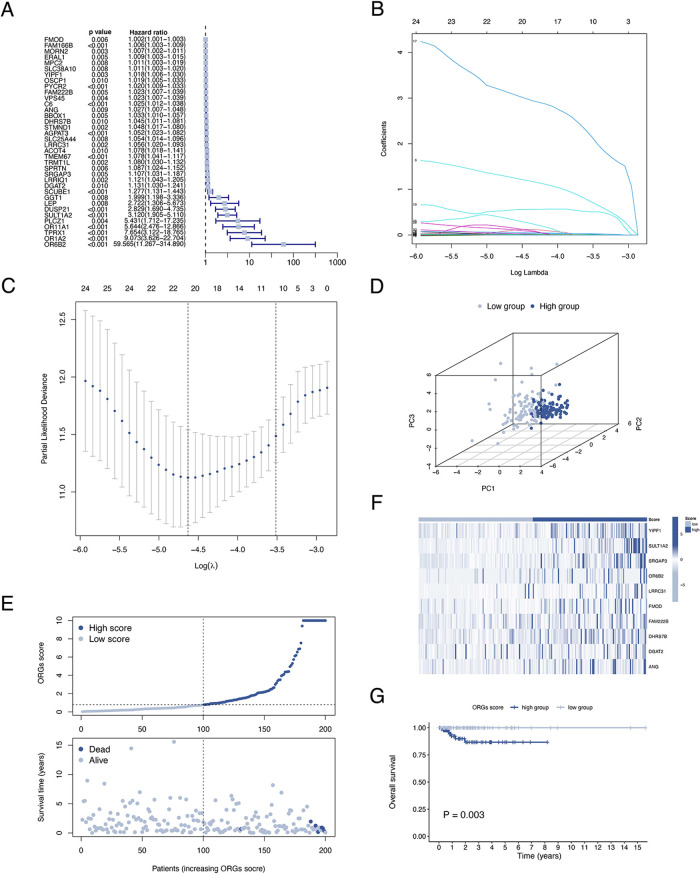
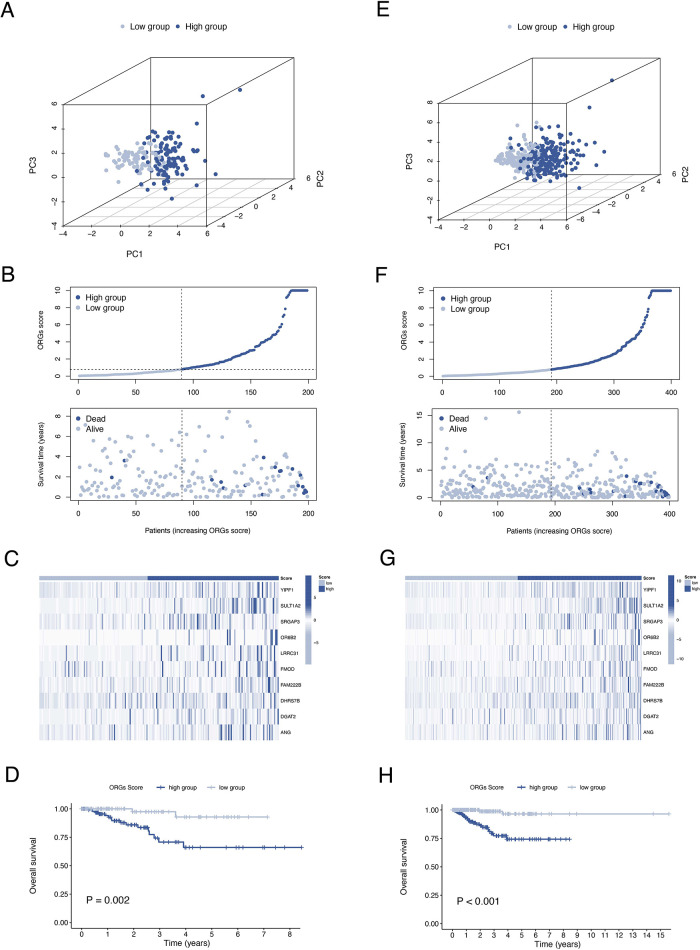
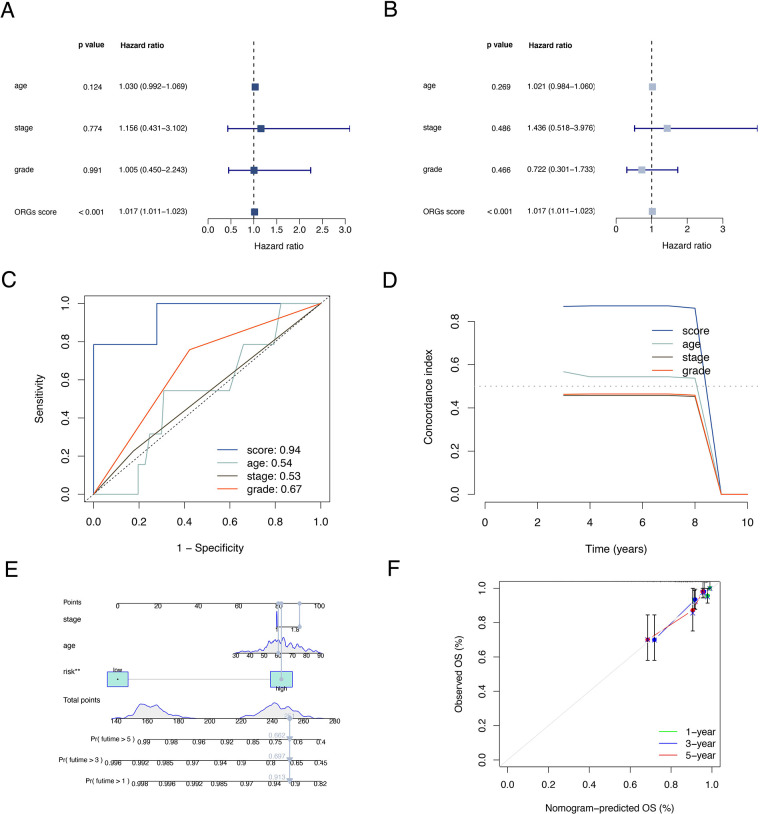
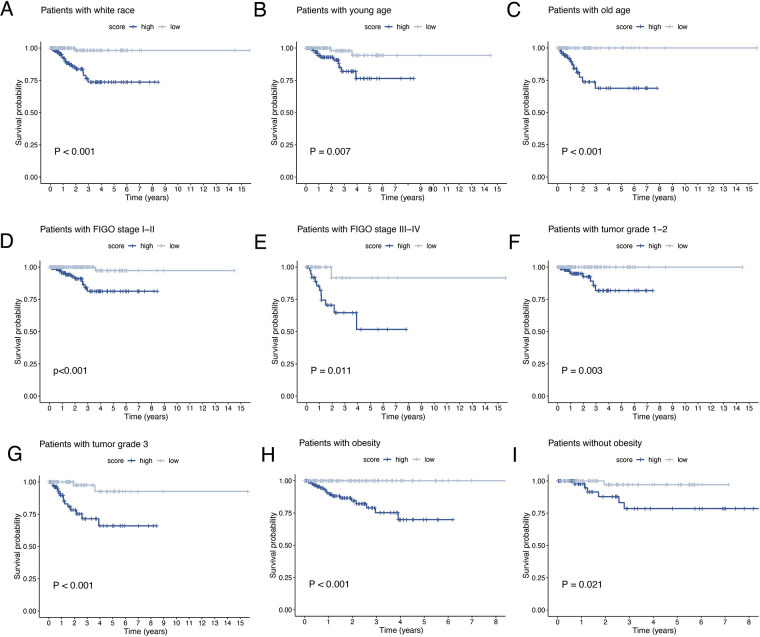
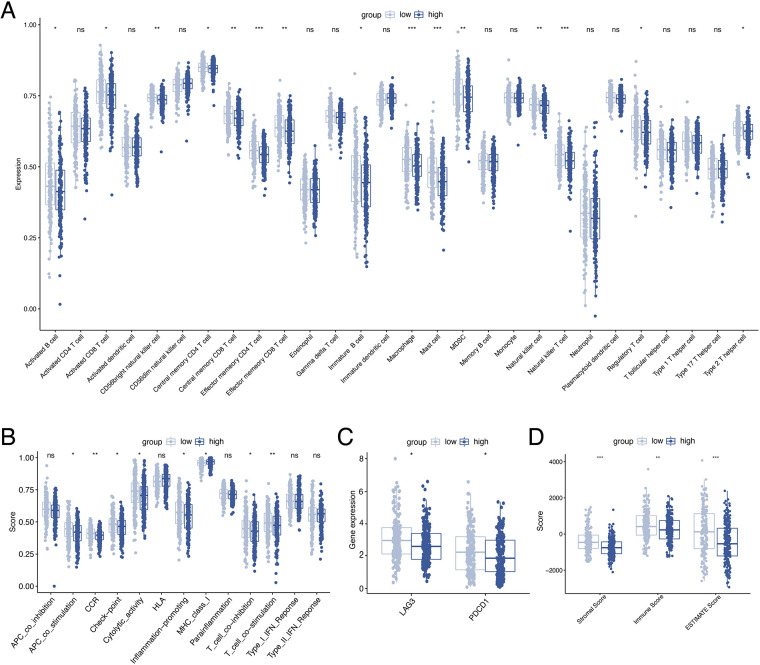
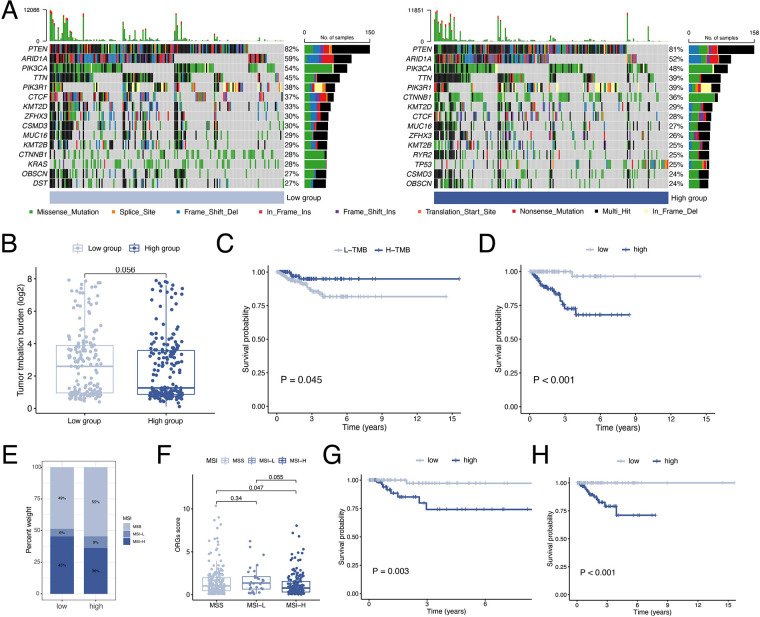
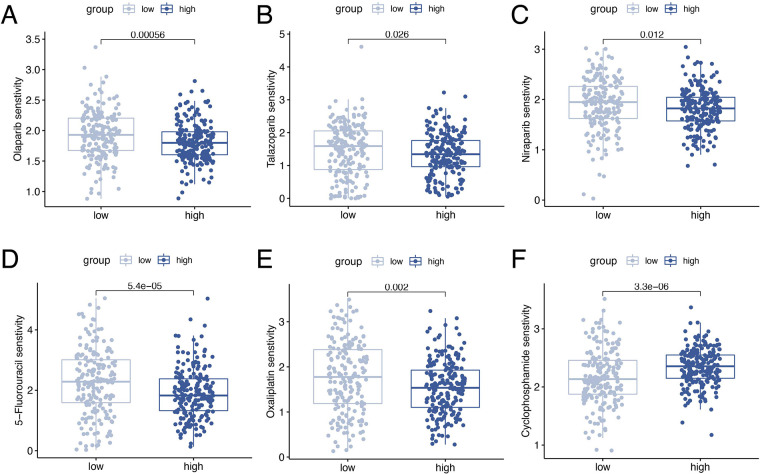
Results: A total of 10 ORGs were identified as key genes for the construction of the signature. According to the ORGs score computed from the signature, EEC patients were divided into high and low-scoring groups. Overall survival (OS) was shorter in EEC patients in the high-scoring group compared with the low-scoring group (P < 0.001). The results of the Cox regression analysis showed that ORGs score was an independent risk factor for OS in EEC patients (HR = 1.017, 95% confidence interval = 1.011-1.023; P < 0.001). We further revealed significant disparities between scoring groups in terms of clinical characteristics, tumor immune cell infiltration, and tumor mutation burden. Patients in the low-scoring group may be potential beneficiaries of immunotherapy and targeted therapies.
Conclusions: The ORGs signature established in this study has promising prognostic predictive power and may be a useful tool for the selection of EEC patients who benefit from immunotherapy and targeted therapies.
Keywords: endometrioid endometrial cancer; immune correlation analyses; obesity-related genes; targeted treatment; weighted gene coexpression network analysis.
© 2023 Duan, Yi and Wang.
Conflict of interest statement
The authors declare that the research was conducted in the absence of any commercial or financial relationships that could be construed as a potential conflict of interest.
Figures
Similar articles
-
Shared sex hormone metabolism-related gene prognostic index between breast and endometrial cancers.Front Endocrinol (Lausanne). 2023 Jan 20;14:1126862. doi: 10.3389/fendo.2023.1126862. eCollection 2023. Front Endocrinol (Lausanne). 2023. PMID: 36742386 Free PMC article.
-
Identification and validation of obesity related genes signature based on microenvironment phenotypes in prostate adenocarcinoma.Aging (Albany NY). 2023 Oct 2;15(19):10168-10192. doi: 10.18632/aging.205065. Epub 2023 Oct 2. Aging (Albany NY). 2023. PMID: 37788005 Free PMC article.
-
A long noncoding RNAs signature to improve survival prediction in endometrioid endometrial cancer.J Cell Biochem. 2019 May;120(5):8300-8310. doi: 10.1002/jcb.28113. Epub 2018 Dec 11. J Cell Biochem. 2019. PMID: 30548294
-
Comprehensive FGFR3 alteration-related transcriptomic characterization is involved in immune infiltration and correlated with prognosis and immunotherapy response of bladder cancer.Front Immunol. 2022 Jul 26;13:931906. doi: 10.3389/fimmu.2022.931906. eCollection 2022. Front Immunol. 2022. PMID: 35958598 Free PMC article.
-
TCGA molecular subgroups of endometrial carcinoma in ovarian endometrioid carcinoma: A quantitative systematic review.Gynecol Oncol. 2021 Nov;163(2):427-432. doi: 10.1016/j.ygyno.2021.08.011. Epub 2021 Aug 24. Gynecol Oncol. 2021. PMID: 34446267
Cited by
-
Machine learning based obesity and aging related signature for predicting the prognosis and immunotherapy benefit in stomach adenocarcinoma.Discov Oncol. 2025 Jul 1;16(1):1211. doi: 10.1007/s12672-025-03054-5. Discov Oncol. 2025. PMID: 40591158 Free PMC article.
References
LinkOut - more resources
Full Text Sources