

Systematic assessment of streptozotocin-induced diabetic metabolic alterations in rats using metabolomics
- PMID: 36761194
- PMCID: PMC9902650
- DOI: 10.3389/fendo.2023.1107162
Systematic assessment of streptozotocin-induced diabetic metabolic alterations in rats using metabolomics
Abstract
Purpose: Type 1 diabetes is characterized by elevated blood glucose levels, which negatively impacts multiple organs and tissues throughout the body, and its prevalence is on the rise. Prior reports primarily investigated the serum and urine specimen from diabetic patients. However, only a few studies examined the overall metabolic profile of diabetic animals or patients. The current systemic investigation will benefit the knowledge of STZ-based type 1 diabetes pathogenesis.
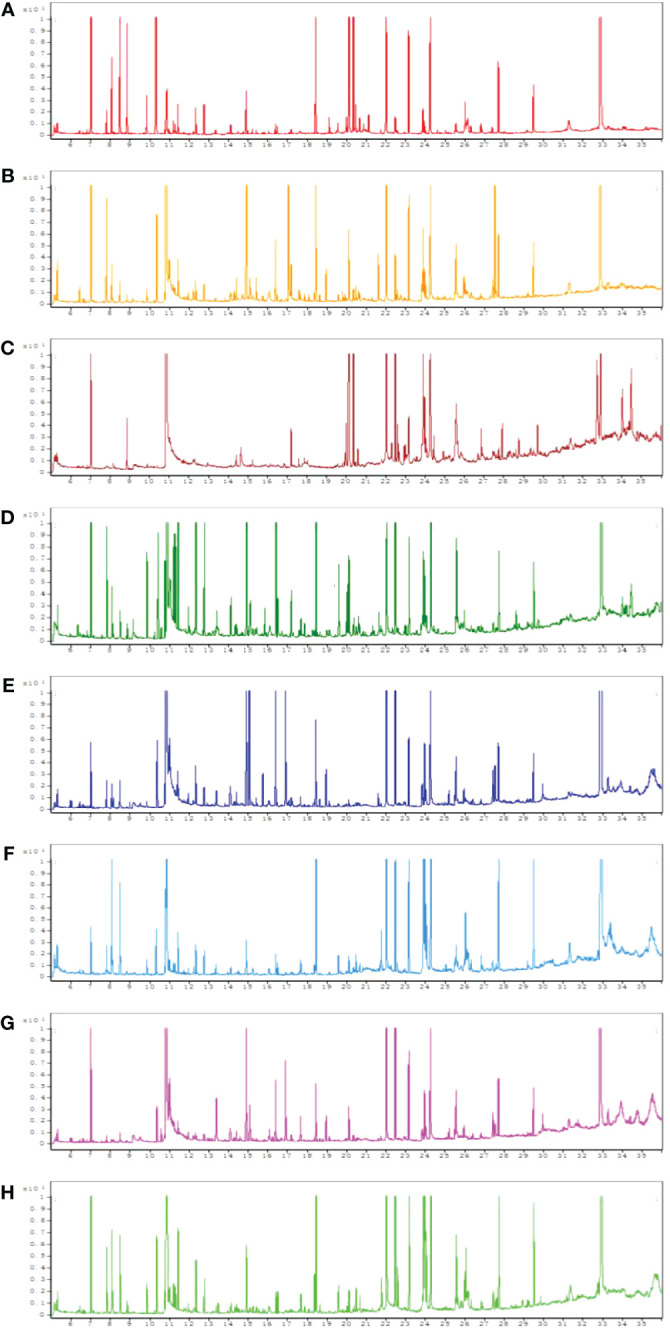
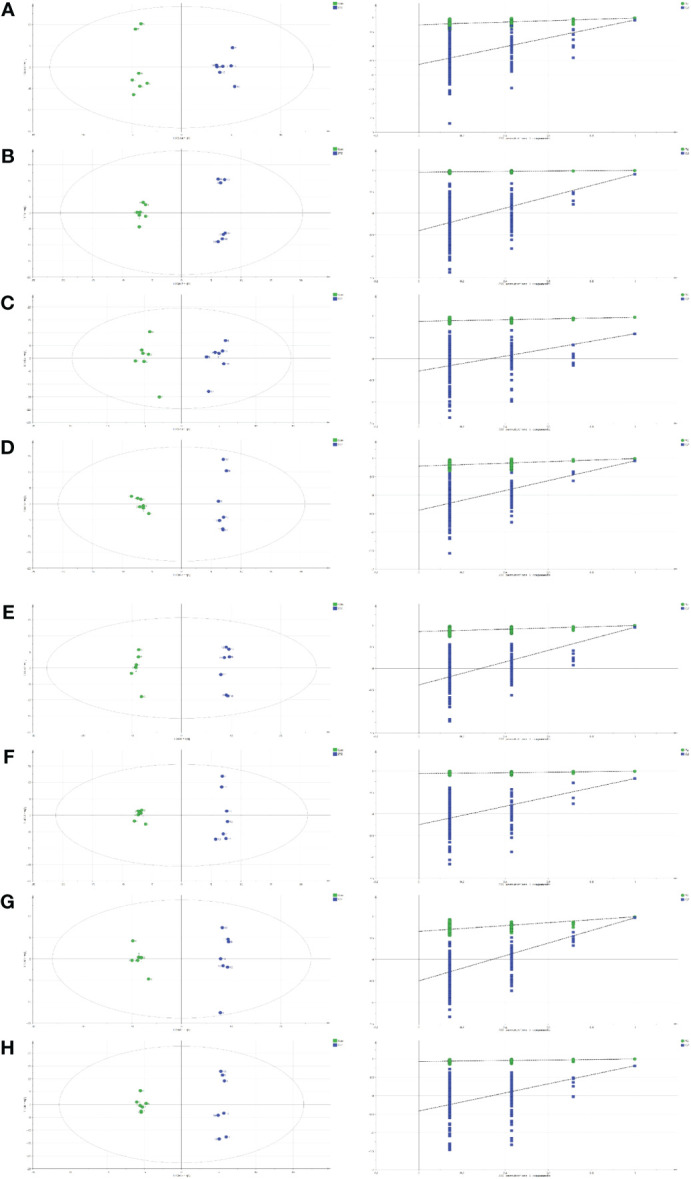
Methods: Male SD rats were arbitrarily separated into control and streptozotocin (STZ)-treated diabetic rats (n = 7). The experimental rats received 50mg/kg STZ intraperitoneal injection daily for 2 consecutive days. Following 6 weeks, metabolites were assessed via gas chromatography-mass spectrometry (GC-MS), and multivariate analysis was employed to screen for differentially expressed (DE) metabolites between the induced diabetic and normal rats.
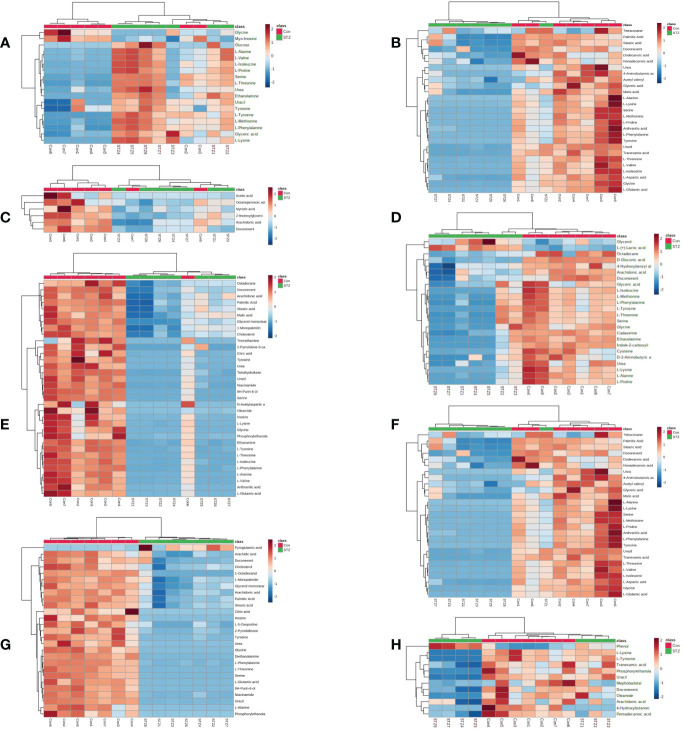
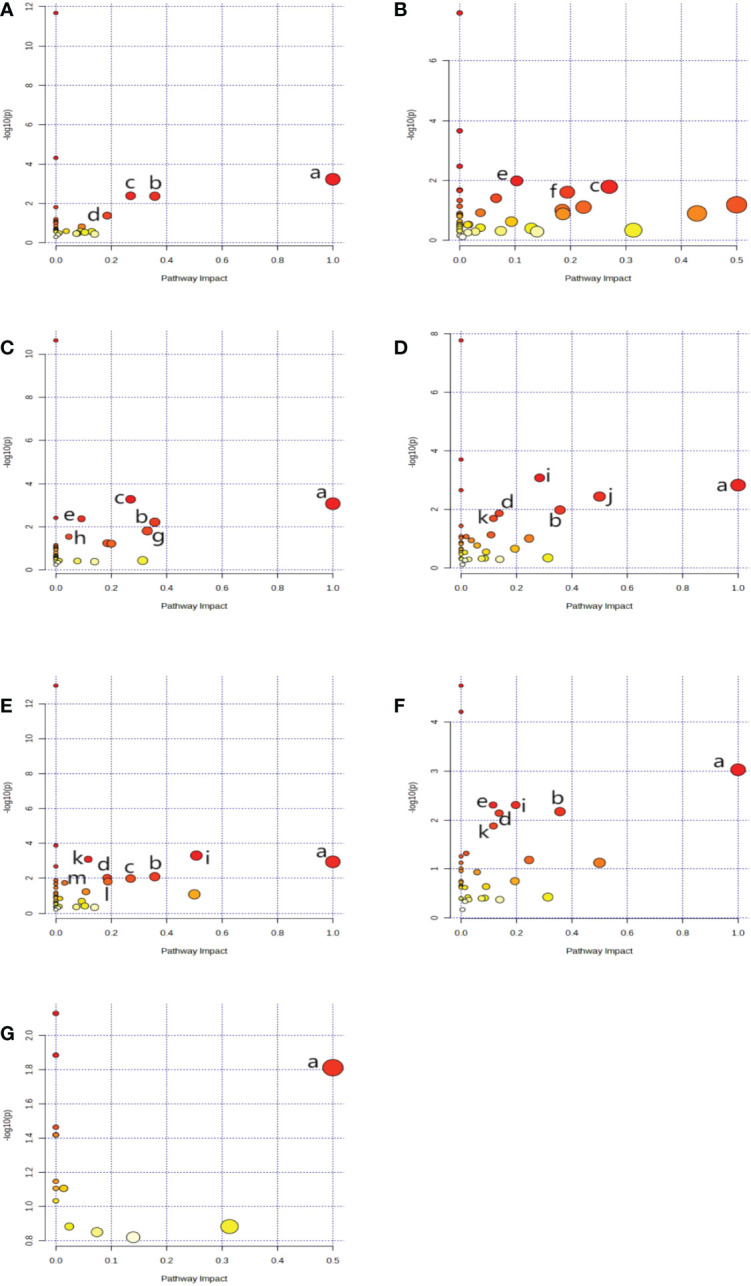
Results: We identified 18, 30, 6, 24, 34, 27, 27 and 12 DE metabolites in the serum, heart, liver, kidney, cortex, renal lipid, hippocampus, and brown fat tissues of STZ-treated diabetic rats, compared to control rats. Based on our analysis, the largest differences were observed in the amino acids (AAs), B-group vitamin, and purine profiles. Using the metabolic pathway analysis, we screened 13 metabolic pathways related to the STZ-exposed diabetes pathogenesis. These pathways were primarily AA metabolism, followed by organic acids, sugars, and lipid metabolism.
Conclusion: Based on our GC-MS analysis, we identified potential metabolic alterations within the STZ-exposed diabetic rats, which may aid in the understanding of diabetes pathogenesis.
Keywords: diabetes; gas chromatography mass spectrometry (GC-MS); metabolites; metabolomics; streptozotocin (STZ).
Copyright © 2023 Si, Guo, Yang, Guo, Wu, Xie and Jiang.
Conflict of interest statement
The authors declare that the research was conducted in the absence of any commercial or financial relationships that could be construed as a potential conflict of interest.
Figures
Similar articles
-
Revealing metabolic and biochemical variations via 1H NMR metabolomics in streptozotocin-nicotinamide-induced diabetic rats treated with metformin.Biochem Biophys Res Commun. 2024 May 14;708:149778. doi: 10.1016/j.bbrc.2024.149778. Epub 2024 Mar 16. Biochem Biophys Res Commun. 2024. PMID: 38507867
-
UHPLC-MS-Based Serum and Urine Metabolomics Reveals the Anti-Diabetic Mechanism of Ginsenoside Re in Type 2 Diabetic Rats.Molecules. 2021 Nov 3;26(21):6657. doi: 10.3390/molecules26216657. Molecules. 2021. PMID: 34771066 Free PMC article.
-
Metabolomic analysis and biochemical changes in the urine and serum of streptozotocin-induced normal- and obese-diabetic rats.J Physiol Biochem. 2018 Aug;74(3):403-416. doi: 10.1007/s13105-018-0631-3. Epub 2018 May 15. J Physiol Biochem. 2018. PMID: 29766441
-
Metabolomic signature of type 1 diabetes-induced sensory loss and nerve damage in diabetic neuropathy.J Mol Med (Berl). 2019 Jun;97(6):845-854. doi: 10.1007/s00109-019-01781-1. Epub 2019 Apr 4. J Mol Med (Berl). 2019. PMID: 30949723
-
LC-MS-Based Untargeted Metabolomics Reveals Early Biomarkers in STZ-Induced Diabetic Rats With Cognitive Impairment.Front Endocrinol (Lausanne). 2021 Jun 30;12:665309. doi: 10.3389/fendo.2021.665309. eCollection 2021. Front Endocrinol (Lausanne). 2021. PMID: 34276557 Free PMC article.
References
Publication types
MeSH terms
Substances
LinkOut - more resources
Full Text Sources
Medical
Miscellaneous