. 2023 Jan 25:16:950489.
doi: 10.3389/fncom.2022.950489. eCollection 2022.

Degeneracy and stability in neural circuits of dopamine and serotonin neuromodulators: A theoretical consideration

Affiliations

Degeneracy and stability in neural circuits of dopamine and serotonin neuromodulators: A theoretical consideration

Chandan K Behera et al. Front Comput Neurosci. .

Abstract

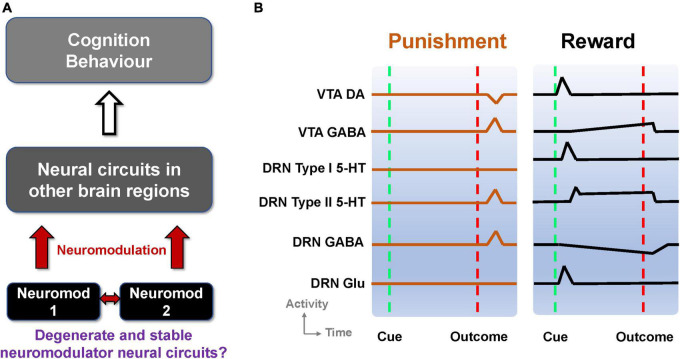
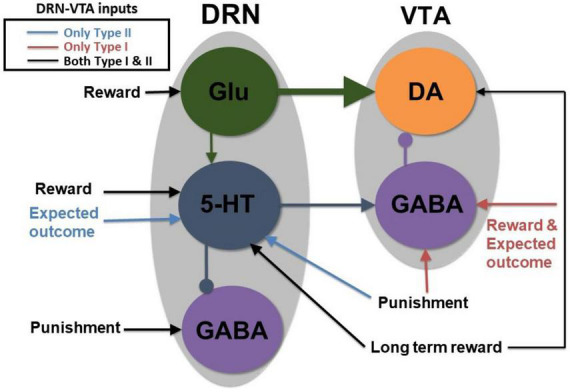
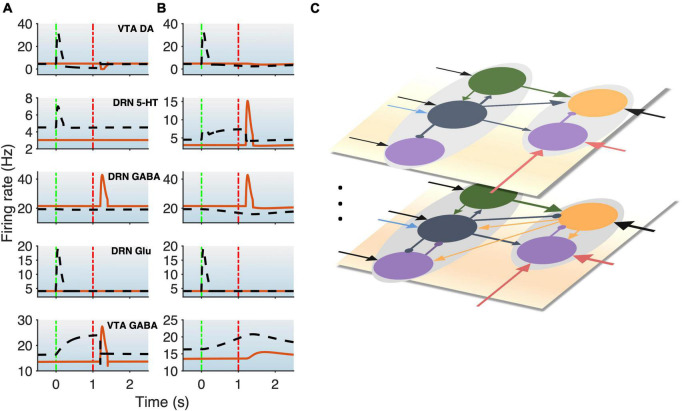
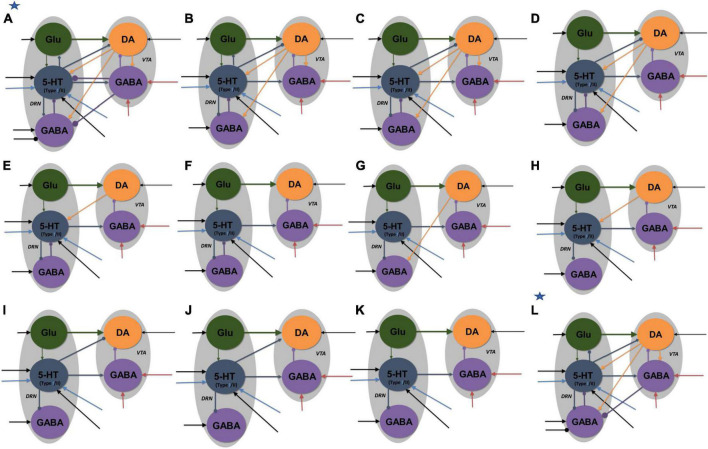
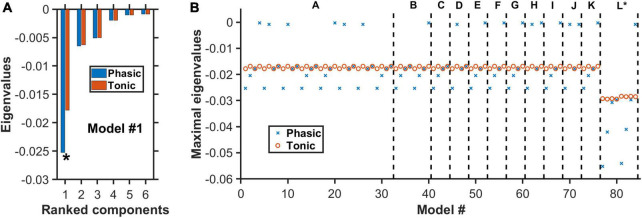
Degenerate neural circuits perform the same function despite being structurally different. However, it is unclear whether neural circuits with interacting neuromodulator sources can themselves degenerate while maintaining the same neuromodulatory function. Here, we address this by computationally modeling the neural circuits of neuromodulators serotonin and dopamine, local glutamatergic and GABAergic interneurons, and their possible interactions, under reward/punishment-based conditioning tasks. The neural modeling is constrained by relevant experimental studies of the VTA or DRN system using, e.g., electrophysiology, optogenetics, and voltammetry. We first show that a single parsimonious, sparsely connected neural circuit model can recapitulate several separate experimental findings that indicated diverse, heterogeneous, distributed, and mixed DRNVTA neuronal signaling in reward and punishment tasks. The inability of this model to recapitulate all observed neuronal signaling suggests potentially multiple circuits acting in parallel. Then using computational simulations and dynamical systems analysis, we demonstrate that several different stable circuit architectures can produce the same observed network activity profile, hence demonstrating degeneracy. Due to the extensive D2-mediated connections in the investigated circuits, we simulate the D2 receptor agonist by increasing the connection strengths emanating from the VTA DA neurons. We found that the simulated D2 agonist can distinguish among sub-groups of the degenerate neural circuits based on substantial deviations in specific neural populations' activities in reward and punishment conditions. This forms a testable model prediction using pharmacological means. Overall, this theoretical work suggests the plausibility of degeneracy within neuromodulator circuitry and has important implications for the stable and robust maintenance of neuromodulatory functions.

Keywords: computational modeling; degeneracy; dopamine; reward and punishment; serotonin.


Conflict of interest statement

The authors declare that the research was conducted in the absence of any commercial or financial relationships that could be construed as a potential conflict of interest.

Figures

FIGURE 1
FIGURE 1
Degenerate neuromodulator circuits are constrained by observed neuronal signaling. (A) Multiple neuromodulators that influence neural circuits, cognition, and behavior, may be embedded within degenerate neural circuits. Neuromod: Specific neuromodulator type. (B) Schematic of DRN and VTA activity profiles in reward and punishment tasks. Activities (firing rates) aligned to the timing of unexpected punishment outcome (left, vertical red dashed lines) and learned reward-predictive cue (right, vertical green dashed lines) and reward outcome (right, vertical red dashed lines). Top-to-bottom: VTA DA neural activity exhibits phasic excitation (inhibition) at reward-predictive cue (punishment) outcome (e.g., Cohen and Uchida, 2012; Tan et al., 2012). VTA GABAergic neural activity shows phasic excitation upon punishment (e.g., Tan et al., 2012; Eshel et al., 2015) while exhibiting post-cue tonic activity which is not modulated by the presence/absence of actual outcome (e.g., Cohen and Uchida, 2012). DRN Type-I 5-HT neurons show phasic activation by a reward-predicting cue (right) but not punishment (left). DRN Type-II 5-HT neurons signal punishment outcome (left) and sustained activity toward expected reward outcome (right) (e.g., Cohen et al., 2015). DRN GABAergic neurons have phasic activation upon punishment but have tonic inhibition during waiting and reward delivery (e.g., Li et al., 2016). DRN glutamatergic neurons were deduced to be excited by reward-predicting cues, in line with VTA DA neural activation (McDevitt et al., 2014), and assumed not to respond to punishment outcome. Baseline activity for Type-I 5-HT DRN neurons is higher in reward than punishment tasks (e.g., Cohen et al., 2015).
FIGURE 2
FIGURE 2
A parsimonious, sparsely connected DRN-VTA circuit model. Gray: Brain region. Colored circle: Neuronal population. Legend: network’s afferent inputs. Model architecture implicitly encompasses either Type I or II 5-HT neurons with two different inputs for reward/punishment task (bright red arrows if Type I; blue arrows if Type II; black arrows denote common inputs for reward/punishment task for both Types). Circuit connections: triangular-end arrows (excitatory); circle-end arrows (inhibitory). Thicker arrows: Stronger connection weights. Constant long-term reward inputs simultaneously to 5-HT and DA neurons to alter baseline activities. Sustained activity for the expectation of reward outcome implemented with tonic input between cue and reward outcome. All other inputs are brief, at cue or reward/punishment outcome, producing phasic excitations/inhibitions. Note: Self-inhibitory (self-excitatory) connections within GABAergic (Glu) neurons, and auto-receptor inhibitions within 5-HT or DA neurons were implemented but not shown here (see section “2. Materials and methods” and Supplementary Figure 1). This is the most basic, sparsely connected model architecture considered.
FIGURE 3
FIGURE 3
DRN-VTA model replicates signaling patterns and suggests multiple parallel circuits. (A,B) Model with reward (black dashed lines) and punishment (orange bold lines) tasks with 5-HT neurons that are of Type I (A) or Type II (B). This will be used as a standard activity profile template to test for degeneracy. Time label from cue onset. Green (red) vertical dashed-dotted lines: Cue (outcome) onset time (as in Figure 1B). Top-to-bottom: VTA DA, DRN 5-HT, DRN GABAergic, DRN Glu, and VTA GABAergic neural populations. (C) Hypothesis for multiple different DRN-VTA circuits operating in parallel, which may consist of different clusters of neuronal sub-populations and different sets of afferent inputs, leading to different outputs. Vertical dots denote the potential of having more than two distinctive circuits.
FIGURE 4
FIGURE 4
Neural circuit model architectures with similar network activity profiles. The activity profiles were similar to that in Figures 2A, B, satisfying the inclusion criterion. Model architectures (A–K) denote architectures of decreasing connectivity, with Figure 2 as architecture (K). Model architecture (L) has an asterisk to denote that it was the only model with fast 5-HT to VTA DA connection, simulating fast 5-HT3 or Glu receptor-mediated connection or their combination (co-transmission). Architectures (A,L) have additional inhibitory input to DRN GABA neurons in reward tasks. All labels, connections, and nomenclature have the same meaning as that in Figure 3, except that, for simplicity, the relative connection weights (thickness) are not illustrated, and the diamond-end arrows denote connections that are either excitatory or inhibitory, with both explored. Self-connectivity is not illustrated [see the general example in Supplementary Figure 1 for a detailed version of model architecture (A)]. Each architecture consists of several distinct model types (with a total of 84 types) with different 5-HT neuronal or excitatory/inhibitory connectivity types (see Supplementary Tables 2–4 and Supplementary Figure 5).
FIGURE 5
FIGURE 5
Negative real eigenvalues at steady states of degenerate models. (A) Complete set of the real part of the eigenvalues for model #1 (Supplementary Tables 2–4) with architecture “A” in Figure 4. Horizontal axis: Eigenvalues ranked from the largest to the smallest (magnitude wise). Blue (red): More negative eigenvalues with phasic (blue) than tonic (red) input. Asterisk: Maximal eigenvalue (largest magnitude) for each condition. (B) For each of the 84 models, only the real part of the eigenvalue with the largest magnitude is plotted under phasic (blue cross) and tonic (red circle) input conditions. Model architectures “A” to “L” refer to the different architectures as in Figure 4, in which each has its own distinctive model types (e.g., different 5-HT neuronal or excitatory/inhibitory connectivity types). Eigenvalues for all model types have negative real parts, indicating dynamically stable. For most models, the eigenvalues are generally more negative during phasic than tonic activities.
FIGURE 6
FIGURE 6
D2 receptor agonists can distinguish subsets of DRN-VTA neural circuits. Simulated drug administered during punishment and reward tasks with efficacy factor X increments of 1, 10, 40, 70, and 100 times. Baseline condition: X = 1. Colors other than black in the pie chart denote that at least one neural population activity in specific model architecture(s) (labeled in yellow, and as in Figure 4) has deviated (increased or decreased) beyond the inclusion criterion. Specific colors denote changes in specific neural population activities (see Supplementary Tables 5–9 for details.).

Similar articles

References

    1. Adell A., Artigas F. (2004). The somatodendritic release of dopamine in the ventral tegmental area and its regulation by afferent transmitter systems. Neurosci. Biobehav. Rev. 28 415–431. 10.1016/j.neubiorev.2004.05.001 - DOI - PubMed
    1. Aman T. K., Shen R. Y., Haj-Dahmane S. (2007). D2-like dopamine receptors depolarize dorsal raphe serotonin neurons through the activation of nonselective cationic conductance. J. Pharmacol. Exp. Ther. 320 376–385. 10.1124/jpet.106.111690 - DOI - PubMed
    1. Beier K. T., Steinberg E. E., DeLoach K. E., Xie S., Miyamichi K., Schwarz L., et al. (2015). Circuit architecture of VTA dopamine neurons revealed by systematic input-output mapping. Cell 162 622–634. 10.1016/j.cell.2015.07.015 - DOI - PMC - PubMed
    1. Benoit-Marand M., Borrelli E., Gonon F. (2001). Inhibition of dopamine release via presynaptic D2 receptors: Time course and functional characteristics in vivo. J. Neurosci. 21 9134–9141. 10.1523/JNEUROSCI.21-23-09134.2001 - DOI - PMC - PubMed
    1. Boureau Y. L., Dayan P. (2010). Opponency revisited: Competition and cooperation between dopamine and serotonin. Neuropsychopharmacology 36 74–97. 10.1038/npp.2010.151 - DOI - PMC - PubMed

LinkOut - more resources