

Diagnostic accuracy of contrast-enhanced ultrasound synchronized with shear wave elastography in the differential diagnosis of benign and malignant breast lesions: a diagnostic test
- PMID: 36761482
- PMCID: PMC9906099
- DOI: 10.21037/gs-22-684
Diagnostic accuracy of contrast-enhanced ultrasound synchronized with shear wave elastography in the differential diagnosis of benign and malignant breast lesions: a diagnostic test
Abstract
Background: Breast cancer (BC) is one of the most common malignancies affecting women. Timely and accurate diagnosis is crucial for treatment and prognosis. Some studies have found that elastography combined with microperfusion characteristics, which are mostly described by contrast-enhanced ultrasound (CEUS), could help in the diagnosis of breast lesions. This study aimed to assess the diagnostic performance of CEUS synchronized with shear wave elastography (SWE) in discriminating between benign and malignant breast lesions by using real-time contrast elastography images to analyze shell elasticity and contrast intensity.
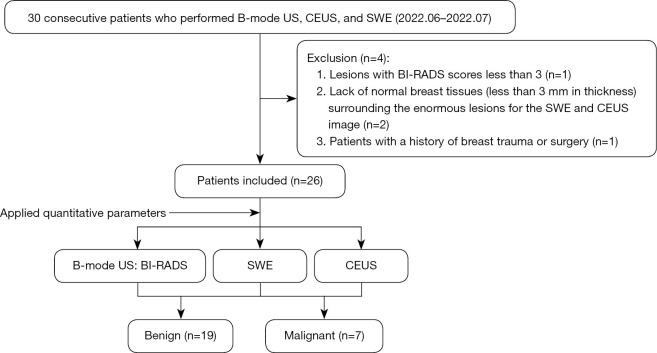
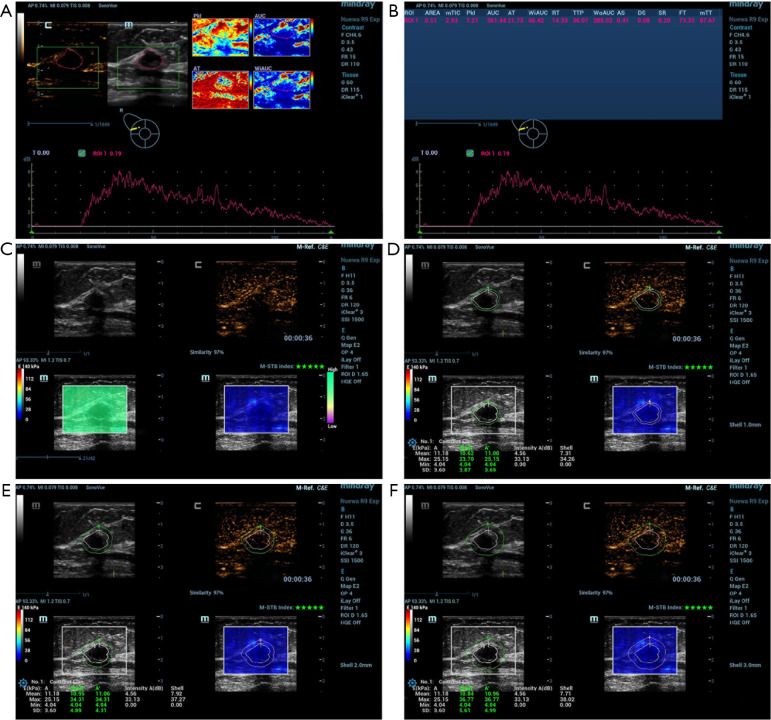
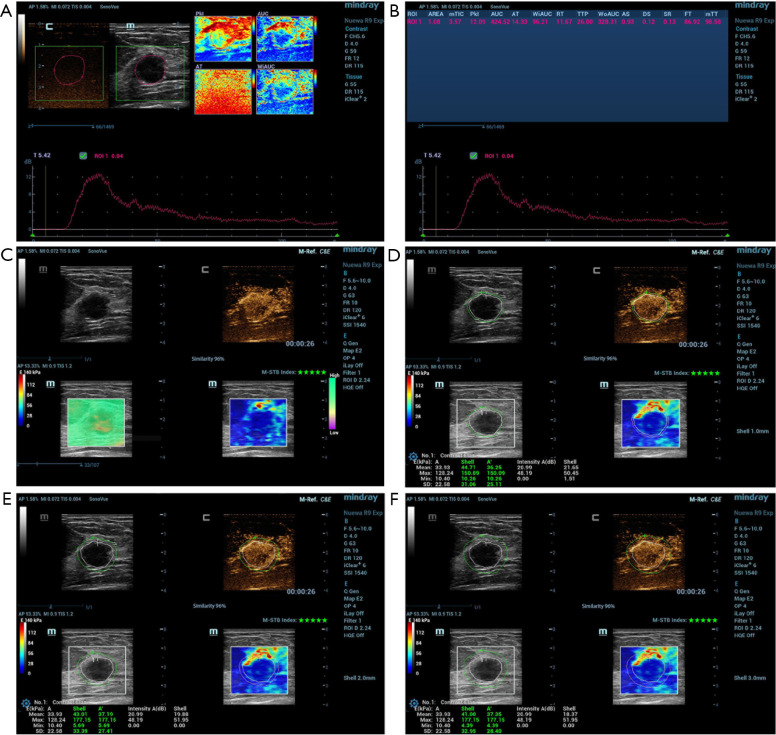
Methods: A total of 26 pathologically confirmed breast lesions in 26 patients were retrospectively reviewed. Each patient underwent conventional B-mode ultrasound, CEUS, and then SWE data was obtained from a frame of image that was almost identical to the B-mode and CEUS images when acquiring time to peak (TTP). Breast lesions were evaluated based on the Breast Imaging Reporting and Data System (BI-RADS) and quantitative characteristics that describe the stiffness and intensity of contrast of the 1.0-3.0 mm shell region. Quantitative aspects of the inner lesions and shell on the elastogram included the maximum (Emax), mean (Emean), and minimum (Emin) Young's moduli. Quantitative enhanced features included maximum (Imax) and mean (Imean) intensity. We took postoperative pathological results as the gold standard. Receiver operating characteristic (ROC) curves were used to compare the diagnostic efficacy of the 2 examination modalities, either alone or in combination.
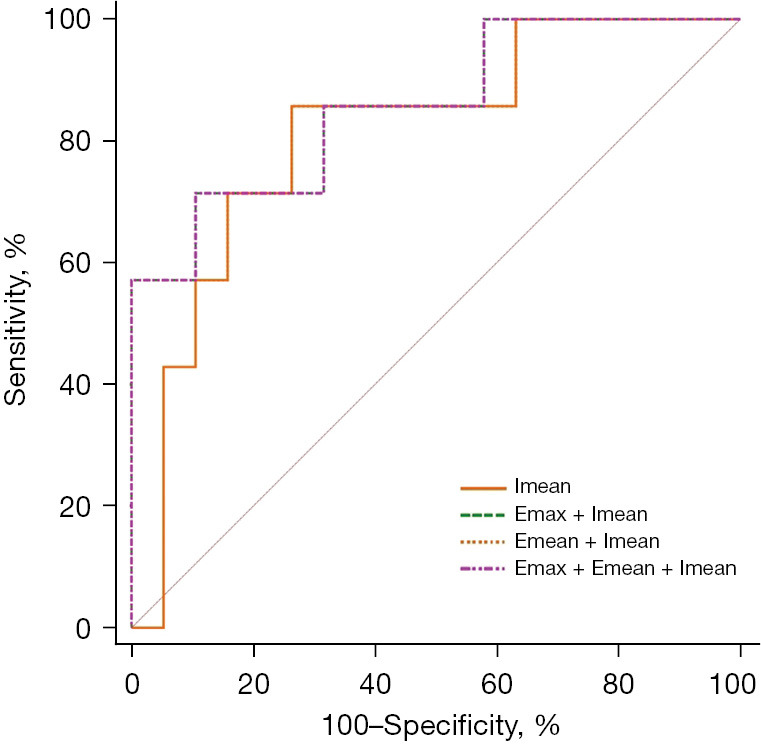
Results: The age of the patients ranged from 23 to 76 years, with a 42.5-year average age. In all breast lesions, 19 were benign and 7 were malignant. SWE synchronized with CEUS can effectively improve the diagnostic performance of breast lesions, and Emean + Imean and Emax + Emean + Imean of shell at 1.0 mm both had the highest area under the curve (AUC) of 0.86 [95% confidence interval (CI): 0.67, 0.96], with the sensitivity and specificity of 71.43% and 89.47%, respectively.
Conclusions: The combination of CEUS and SWE has a better diagnostic value in differentiating benign and malignant breast lesions compared to separate techniques.
Keywords: Breast; contrast-enhanced ultrasound (CEUS); shear wave elastography (SWE); ultrasonography (US).
2023 Gland Surgery. All rights reserved.
Conflict of interest statement
Conflicts of Interest: All authors have completed the ICMJE uniform disclosure form (available at https://gs.amegroups.com/article/view/10.21037/gs-22-684/coif). JP is from Shenzhen Mindray Bio-medical Electronics Co., Ltd. The other authors have no conflicts of interest to declare.
Figures
Similar articles
-
Determining whether the diagnostic value of B-ultrasound combined with contrast-enhanced ultrasound and shear wave elastography in breast mass-like and non-mass-like lesions differs: a diagnostic test.Gland Surg. 2023 Feb 28;12(2):282-296. doi: 10.21037/gs-23-51. Epub 2023 Feb 24. Gland Surg. 2023. PMID: 36915819 Free PMC article.
-
Clinical value of quantitative analysis of Sonazoid-contrast enhanced ultrasound combined with shear wave elastography in discriminating and diagnosing breast tumor characteristics.Front Oncol. 2025 May 20;15:1485671. doi: 10.3389/fonc.2025.1485671. eCollection 2025. Front Oncol. 2025. PMID: 40463880 Free PMC article.
-
The application of multimodal ultrasound examination in the differential diagnosis of benign and malignant breast lesions of BI-RADS category 4.Front Med (Lausanne). 2025 Jun 9;12:1596100. doi: 10.3389/fmed.2025.1596100. eCollection 2025. Front Med (Lausanne). 2025. PMID: 40552183 Free PMC article.
-
Diagnostic Accuracy of Shear-Wave Elastography for Breast Lesion Characterization in Women: A Systematic Review and Meta-Analysis.J Am Coll Radiol. 2022 May;19(5):625-634.e0. doi: 10.1016/j.jacr.2022.02.022. Epub 2022 Mar 28. J Am Coll Radiol. 2022. PMID: 35358483
-
Comparative Diagnostic Accuracy of Contrast-Enhanced Ultrasound and Shear Wave Elastography in Differentiating Benign and Malignant Lesions: A Network Meta-Analysis.Front Oncol. 2019 Mar 5;9:102. doi: 10.3389/fonc.2019.00102. eCollection 2019. Front Oncol. 2019. PMID: 30891425 Free PMC article.
Cited by
-
Determining whether the diagnostic value of B-ultrasound combined with contrast-enhanced ultrasound and shear wave elastography in breast mass-like and non-mass-like lesions differs: a diagnostic test.Gland Surg. 2023 Feb 28;12(2):282-296. doi: 10.21037/gs-23-51. Epub 2023 Feb 24. Gland Surg. 2023. PMID: 36915819 Free PMC article.
-
Ultrasound elastography: advances and challenges in early detection of breast cancer.Front Oncol. 2025 Jun 26;15:1589142. doi: 10.3389/fonc.2025.1589142. eCollection 2025. Front Oncol. 2025. PMID: 40641918 Free PMC article. Review.
-
A systematic review and meta-analysis comparing the diagnostic capability of automated breast ultrasound and contrast-enhanced ultrasound in breast cancer.Front Oncol. 2024 Jan 9;13:1305545. doi: 10.3389/fonc.2023.1305545. eCollection 2023. Front Oncol. 2024. PMID: 38264749 Free PMC article.
-
Diagnostic performance of contrast-enhanced ultrasound combined with shear wave elastography in differentiating benign from malignant breast lesions: a systematic review and meta-analysis.Gland Surg. 2023 Nov 24;12(11):1610-1623. doi: 10.21037/gs-23-333. Epub 2023 Oct 20. Gland Surg. 2023. PMID: 38107493 Free PMC article.
-
Clinical value of quantitative analysis of Sonazoid-contrast enhanced ultrasound combined with shear wave elastography in discriminating and diagnosing breast tumor characteristics.Front Oncol. 2025 May 20;15:1485671. doi: 10.3389/fonc.2025.1485671. eCollection 2025. Front Oncol. 2025. PMID: 40463880 Free PMC article.
References
LinkOut - more resources
Full Text Sources