

Complete sequence and comparative analysis of the mitochondrial genome of the rare and endangered Clematis acerifolia, the first clematis mitogenome to provide new insights into the phylogenetic evolutionary status of the genus
- PMID: 36761694
- PMCID: PMC9907779
- DOI: 10.3389/fgene.2022.1050040
Complete sequence and comparative analysis of the mitochondrial genome of the rare and endangered Clematis acerifolia, the first clematis mitogenome to provide new insights into the phylogenetic evolutionary status of the genus
Abstract
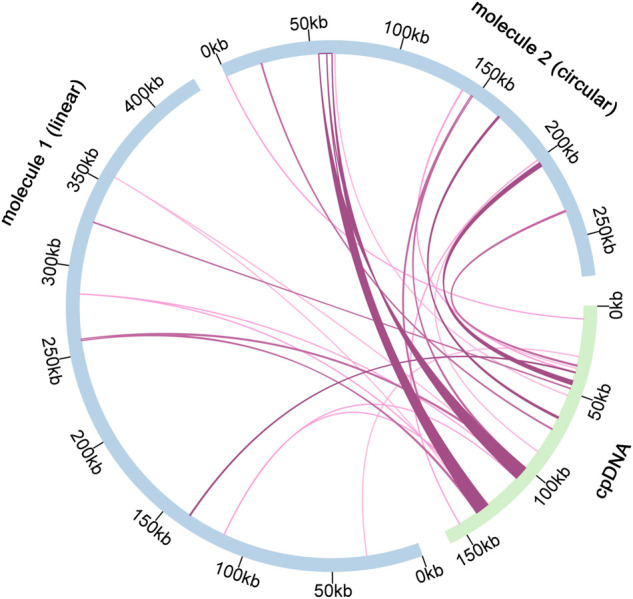
Clematis is one of the large worldwide genera of the Ranunculaceae Juss. Family, with high ornamental and medicinal value. China is the modern distribution centre of Clematis with abundant natural populations. Due to the complexity and high morphological diversity of Clematis, the genus is difficult to classify systematically, and in particular, the phylogenetic position of the endangered Clematis acerifolia is highly controversial. The use of the mitochondrial complete genome is a powerful molecular method that is frequently used for inferring plants phylogenies. However, studies on Clematis mitogenome are rare, thus limiting our full understanding of its phylogeny and genome evolution. Here, we sequenced and annotated the C. acerifolia mt genome using Illumina short- and Nanopore long-reads, characterized the species first complete mitogenome, and performed a comparative phylogenetic analysis with its close relatives. The total length of the C. acerifolia mitogenome is 698,247 bp and the main structure is multi-branched (linear molecule 1 and circular molecule 2). We annotated 55 genes, including 35 protein-coding, 17 tRNA, and 3 rRNA genes. The C. acerifolia mitogenome has extremely unconserved structurally, with extensive sequence transfer between the chloroplast and mitochondrial organelles, sequence repeats, and RNA editing. The phylogenetic position of C. acerifolia was determined by constructing the species mitogenome with 24 angiosperms. Further, our C. acerifolia mitogenome characteristics investigation included GC contents, codon usage, repeats and synteny analysis. Overall, our results are expected to provide fundamental information for C. acerifolia mitogenome evolution and confirm the validity of mitochondrial analysis in determining the phylogenetic positioning of Clematis plants.
Keywords: Clematis acerifolia; clematis; mitochondrial genome; organelle genome; phylogenetic relationship; repeats.
Copyright © 2023 Liu, Qu, Yuan, Zhao, Chen, Han, Li, El-Kassaby, Yin, Xie, Tong and Liu.
Conflict of interest statement
YY was employed by Wuhan Benagen Technology Co., Ltd. The remaining authors declare that the research was conducted in the absence of any commercial or financial relationships that could be construed as a potential conflict of interest.
Figures


Similar articles
-
The first complete mitochondrial genome of Curcuma amarissima (Zingiberaceae): insights into multi-branch structure, codon usage, and phylogenetic evolution.BMC Genomics. 2025 Apr 5;26(1):343. doi: 10.1186/s12864-025-11540-x. BMC Genomics. 2025. PMID: 40188039 Free PMC article.
-
Assembly and comparative analysis of the first complete mitochondrial genome of Astragalus membranaceus (Fisch.) Bunge: an invaluable traditional Chinese medicine.BMC Plant Biol. 2024 Nov 8;24(1):1055. doi: 10.1186/s12870-024-05780-4. BMC Plant Biol. 2024. PMID: 39511474 Free PMC article.
-
Elucidating the multichromosomal structure within the Brasenia schreberi mitochondrial genome through assembly and analysis.BMC Genomics. 2024 Apr 29;25(1):422. doi: 10.1186/s12864-024-10331-0. BMC Genomics. 2024. PMID: 38684976 Free PMC article.
-
Comparative analysis of mitochondrial genomes of Stemona tuberosa lour. reveals heterogeneity in structure, synteny, intercellular gene transfer, and RNA editing.BMC Plant Biol. 2025 Jan 7;25(1):23. doi: 10.1186/s12870-024-06034-z. BMC Plant Biol. 2025. PMID: 39762746 Free PMC article.
-
Assembly and comparative analysis of the complete mitochondrial genome of Isopyrum anemonoides (Ranunculaceae).PLoS One. 2023 Oct 5;18(10):e0286628. doi: 10.1371/journal.pone.0286628. eCollection 2023. PLoS One. 2023. PMID: 37796878 Free PMC article.
Cited by
-
Assembly and comparative analysis of the complete mitochondrial genome of Lactuca sativa var. ramosa Hort.Sci Rep. 2025 Mar 18;15(1):9257. doi: 10.1038/s41598-025-93762-3. Sci Rep. 2025. PMID: 40102506 Free PMC article.
-
The complex DNA molecular combination with a linear and circular structure in Magnolia kwangsiensis mitochondrial genome.Front Plant Sci. 2025 May 29;16:1590173. doi: 10.3389/fpls.2025.1590173. eCollection 2025. Front Plant Sci. 2025. PMID: 40510170 Free PMC article.
-
Identifying nexilin as a central gene in neutrophil-driven abdominal aortic aneurysm pathogenesis.Mol Med. 2025 Mar 26;31(1):120. doi: 10.1186/s10020-025-01157-x. Mol Med. 2025. PMID: 40140755 Free PMC article.
-
De Novo Assembly and Comparative Analysis of Mitochondrial Genomes of Two Pueraria montana Varieties.Int J Mol Sci. 2024 May 22;25(11):5656. doi: 10.3390/ijms25115656. Int J Mol Sci. 2024. PMID: 38891844 Free PMC article.
-
The evolving landscape of involvement of DTYMK enzymes in cancer.Med Oncol. 2023 Jun 26;40(8):213. doi: 10.1007/s12032-023-02086-7. Med Oncol. 2023. PMID: 37358701 Review.
References
Associated data
LinkOut - more resources
Full Text Sources
Miscellaneous