

Multi-omics profiling and digital image analysis reveal the potential prognostic and immunotherapeutic properties of CD93 in stomach adenocarcinoma
- PMID: 36761750
- PMCID: PMC9905807
- DOI: 10.3389/fimmu.2023.984816
Multi-omics profiling and digital image analysis reveal the potential prognostic and immunotherapeutic properties of CD93 in stomach adenocarcinoma
Abstract
Background: Recent evidence highlights the fact that immunotherapy has significantly improved patient outcomes. CD93, as a type I transmembrane glycoprotein, was correlated with tumor-associated angiogenesis; however, how CD93 correlates with immunotherapy in stomach adenocarcinoma (STAD) remains unclear.
Methods: TCGA, GTEx, GEO, TIMER2.0, HPA, TISIDB, TCIA, cBioPortal, LinkedOmics, and ImmuCellAI public databases were used to elucidate CD93 in STAD. Visualization and statistical analysis of data were performed by R (Version 4.1.3), GraphPad (Version 8.0.1), and QuPath (Version 0.3.2).
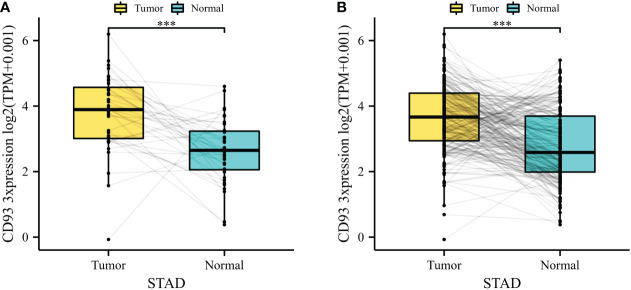
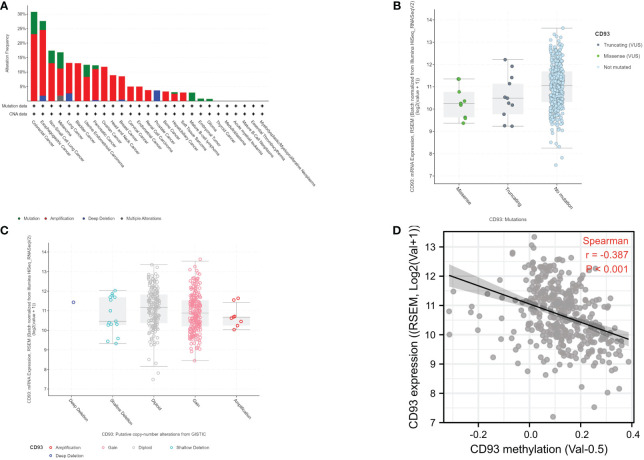
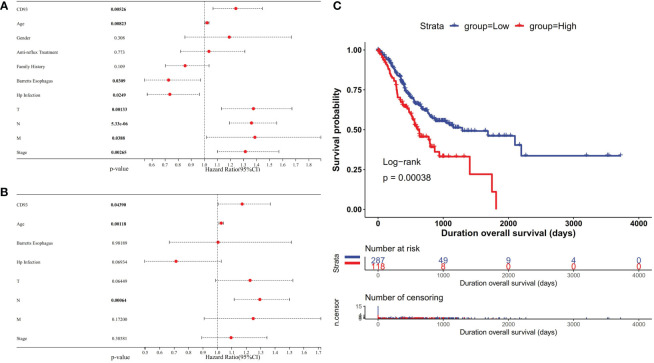
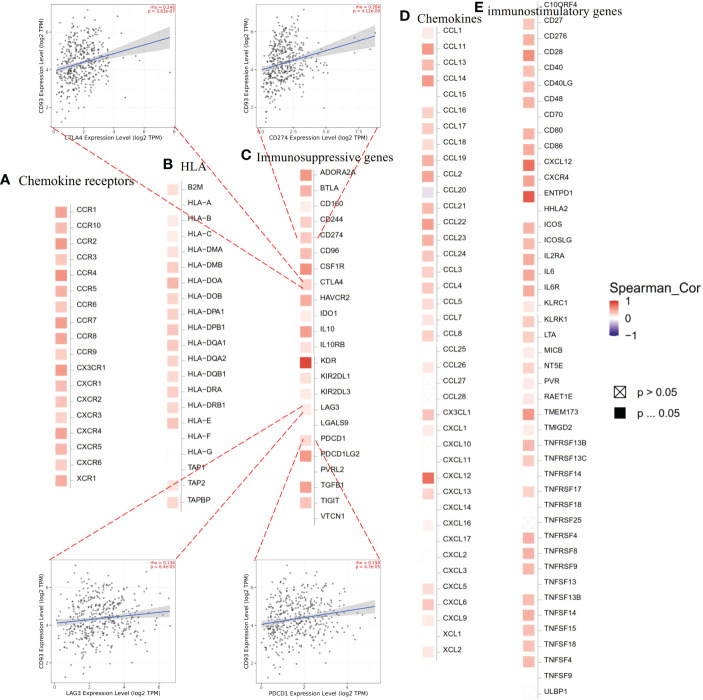
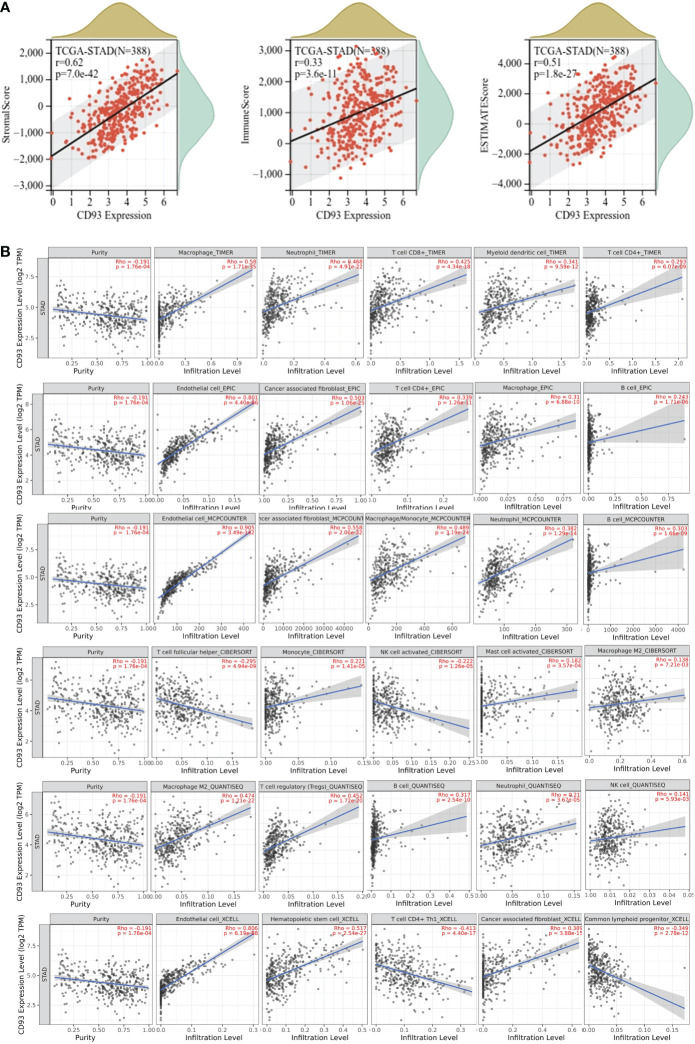
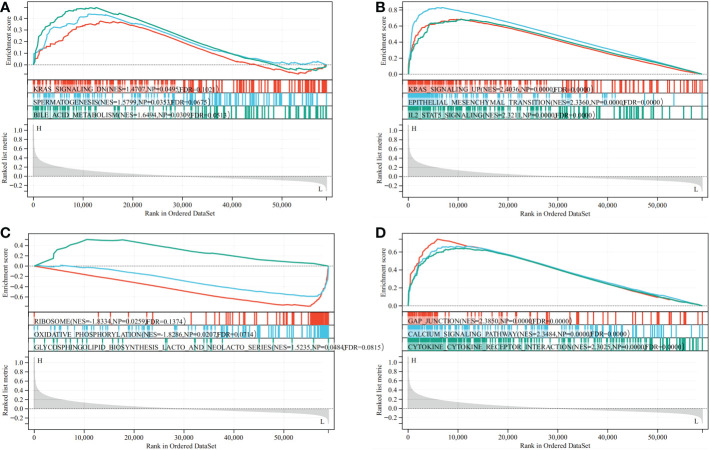
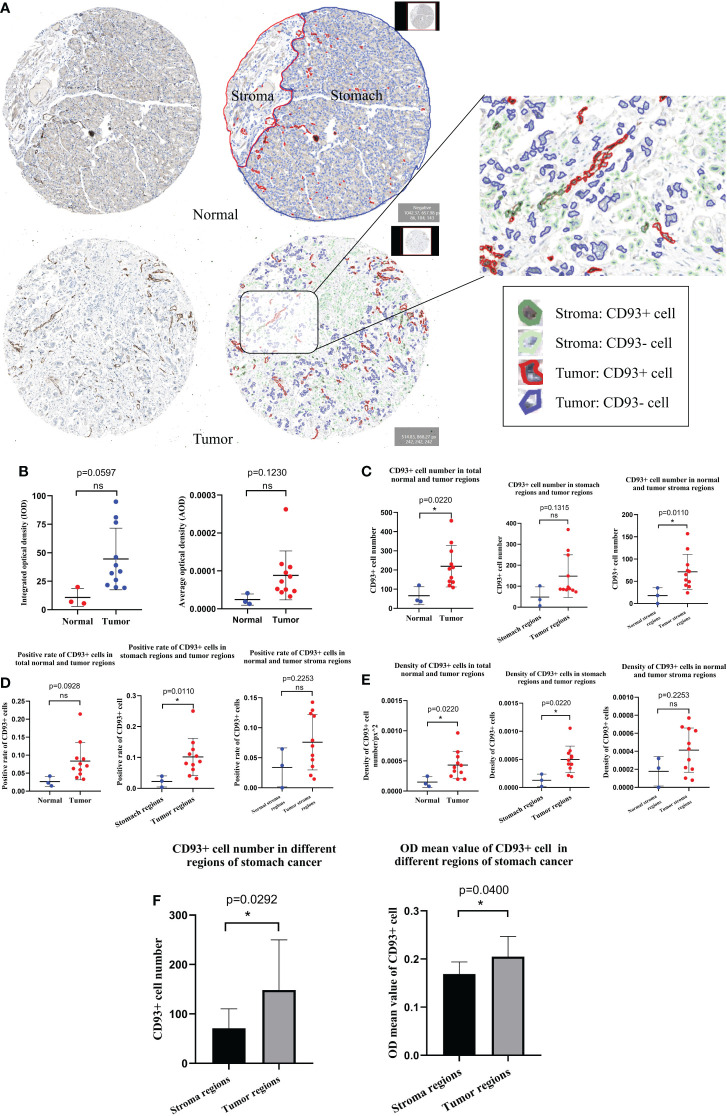
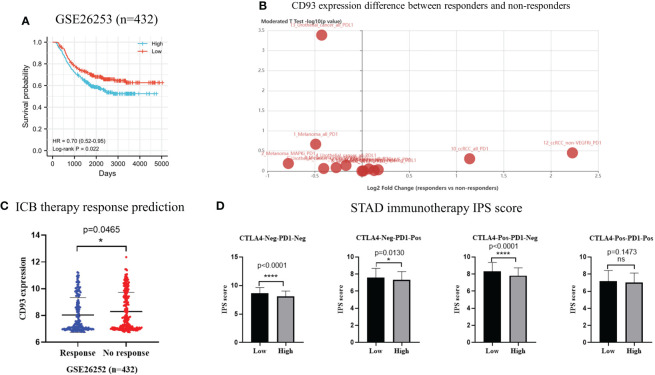
Results: CD93 was highly expressed in STAD compared with adjacent normal tissues. The overexpression of CD93 was significantly correlated with a poor prognosis in STAD. There was a negative correlation between CD93 expression levels with CD93 mutation and methylation in STAD. Our results revealed that CD93 expression was positively associated with most immunosuppressive genes (including PD-1, PD-L1, CTLA-4, and LAG3), immunostimulatory genes, HLA, chemokine, and chemokine receptor proteins in STAD. Furthermore, in STAD, CD93 was noticeably associated with the abundance of multiple immune cell infiltration levels. Functional HALLMARK and KEGG term enhancement analysis of CD93 through Gene Set Enrichment Analysis was correlated with the process of the angiogenesis pathway. Subsequently, digital image analysis results by QuPath revealed that the properties of CD93+ cells were statistically significant in different regions of stomach cancer and normal stomach tissue. Finally, we utilized external databases, including GEO, TISIDB, ImmuCellAI, and TCIA, to validate that CD93 plays a key role in the immunotherapy of STAD.
Conclusion: Our study reveals that CD93 is a potential oncogene and is an indicative biomarker of a worse prognosis and exerts its immunomodulatory properties and potential possibilities for immunotherapy in STAD.
Keywords: CD93; digital image analysis; immunotherapy; multi-omics; stomach adenocarcinoma.
Copyright © 2023 Wu, Fu, Guo, Hu, Li, Shi, Zhang, Han, Lv and Tian.
Conflict of interest statement
The authors declare that the research was conducted in the absence of any commercial or financial relationships that could be construed as a potential conflict of interest.
Figures
Similar articles
-
ZBTB10 as a potential prognosis biomarker and correlates with the tumor immune microenvironment in stomach adenocarcinoma.BMC Gastroenterol. 2025 Jun 6;25(1):435. doi: 10.1186/s12876-025-04047-y. BMC Gastroenterol. 2025. PMID: 40481392 Free PMC article.
-
UBR1 is a prognostic biomarker and therapeutic target associated with immune cell infiltration in gastric cancer.Aging (Albany NY). 2024 Aug 23;16(16):12029-12049. doi: 10.18632/aging.206079. Epub 2024 Aug 23. Aging (Albany NY). 2024. PMID: 39181686 Free PMC article.
-
WGCNA identification of TLR7 as a novel diagnostic biomarker, progression and prognostic indicator, and immunotherapeutic target for stomach adenocarcinoma.Cancer Med. 2021 Jun;10(12):4004-4016. doi: 10.1002/cam4.3946. Epub 2021 May 12. Cancer Med. 2021. PMID: 33982398 Free PMC article.
-
Identification and characterization of nucleotide metabolism and neuroendocrine regulation-associated modification patterns in stomach adenocarcinoma with auxiliary prognostic assessment and immunotherapy response prediction.Front Endocrinol (Lausanne). 2023 Jan 16;13:1076521. doi: 10.3389/fendo.2022.1076521. eCollection 2022. Front Endocrinol (Lausanne). 2023. PMID: 36726460 Free PMC article. Review.
-
Identification of novel key regulatory lncRNAs in gastric adenocarcinoma.BMC Genomics. 2022 May 7;23(1):352. doi: 10.1186/s12864-022-08578-6. BMC Genomics. 2022. PMID: 35525925 Free PMC article. Review.
Cited by
-
Clinicopathological association of CD93 expression in gastric adenocarcinoma.J Cancer Res Clin Oncol. 2024 Aug 27;150(8):400. doi: 10.1007/s00432-024-05874-4. J Cancer Res Clin Oncol. 2024. PMID: 39190192 Free PMC article.
-
A machine learning radiomics based on enhanced computed tomography to predict neoadjuvant immunotherapy for resectable esophageal squamous cell carcinoma.Front Immunol. 2024 Jun 14;15:1405146. doi: 10.3389/fimmu.2024.1405146. eCollection 2024. Front Immunol. 2024. PMID: 38947338 Free PMC article.
-
Integrative analysis of the role of the DPH gene family in hepatocellular carcinoma and expression validation.Transl Cancer Res. 2024 Aug 31;13(8):4062-4084. doi: 10.21037/tcr-24-147. Epub 2024 Aug 26. Transl Cancer Res. 2024. PMID: 39262488 Free PMC article.
-
Identification of key ferroptosis-related genes associated with the development of gastric cancer: Prognostic models, molecular mechanisms and potential treatment strategies.Oncol Lett. 2025 Jul 18;30(4):450. doi: 10.3892/ol.2025.15196. eCollection 2025 Oct. Oncol Lett. 2025. PMID: 40747376 Free PMC article.
-
Expression and prognostic significance of CD93 in blood vessels in colorectal cancer: an immunohistochemical analysis of 134 cases.BMC Gastroenterol. 2025 Feb 17;25(1):84. doi: 10.1186/s12876-025-03643-2. BMC Gastroenterol. 2025. PMID: 39962383 Free PMC article.
References
-
- Langenkamp E, Zhang L, Lugano R, Huang H, Elhassan TE, Georganaki M, et al. . Elevated expression of the c-type lectin CD93 in the glioblastoma vasculature regulates cytoskeletal rearrangements that enhance vessel function and reduce host survival. Cancer Res (2015) 75:4504–16. doi: 10.1158/0008-5472.CAN-14-3636 - DOI - PubMed
Publication types
MeSH terms
Substances
LinkOut - more resources
Full Text Sources
Medical
Research Materials
Miscellaneous