Dendritic cell phenotype and function in a 3D co-culture model of patient-derived metastatic colorectal cancer organoids
- PMID: 36761758
- PMCID: PMC9905679
- DOI: 10.3389/fimmu.2023.1105244
Dendritic cell phenotype and function in a 3D co-culture model of patient-derived metastatic colorectal cancer organoids
Abstract
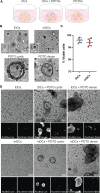
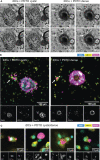
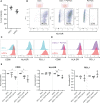
Colorectal cancer (CRC) remains one of the most aggressive and lethal cancers, with metastasis accounting for most deaths. As such, there is an unmet need for improved therapies for metastatic CRC (mCRC). Currently, the research focus is shifting towards the reciprocal interactions within the tumor microenvironment (TME), which prevent tumor clearance by the immune system. Dendritic cells (DCs) play a key role in the initiation and amplification of anti-tumor immune responses and in driving the clinical success of immunotherapies. Dissecting the interactions between DCs and CRC cells may open doors to identifying key mediators in tumor progression, and possible therapeutic targets. This requires representative, robust and versatile models and tools. Currently, there is a shortage of such in vitro systems to model the CRC TME and its tumor-immune cell interactions. Here we develop and establish a dynamic organotypic 3D co-culture system to recapitulate and untangle the interactions between DCs and patient-derived mCRC tumor organoids. To our knowledge, this is the first study investigating human DCs in co-culture with tumor organoids in a 3D, organotypic setting. This system reveals how mCRC organoids modulate and shape monocyte-derived DCs (MoDCs) behavior, phenotype, and function, within a collagen matrix, using techniques such as brightfield and fluorescence microscopy, flow cytometry, and fluorescence-activated cell sorting. Our 3D co-culture model shows high viability and extensive interaction between DCs and tumor organoids, and its structure resembles patient tissue sections. Furthermore, it is possible to retrieve DCs from the co-cultures and characterize their phenotypic and functional profile. In our study, the expression of activation markers in both mature and immature DCs and their ability to activate T cells were impacted by co-culture with tumor organoids. In the future, this direct co-culture platform can be adapted and exploited to study the CRC-DC interplay in more detail, enabling novel and broader insights into CRC-driven DC (dys)function.
Keywords: 3D co-culture; dendritic cell dysfunction; human dendritic cells; immunosuppression; metastatic colorectal cancer; patient-derived tumor organoids; tumor microenvironment.
Copyright © 2023 Subtil, Iyer, Poel, Bakkerus, Gorris, Escalona, Dries, Cambi, Verheul, de Vries and Tauriello.
Conflict of interest statement
The authors declare that the research was conducted in the absence of any commercial or financial relationships that could be construed as a potential conflict of interest.
Figures


Similar articles
-
cDC2 plasticity and acquisition of a DC3-like phenotype mediated by IL-6 and PGE2 in a patient-derived colorectal cancer organoids model.Eur J Immunol. 2024 Jun;54(6):e2350891. doi: 10.1002/eji.202350891. Epub 2024 Mar 21. Eur J Immunol. 2024. PMID: 38509863
-
The Therapeutic Potential of Tackling Tumor-Induced Dendritic Cell Dysfunction in Colorectal Cancer.Front Immunol. 2021 Oct 6;12:724883. doi: 10.3389/fimmu.2021.724883. eCollection 2021. Front Immunol. 2021. PMID: 34691029 Free PMC article. Review.
-
Development of primary human pancreatic cancer organoids, matched stromal and immune cells and 3D tumor microenvironment models.BMC Cancer. 2018 Mar 27;18(1):335. doi: 10.1186/s12885-018-4238-4. BMC Cancer. 2018. PMID: 29587663 Free PMC article.
-
Hydrogel-based colorectal cancer organoid co-culture models.Acta Biomater. 2021 Sep 15;132:461-472. doi: 10.1016/j.actbio.2020.12.037. Epub 2020 Dec 31. Acta Biomater. 2021. PMID: 33388439
-
The tumor microenvironment and dendritic cells: Developers of pioneering strategies in colorectal cancer immunotherapy?Biochim Biophys Acta Rev Cancer. 2025 Apr;1880(2):189281. doi: 10.1016/j.bbcan.2025.189281. Epub 2025 Feb 8. Biochim Biophys Acta Rev Cancer. 2025. PMID: 39929377 Review.
Cited by
-
Establishment of head and neck squamous cell carcinoma mouse models for cetuximab resistance and sensitivity.Cancer Drug Resist. 2023 Oct 17;6(4):709-728. doi: 10.20517/cdr.2023.62. eCollection 2023. Cancer Drug Resist. 2023. PMID: 38239393 Free PMC article.
-
Graph-Based 3-Dimensional Spatial Gene Neighborhood Networks of Single Cells in Gels and Tissues.BME Front. 2025 Mar 13;6:0110. doi: 10.34133/bmef.0110. eCollection 2025. BME Front. 2025. PMID: 40084126 Free PMC article.
-
Rebuilding the microenvironment of primary tumors in humans: a focus on stroma.Exp Mol Med. 2024 Mar;56(3):527-548. doi: 10.1038/s12276-024-01191-5. Epub 2024 Mar 5. Exp Mol Med. 2024. PMID: 38443595 Free PMC article. Review.
-
Causal impacts of 731 immunocyte phenotypes on colorectal cancer-evidence from a bidirectional two-sample Mendelian randomization.Hum Vaccin Immunother. 2024 Dec 31;20(1):2432115. doi: 10.1080/21645515.2024.2432115. Epub 2024 Nov 25. Hum Vaccin Immunother. 2024. PMID: 39584495 Free PMC article.
-
Landscape of human organoids: Ideal model in clinics and research.Innovation (Camb). 2024 Apr 1;5(3):100620. doi: 10.1016/j.xinn.2024.100620. eCollection 2024 May 6. Innovation (Camb). 2024. PMID: 38706954 Free PMC article. Review.
References
Publication types
MeSH terms
LinkOut - more resources
Full Text Sources
Research Materials

