Construction and systematic evaluation of a machine learning-based cuproptosis-related lncRNA score signature to predict the response to immunotherapy in hepatocellular carcinoma
- PMID: 36761763
- PMCID: PMC9905126
- DOI: 10.3389/fimmu.2023.1097075
Construction and systematic evaluation of a machine learning-based cuproptosis-related lncRNA score signature to predict the response to immunotherapy in hepatocellular carcinoma
Abstract
Introduction: Hepatocellular carcinoma (HCC) is a common malignant cancer with a poor prognosis. Cuproptosis and associated lncRNAs are connected with cancer progression. However, the information on the prognostic value of cuproptosis-related lncRNAs is still limited in HCC.
Methods: We isolated the transcriptome and clinical information of HCC from TCGA and ICGC databases. Ten cuproptosis-related genes were obtained and related lncRNAs were correlated by Pearson's correlation. By performing lasso regression, we created a cuproptosis-related lncRNA prognostic model based on the cuproptosis-related lncRNA score (CLS). Comprehensive analyses were performed, including the fields of function, immunity, mutation and clinical application, by various R packages.
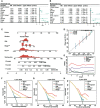
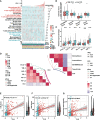
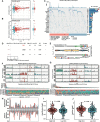
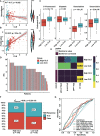
Results: Ten cuproptosis-related genes were selected, and 13 correlated prognostic lncRNAs were collected for model construction. CLS was positively or negatively correlated with cancer-related pathways. In addition, cell cycle and immune related pathways were enriched. By performing tumor microenvironment (TME) analysis, we determined that T-cells were activated. High CLS had more tumor characteristics and may lead to higher invasiveness and treatment resistance. Three genes (TP53, CSMD1 and RB1) were found in high CLS samples with more mutational frequency. More amplification and deletion were detected in high CLS samples. In clinical application, a CLS-based nomogram was constructed. 5-Fluorouracil, gemcitabine and doxorubicin had better sensitivity in patients with high CLS. However, patients with low CLS had better immunotherapeutic sensitivity.
Conclusion: We created a prognostic CLS signature by machine learning, and we comprehensively analyzed the signature in the fields of function, immunity, mutation and clinical application.
Keywords: cuproptosis-related lncRNA score; hepatocellular carcinoma; immunotherapy; machine learning; prognostic model.
Copyright © 2023 Lu, Liao, Cheng, Ma, Wu, Xie and He.
Conflict of interest statement
The authors declare that the research was conducted in the absence of any commercial or financial relationships that could be construed as a potential conflict of interest.
Figures


Similar articles
-
A Cuproptosis-Related LncRNA Risk Model for Predicting Prognosis and Immunotherapeutic Efficacy in Patients with Hepatocellular Carcinoma.Biochem Genet. 2024 Jun;62(3):2332-2351. doi: 10.1007/s10528-023-10539-x. Epub 2023 Oct 29. Biochem Genet. 2024. PMID: 37898914
-
A novel cuproptosis-related lncRNA signature predicts the prognosis and immunotherapy for hepatocellular carcinoma.Cancer Biomark. 2023;37(1):13-26. doi: 10.3233/CBM-220259. Cancer Biomark. 2023. PMID: 37005878
-
Comprehensive analysis of cuproptosis-related lncRNAs in immune infiltration and prognosis in hepatocellular carcinoma.BMC Bioinformatics. 2023 Jan 3;24(1):4. doi: 10.1186/s12859-022-05091-1. BMC Bioinformatics. 2023. PMID: 36597032 Free PMC article.
-
lncRNAs as prognostic markers and therapeutic targets in cuproptosis-mediated cancer.Clin Exp Med. 2024 Sep 26;24(1):226. doi: 10.1007/s10238-024-01491-0. Clin Exp Med. 2024. PMID: 39325172 Free PMC article. Review.
-
Cuproplasia and cuproptosis in hepatocellular carcinoma: mechanisms, relationship and potential role in tumor microenvironment and treatment.Cancer Cell Int. 2025 Apr 9;25(1):137. doi: 10.1186/s12935-025-03683-4. Cancer Cell Int. 2025. PMID: 40205387 Free PMC article. Review.
Cited by
-
Prognostic analysis of hepatocellular carcinoma based on cuproptosis -associated lncRNAs.BMC Gastroenterol. 2024 Apr 23;24(1):142. doi: 10.1186/s12876-024-03219-6. BMC Gastroenterol. 2024. PMID: 38654165 Free PMC article.
-
Targeting cuproptosis in liver cancer: Molecular mechanisms and therapeutic implications.Apoptosis. 2025 Aug 7. doi: 10.1007/s10495-025-02150-9. Online ahead of print. Apoptosis. 2025. PMID: 40775595 Review.
-
Long non-coding rnas as key modulators of the immune microenvironment in hepatocellular carcinoma: implications for Immunotherapy.Front Immunol. 2025 Apr 25;16:1523190. doi: 10.3389/fimmu.2025.1523190. eCollection 2025. Front Immunol. 2025. PMID: 40352941 Free PMC article. Review.
-
Analysis of Multiple Programmed Cell Death Patterns and Functional Validations of Apoptosis-Associated Genes in Lung Adenocarcinoma.Ann Surg Oncol. 2025 Aug;32(8):6005-6022. doi: 10.1245/s10434-025-17224-w. Epub 2025 Apr 2. Ann Surg Oncol. 2025. PMID: 40175857
-
Big data analysis and machine learning of the role of cuproptosis-related long non-coding RNAs (CuLncs) in the prognosis and immune landscape of ovarian cancer.Front Immunol. 2025 Feb 25;16:1555782. doi: 10.3389/fimmu.2025.1555782. eCollection 2025. Front Immunol. 2025. PMID: 40070821 Free PMC article.
References
-
- Bruix J, Qin S, Merle P, Granito A, Huang YH, Bodoky G, et al. . Regorafenib for patients with hepatocellular carcinoma who progressed on sorafenib treatment (RESORCE): a randomised, double-blind, placebo-controlled, phase 3 trial. Lancet (2017) 389:56–66. doi: 10.1016/S0140-6736(16)32453-9 - DOI - PubMed
MeSH terms
Substances
LinkOut - more resources
Full Text Sources
Medical
Research Materials
Miscellaneous

