. 2023 Jan 25:14:1091403.
doi: 10.3389/fimmu.2023.1091403. eCollection 2023.

Macrophage differentiation is marked by increased abundance of the mRNA 3' end processing machinery, altered poly(A) site usage, and sensitivity to the level of CstF64

Affiliations

Macrophage differentiation is marked by increased abundance of the mRNA 3' end processing machinery, altered poly(A) site usage, and sensitivity to the level of CstF64

Srimoyee Mukherjee et al. Front Immunol. .

Abstract

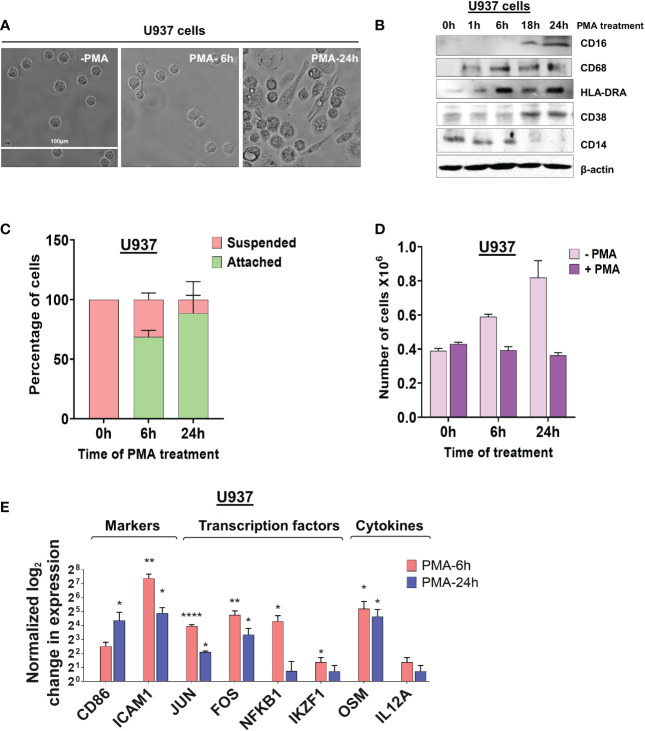
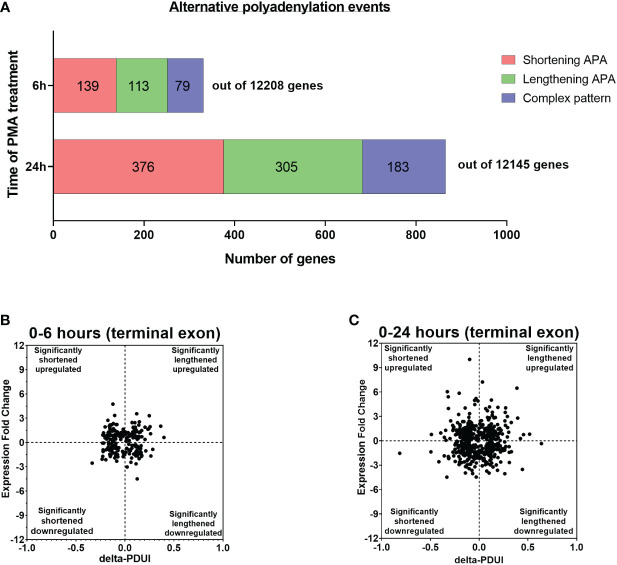
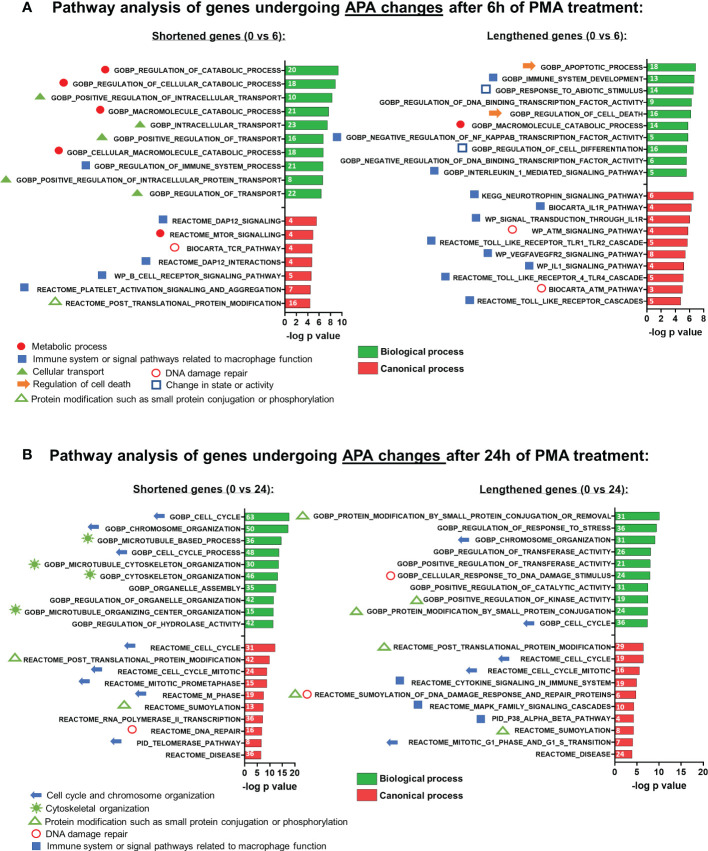
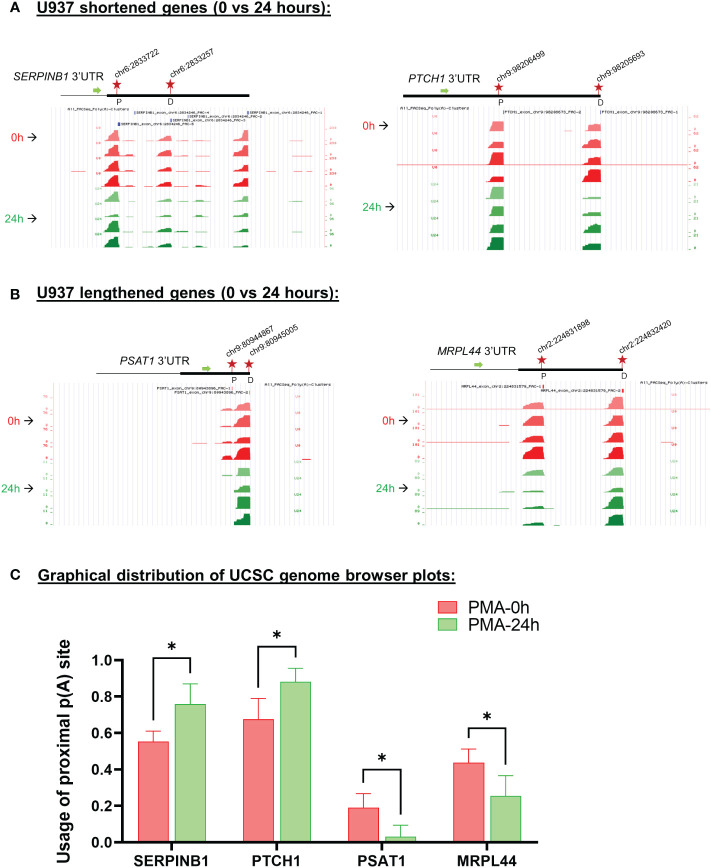
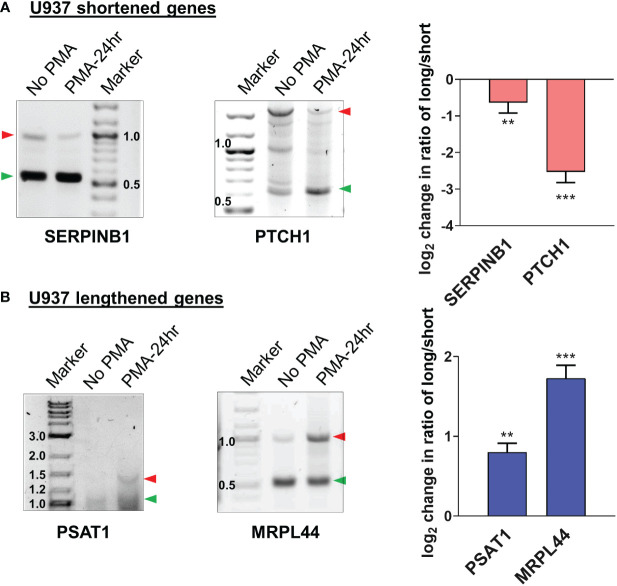
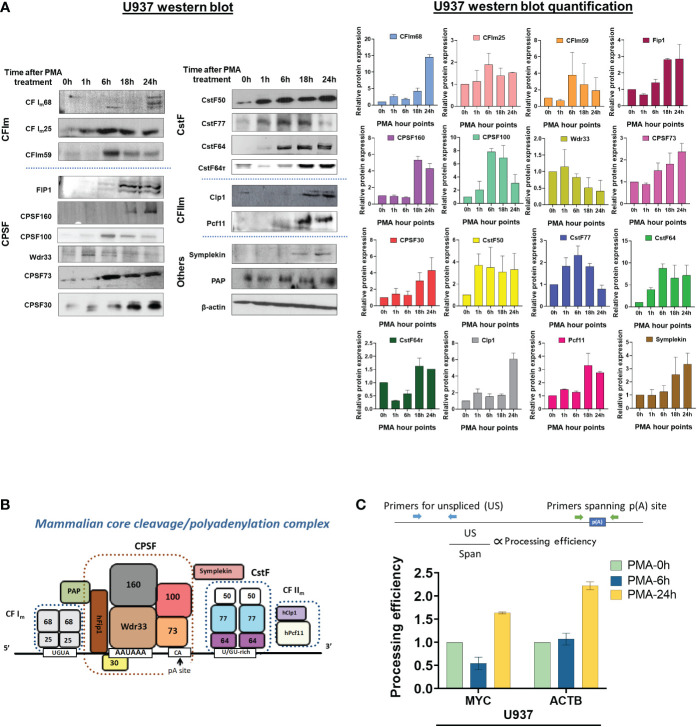
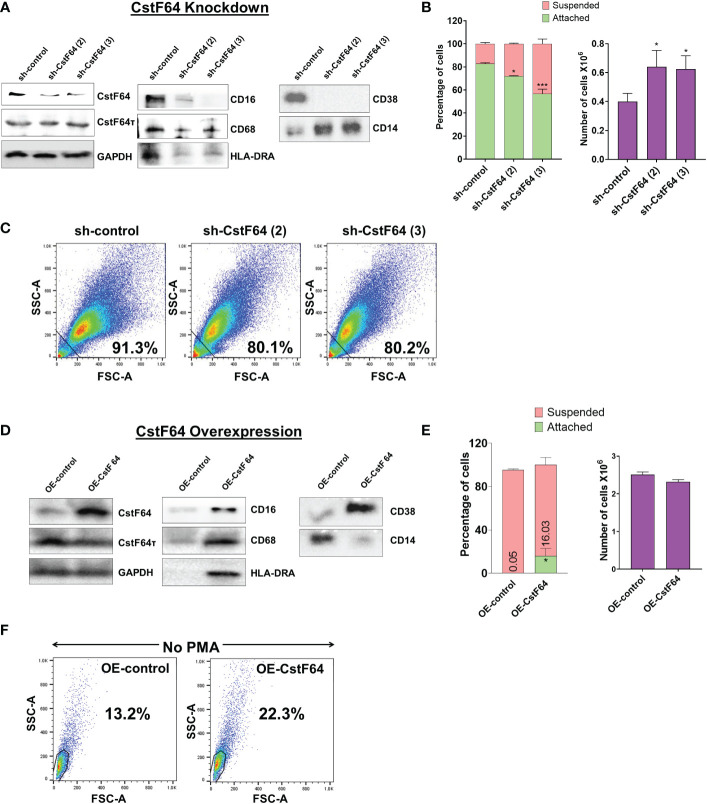
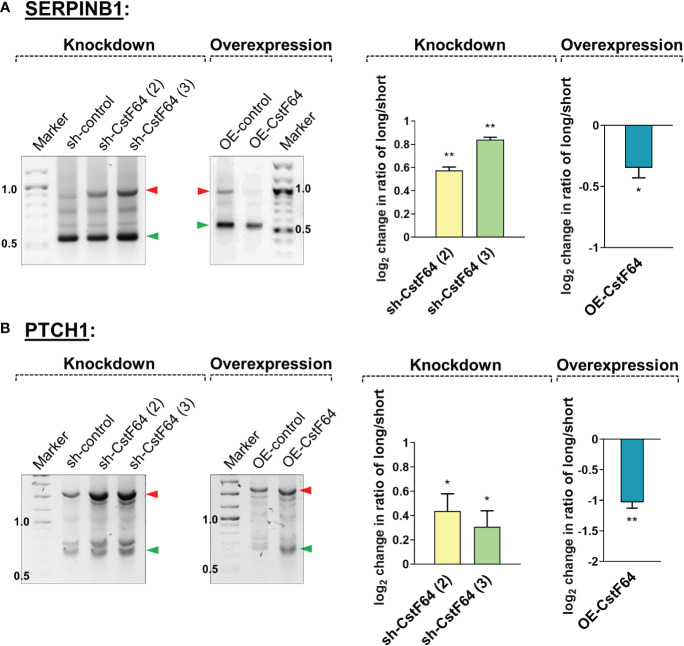
Regulation of mRNA polyadenylation is important for response to external signals and differentiation in several cell types, and results in mRNA isoforms that vary in the amount of coding sequence or 3' UTR regulatory elements. However, its role in differentiation of monocytes to macrophages has not been investigated. Macrophages are key effectors of the innate immune system that help control infection and promote tissue-repair. However, overactivity of macrophages contributes to pathogenesis of many diseases. In this study, we show that macrophage differentiation is characterized by shortening and lengthening of mRNAs in relevant cellular pathways. The cleavage/polyadenylation (C/P) proteins increase during differentiation, suggesting a possible mechanism for the observed changes in poly(A) site usage. This was surprising since higher C/P protein levels correlate with higher proliferation rates in other systems, but monocytes stop dividing after induction of differentiation. Depletion of CstF64, a C/P protein and known regulator of polyadenylation efficiency, delayed macrophage marker expression, cell cycle exit, attachment, and acquisition of structural complexity, and impeded shortening of mRNAs with functions relevant to macrophage biology. Conversely, CstF64 overexpression increased use of promoter-proximal poly(A) sites and caused the appearance of differentiated phenotypes in the absence of induction. Our findings indicate that regulation of polyadenylation plays an important role in macrophage differentiation.

Keywords: CSTF2; CstF64; alternative polyadenylation; differentiation; macrophage; monocyte.


Conflict of interest statement

The authors declare that the research was conducted in the absence of any commercial or financial relationships that could be construed as a potential conflict of interest.

Figures

Figure 1
Figure 1
Morphological changes and altered expression of cell-surface markers and mRNAs during monocyte differentiation. (A) The effect of differentiation on cellular morphology. U937 cells exposed to PMA (30 nM) for 6 and 24 hours and observed by phase contrast microscopy (40X). (B) Western blots of total cell lysates from U937 cells differentiated with PMA (30 nM) for 0, 1, 6, 18, and 24 hours. Blots were probed with antibodies against CD16, CD68, HLA-DRA, CD38 and CD14 with β-actin as the loading control. (C) Attachment assay of U937 cells. Cells were treated with PMA for 0, 6, and 24 hours and live cells visualized and counted by the Trypan blue exclusion assay. The graph presents the percentage of cells that are suspended or attached. (D) Proliferation assay of U937 cells. The number of cells before and after differentiation depicts the absolute cell number in millions, compared to normal cell proliferation in the absence of PMA. The figure represents mean ± SE from three independent experiments. (E) Real-time quantitative PCR (RT-qPCR)–based analysis of the expression of genes important for macrophage differentiation and function (CD86, ICAM1, JUN, FOS, NFKB1, IKZF1, OSM and IL12A). The RT-qPCR analysis used primers designed in the first exon to represent the total transcript level and the figure shows log2-fold changes in expression of these genes at 6 hours and 24 hours post PMA treatment of U937 cells, where values are normalized to ACTB mRNA and the 0 hour (no PMA) time point. The figure represents mean ± SE from three independent experiments. P value <0.05 was considered significant, where * = P ≤ 0.05; ** = P ≤ 0.01; **** = P ≤ 0.0001.
Figure 2
Figure 2
Evidence of APA in U937 cells after 6 and 24 hours of PMA treatment. (A) Bar graph representing the numbers of genes with APA changes in the terminal 3’ UTR after 6h and 24h of PMA treatment with respect to control undifferentiated U937 cells. Red, green and blue represents shortening, lengthening and complex (where some went up and others went down) APA patterns in the dataset. The criteria for a significant APA change is that at least one PAC in an exon must change greater than 1.5 fold with pAdj <0.1, resulting in a difference in fractional usage of that PAC of at least 10%. (B, C) Log2-fold change in gene expression is plotted against the change in Percentage of Distal poly(A) site Usage Index (delta-PDUI) for 3′-UTR-altered genes in 6h PMA-treated U937 cells with respect to control undifferentiated ones (B) or in 24h PMA-treated U937 samples (C). Plots for fold change vs poly(A) site usage (delta PDUI) where genes on the left half of each graph represent 3′-UTR-shortened hits, whereas those on the right half represent 3′-UTR lengthened hits.
Figure 3
Figure 3
Gene set enrichment analysis (GSEA) of APA events in U937 cells after PMA treatment. Functional annotation clustering of mRNAs whose APA is regulated and after 6h (A) and 24h (B) of differentiation. The 10 most significant GO-process enriched gene groups for biological process (green) or canonical process (red) are ranked based on negative log10 (P-values) for shortened (left panel) and lengthened (right panel) transcripts. Pathways classified according to specific cellular processes are grouped together as indicated by the individual symbols at the bottom of the graphs.
Figure 4
Figure 4
Changes in poly(A) site use in U937 cells after 24 hours of PMA treatment. UCSC genome browser plots of RNA sequencing tracks highlighting the 3′-UTR profile differences for shortened genes (A) or lengthened genes (B) after 24 hours of PMA treatment with respect to control (0h). The colors of the tracks represent 0h (red) and 24h (green). Proximal (P) and distal (D) poly(A) sites are indicated with red stars. The green arrow defines the direction of the coding strand, and tag counts are indicated on the y axis. Additionally, positions and chromosome co-ordinates of the annotated PACs are indicated at the top of each plot. (C) Quantitative bar graphs reflecting the differences in APA for shortened and lengthened targets. The mean relative usage of proximal poly(A) site with respect to the total read counts at the proximal and distal poly(A) sites as visualized in the UCSC genome browser is plotted for each target. Unpaired t-test was performed to determine the significance between the treatment groups and P value <0.05 was considered significant.where * = P ≤ 0.05.
Figure 5
Figure 5
Validation of APA events in U937 by 3’ RACE. Representative 1% agarose gel images for the 3′ RACE RT-PCR from U937 cells (untreated and 24h PMA-treated) for (A) shortened genes SERPINB1, PTCH1 and (B) lengthened genes PSAT1 and MRPL44 using gene specific primers at the last exon-exon junction and a common reverse anchor primer. To confirm the direction of the shift in poly(A) site use, normalized intensities of long and short bands for each PCR were quantified and a long/short ratio determined and normalized to the No PMA control. The corresponding graphs represent mean ± SE from at least two independent experiments. P value <0.05 was considered significant, where ** = P ≤ 0.01; *** = P ≤ 0.001.
Figure 6
Figure 6
Effect of macrophage differentiation on the expression of C/P proteins in U937 cells. (A) Whole cell lysates from U937 cells treated with PMA for 0, 1, 6, 18 and 24 hours were separated by 10% SDS-PAGE and western blotting was performed for the indicated subunits of the C/P complex, with β-actin as the loading control. Each western blot (left panel) was performed in three biological replicates of the differentiation process and the quantified data is shown in the right panel. (B) Schematic of the mammalian core C/P complex. (C) Processing efficiency of MYC and ACTB transcripts for U937 cells. The bar graph shows the ratio of unspliced (US) RNA transcripts (detected by RT-qPCR with a primer pair upstream of the poly(A) site) to unprocessed RNA (detected by RT-qPCR with a primer pair that spans the poly(A) site) as shown in the schematic. The cDNA preparation was done using random hexamers.
Figure 7
Figure 7
Knockdown or overexpression of CstF64 in U937 cells alters macrophage differentiation. (A) Western blot analysis of C/P factors CstF64 and CstF64τ, macrophage-specific markers CD16, CD68, HLA-DRA, CD38 and the monocyte marker CD14 in U937 cells stably transfected with doxycycline-inducible control shRNA and two different CstF64 shRNAs (shRNA 2 and shRNA 3). Addition of 3 nM doxycycline for 3 days supplemented with 30 nM PMA one day prior to harvesting was done for all three cell lines. (B) Attachment assay (left panel) and changes in total number of PMA-treated cells (right panel) after knockdown of CstF64 compared to the shRNA control. Cells were treated with doxycycline, after which equal number of cells were treated with PMA for 24 h and then counted. The figures are representative of at least three independent experiments. (C) Changes in cellular complexity determined by FACs analysis of side (SSC) and forward scattering (FSC) values for 24h PMA-treated U937 cells stably expressing control shRNA and shRNA against CstF64. (D) Western blot analysis of C/P factors CstF64, CstF64τ and macrophage-specific markers CD68, HLA-DR, CD38 and the monocyte marker CD14 in U937 cells stably transfected with control overexpression vector (OE-control) and those overexpressing CstF64 (OE-CstF64) and treated with 3 nM doxycycline for 3 days prior to harvesting. No PMA treatment has been done. (E) Attachment assay (left panel) and changes in total number of cells (right panel) after overexpression of CstF64 compared to the OE-control. (F) Changes in cellular complexity or granularity determined by FACs analysis of side (SSC) and forward scattering (FSC) values for doxycycline-induced U937 cells transfected with OE-control or OE-CstF64. Percentage indicates a quantitation of cells that have altered granularity. For Fig. 7B and E, P value <0.05 was considered significant, where * = P ≤ 0.05; *** = P ≤ 0.001.
Figure 8
Figure 8
Knockdown or overexpression of CstF64 in U937 cells alters APA. Representative 1% agarose gel images for the 3′ RACE RT-PCR in U937 cells for shortened genes SERPINB1 (A) and PTCH1 (B), using gene specific primers at the last exon-exon junction and a common reverse anchor primer. In each subfigure, the effect of depletion (knockdown) of CstF64 and the effect of overexpression of CstF64 are indicated, using the same treatment protocols as described in Figure 7 . Normalized intensities of long and short bands for each PCR were quantified and a long/short ratio determined and normalized to the shRNA or OE control. The corresponding graphs (right) represents mean ± SE from at least two independent experiments. P value <0.05 was considered significant, where * = P ≤ 0.05; ** = P ≤ 0.01.

Similar articles

Cited by

References

    1. Shi C, Pamer EG. Monocyte recruitment during infection and inflammation. Nat Rev Immunol (2011) 11(11):762–74. doi: 10.1038/nri3070 - DOI - PMC - PubMed
    1. Italiani P, Boraschi D. From monocytes to M1/M2 macrophages: Phenotypical vs. functional differentiation. Front Immunol (2014) 5:514. doi: 10.3389/fimmu.2014.00514 - DOI - PMC - PubMed
    1. Mammana S, Fagone P, Cavalli E, Basile MS, Petralia MC, Nicoletti F, et al. . The role of macrophages in neuroinflammatory and neurodegenerative pathways of alzheimer's disease, amyotrophic lateral sclerosis, and multiple sclerosis: Pathogenetic cellular effectors and potential therapeutic targets. Int J Mol Sci (2018) 19(3). doi: 10.3390/ijms19030831 - DOI - PMC - PubMed
    1. Salmaninejad A, Valilou SF, Soltani A, Ahmadi S, Abarghan YJ, Rosengren RJ, et al. . Tumor-associated macrophages: role in cancer development and therapeutic implications. Cell Oncol (Dordr) (2019) 42(5):591–608. doi: 10.1007/s13402-019-00453-z - DOI - PubMed
    1. Gomez-Rial J, Rivero-Calle I, Salas A, Martinon-Torres F. Role of Monocytes/Macrophages in covid-19 pathogenesis: Implications for therapy. Infect Drug Resist (2020) 13:2485–93. doi: 10.2147/IDR.S258639 - DOI - PMC - PubMed

Publication types