. 2023 Sep;28(9):094801.
doi: 10.1117/1.JBO.28.9.094801. Epub 2023 Jan 10.

Assessment of the activity of secondary caries lesions with short-wavelength infrared, thermal, and optical coherence tomographic imaging

Affiliations

Assessment of the activity of secondary caries lesions with short-wavelength infrared, thermal, and optical coherence tomographic imaging

Nai-Yuan N Chang et al. J Biomed Opt. 2023 Sep.

Abstract

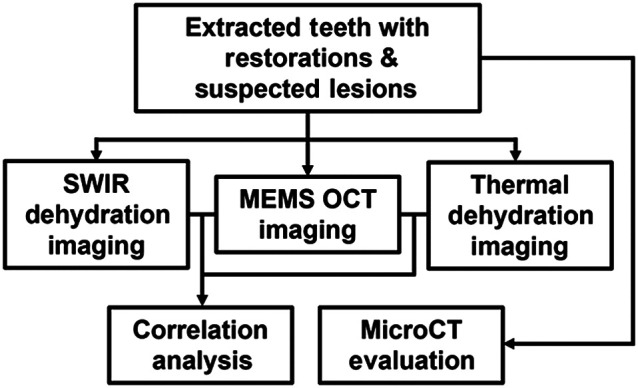
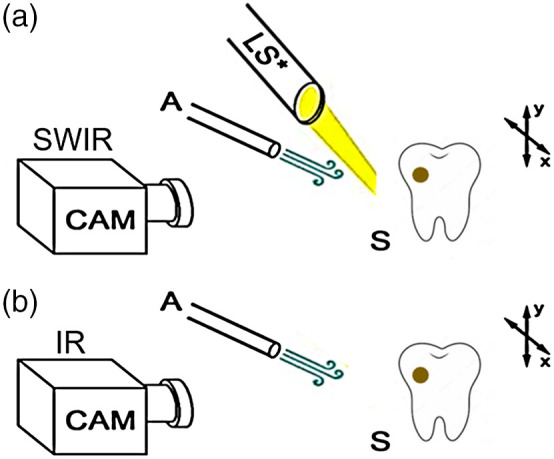
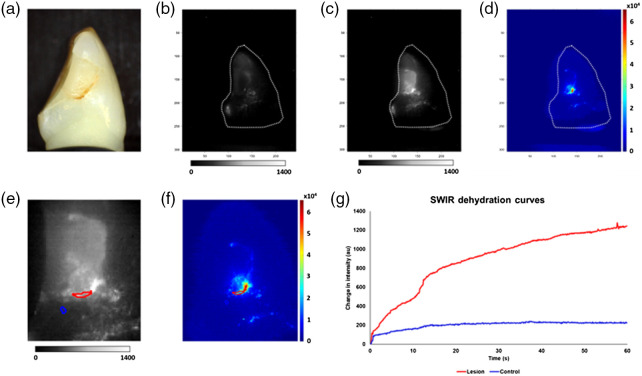
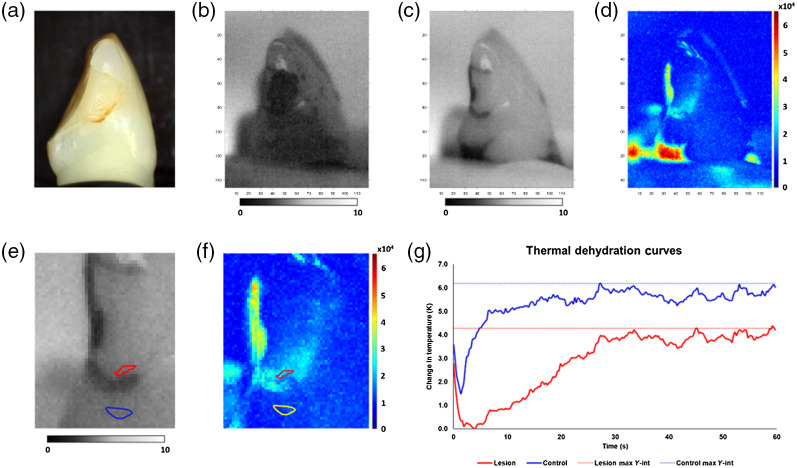
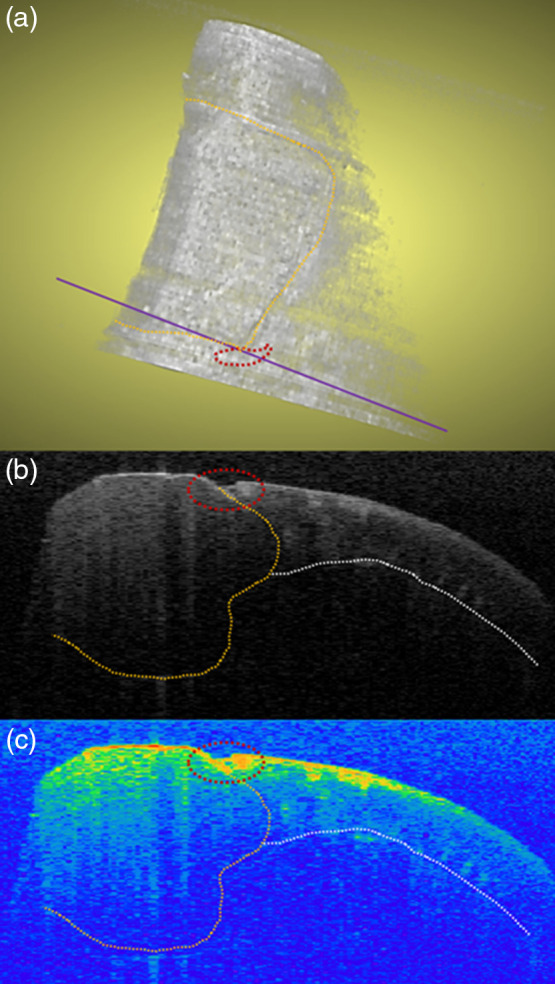
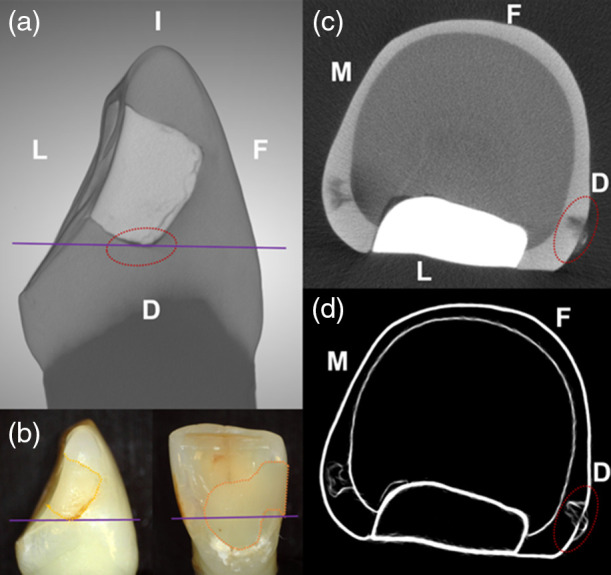
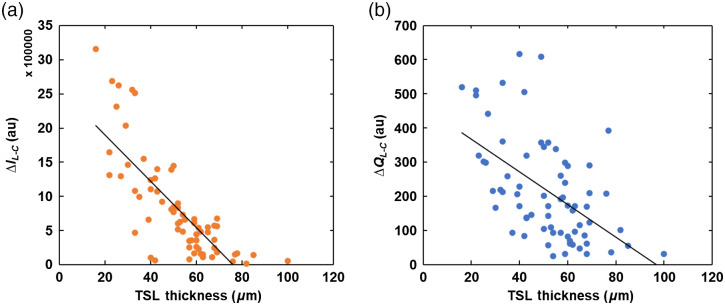
Significance: Leakage in the interfaces between restorative materials and tooth structure allows for fluid and bacterial acid infiltration, causing restoration failure due to secondary caries. Dentists spend more time replacing composite restorations than placing new ones. Previous in vitro and in vivo studies on enamel and root surfaces using shortwave-infrared (SWIR) and thermal imaging during dehydration with forced air have been promising for assessing lesion activity. Aim: We hypothesized that SWIR reflectance and thermal imaging methods can be used to monitor the activity of secondary caries lesions around composite restorations. The objective of this study was to employ these methods to measure the rate of fluid loss from lesions during dehydration with forced air to assess lesion activity. Approach: Sixty-three extracted human teeth with total of 109 suspected secondary lesions were examined using SWIR and thermal imaging during dehydration. The thickness of the highly mineralized transparent surface layer (TSL) at lesion interfaces indicative of lesion activity was measured by optical coherence tomography (OCT). Micro-computed tomography (MicroCT) was used to further confirm lesion severity and structure. OCT and MicroCT measurements of lesion structure, depth, and severity were correlated with fluid loss rates measured with SWIR reflectance and thermal imaging. Results: TSL thickness measured with OCT correlated with both SWIR reflectance and thermal measurements of rates of fluid loss ( p < 0.05 ). Increasing TSL thickness led to decreased permeability of lesions, potentially indicating full lesion arrest at TSL 70 μ m . SWIR performed better than thermal imaging for secondary lesion activity assessment, although both methods performed best on smooth surface lesions. Conclusions: Nondestructive SWIR reflectance and OCT imaging methods are promising for clinically monitoring the activity of secondary caries lesions.

Keywords: lesion activity; micro-computed tomography; optical coherence tomography; secondary caries lesions; shortwave-infrared imaging; thermal imaging.


Figures

Fig. 1
Fig. 1
Study workflow schematic.
Fig. 2
Fig. 2
(a) SWIR dehydration setup. (b) Thermal dehydration setup. LS, light source at 1950 nm; A, air nozzle output at 25 psi; F, filter; and S, ex vivo sample with suspected secondary lesion.
Fig. 3
Fig. 3
SWIR dehydration analysis results for one of the sample lesions. (a) Visible image. (b) SWIR image at the onset of dehydration. (c) SWIR image at the end of dehydration. (d) Integrated SWIR reflectance intensity change presented as a heat map. (e) SWIR image at the end of dehydration zoomed-in with ROIs (blue = control ROI, red = lesion ROI). (f) Heat map zoomed-in with ROIs. (g) SWIR dehydration curves for control ROI (blue) and lesion ROI (red).
Fig. 4
Fig. 4
Thermal dehydration analysis results for the same sample lesion shown in Fig. 3. (a) Visible image. (b) Thermal image at onset of dehydration. (c) Thermal image at the end of dehydration. (d) Integrated thermal emissivity change presented as a heat map. (e) Thermal image at the end of dehydration zoomed-in with ROIs (blue = control ROI, red = lesion ROI). (f) Heat map zoomed-in with ROIs (yellow = lesion ROI). (g) Thermal dehydration curves for control ROI (blue) and lesion ROI (red).
Fig. 5
Fig. 5
OCT scan of the same sample depicted in Fig. 3. (a) C-scan of the tooth surface with lesion. Orange-dotted area: composite restoration; red-dotted area: suspected secondary lesion area; purple line: location of two-dimensional (2D) B-scan. (b) 2D B-scan of secondary lesion. Orange-dotted line: interface between enamel and dentin; white-dotted line: dentinoenamel junction. (c) 2D B-scan of secondary lesion with threshold segmentation. Note the TSL enclosed by lesion.
Fig. 6
Fig. 6
MicroCT scan of the same sample depicted in Fig. 3. (a) 3D scan of the tooth sample oriented to the suspected lesion surface. Purple horizontal line indicates the position of the transverse sectional view. (b) Visible photos of the distal view (inset left) and the lingual view (inset right) of the same sample. Note that the composite restoration (dotted-orange line) extends more apically beyond the level of the transverse section (solid purple line). (c) Transverse slice of the scan at the level of suspected lesion at the purple line position. (d) Transverse slice of the scan at the level of lesion after median smoothing and Sobel-operator edge detection image filtering. Red-dotted oval depicts the suspected lesion area. Surfaces: D, distal; F, facial; I, incisal; L, lingual; and M, mesial.
Fig. 7
Fig. 7
Correlation plots. (a) Between TSL and SWIR dehydration measurement (ΔILC) (r=0.75, p<0.05). (b) Between TSL and ΔQLC (r=0.54, p<0.05). (c) Between TSL by OCT and SL by MicroCT (r=0.26, p<0.05).
Fig. 8
Fig. 8
Average SWIR dehydration measurement (ΔILC) for lesions with TSL<70  μm and for lesions with TSL70  μm (t=2.93, p<0.05).
Fig. 9
Fig. 9
Smooth surface lesions correlation plots between TSL by OCT and dehydration measurements. (a) Between TSL and ΔILC (r=0.78, p<0.05). (b) Between TSL and ΔQLC (r=0.54, p<0.05).

Similar articles

Cited by

References

    1. Fejerskov O., Kidd E., Dental Caries: The Disease and Its Clinical Management, Blackwell, Oxford: (2003).
    1. Pitts N., Detection, Assessment, Diagnosis and Monitoring of Caries, Karger Medical and Scientific Publishers; (2009).
    1. Almaz E. C., et al. , “Influence of stains on lesion contrast in the pits and fissures of tooth occlusal surfaces from 800–1600 nm,” Proc. SPIE 9692, 96920X (2016).PSISDG10.1117/12.2218663 - DOI - PMC - PubMed
    1. Zhu Y., Fried D., “Measurement of the depth of lesions on proximal surfaces with SWIR multispectral transillumination and reflectance imaging,” Diagnostics 12, 597 (2022).10.3390/diagnostics12030597 - DOI - PMC - PubMed
    1. Ng C., et al. , “Near-infrared imaging of demineralization on the occlusal surfaces of teeth without the interference of stains,” J. Biomed. Opt. 24, 036002 (2019).JBOPFO10.1117/1.JBO.24.3.036002 - DOI - PMC - PubMed

Publication types