. 2023 Jan 24:13:1098328.
doi: 10.3389/fonc.2023.1098328. eCollection 2023.

Spatial distribution of supratentorial diffuse gliomas: A retrospective study of 990 cases

Affiliations

Spatial distribution of supratentorial diffuse gliomas: A retrospective study of 990 cases

Gen Li et al. Front Oncol. .

Abstract

Background: Gliomas distribute unevenly in the supratentorial brain space. Many factors were linked to tumor locations. This study aims to describe a more detailed distributing pattern of these tumors with age and pathological factors concerned.

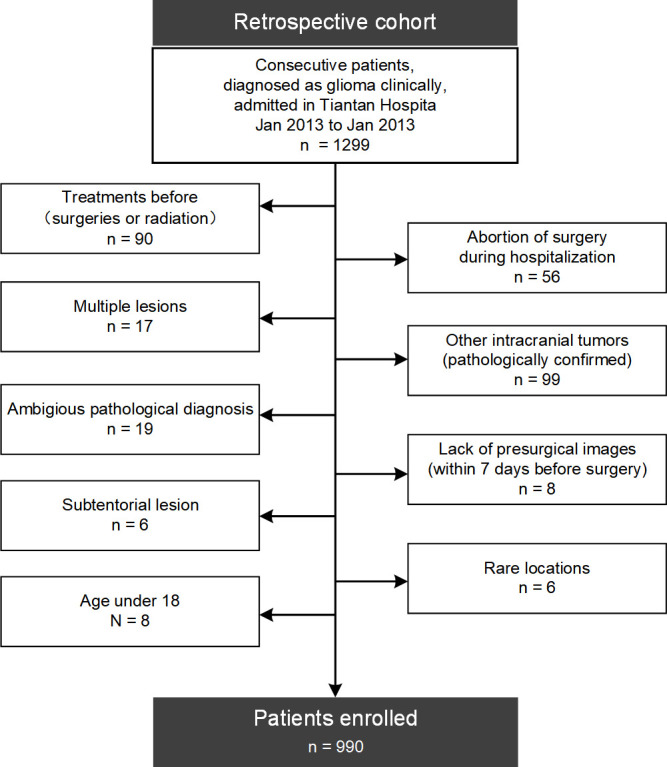
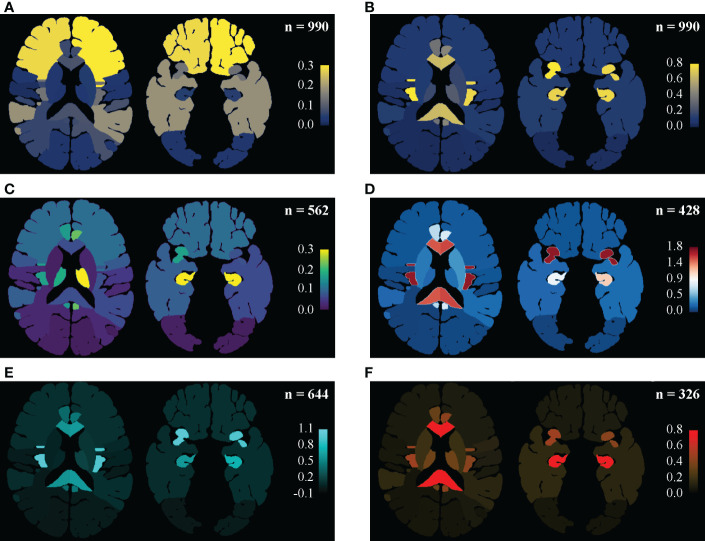
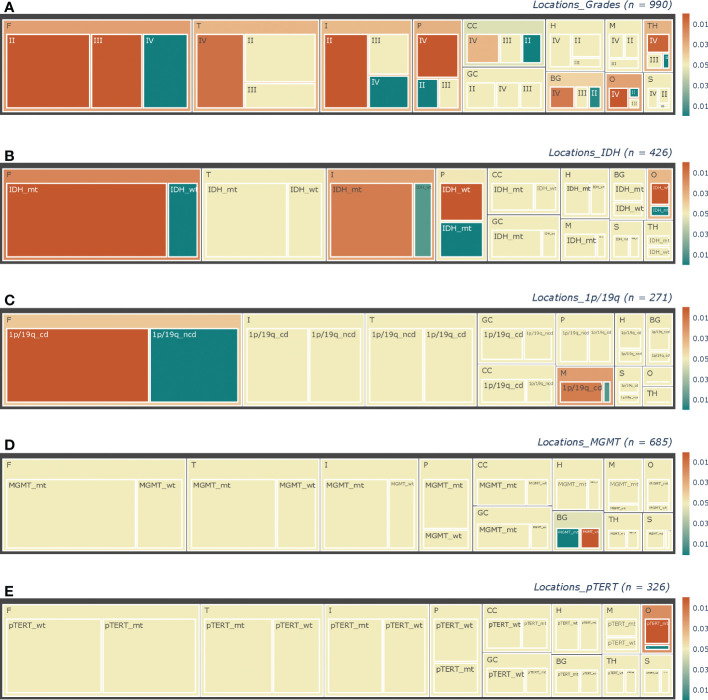
Methods: A consecutive series of 990 adult patients with newly-diagnosed supratentorial diffuse gliomas who underwent resection in Beijing Tiantan Hospital between January 2013 and January 2017 were retrospectively reviewed. For each patient, the anatomic locations were identified by the preoperative MRI, and the pathological subtypes were reviewed for histological grade and molecular status (if any) from his medical record. The MNI template was manually segmented to measure each anatomic location's volume, and its invaded ratio was then adjusted by the volume to calculate the frequency density. Factors of age and pathological subtypes were also compared among locations.

Results: The insulae, hippocampi, and corpus callosum were locations of the densest frequencies. The frequency density decreased from the anterior to posterior (frontal - motor region - sensory region - parietal - occipital), while the grade (p < 0.0001) and the proportion of IDH-wt (p < 0.0001) increased. More tumors invading the right basal ganglion were MGMT-mt (p = 0.0007), and more of those invading the left frontal were TERT-wt (p = 0.0256). Age varied among locations and pathological subtypes.

Conclusions: This study demonstrated more detailed spatial disproportions of supratentorial gliomas. There are potential interactions among age, pathological subtypes, and tumor locations.

Keywords: WHO grade; age; diffuse gliomas; molecular status; spatial disproportion; supratentorial.


Conflict of interest statement

The authors declare that the research was conducted in the absence of any commercial or financial relationships that could be construed as a potential conflict of interest.

Figures

Figure 1
Figure 1
Flow diagram of patients’ enrollment. 990 adult patients with newly-diagnosed supratentorial diffuse gliomas were finally enrolled from a retrospective cohort of 1299 patients in this study.
Figure 2
Figure 2
Regine-based lesion map. Distribution pattern of gliomas were illustrated as an entity and in subgroups. (A, B) In the entirety of the main set, the distributing pattern is shown in (A), and the frequence density (per 105 mm3) are shown in (B): the frontal and temporal lobes are vulnerable mainly for their remarkable portions of the supratentorial space, while the insulae, hippocampi, corpus callosum and gyri cinguli are real locations of predilection, isolating the effect of volume. Setting the precentral and postcentral gyri as landmarks, decreases in frequency density from the frontal to the occipital was then highlighted. (C) Frequency density mapping in sub-groups of the Localized tumors. The thalami (especially the lefr one) stood in this subgroup. (D) Frequency density mapping in sub-groups of the Multi-regional tumors. The insulae were highlighted. (E) Frequency density mapping in LGGs. Similar disproportion as in the entirety might be due to LGGs predominance. (F) Frequency density mapping in GBMs showed that the corpus callosum and hippocampi were more vulnerable to GBMs than the insula.
Figure 3
Figure 3
Tree-maps of the pathological constitutions. Constitutions of (A) Grade, (B) IDH status, (C) 1p/19q status, (D) MGMT status, and (E) pTERT in each anatomic area are respectively shown in diagrams. The lateral factors were not concerned here. Each block represents a subgroup in corresponding hierarchies, with block size showing the ratio of its sample size to the counterpart. The total sample sizes in each chart are noted at the upper right as “(n =)”. As shown in the color bars at the right parts, the color of blocks represented the p-value revealed by chi-square tests, with the yellow color representing those insignificant results of p > = 0.05, while the red and green colors mean “greater” and “less” separately. In addition, the deeper the color is, the smaller the p-value will be. F, Frontal lobes; T, Temporal lobes; P, Parietal lobes; O, Occipital lobes; CC, Corpora Callosa; BG, Basal Ganglia; TH, Thalami; M, Motor regions; S, Sensory regions; H, Hippocampi; GC, Gyri Cinguli; IDH_mt, IDH_mutant type; IDH_wt, IDH_wild type; 1p/19q_cd, 1p/19q_codeleted; 1p/19q_ncd, 1p/19q_nodeleted; MGMT_wt, MGMT_methylated; MGMT_wt, MGMT_wild type; pTERT_mt, pTERT_ mutant type; pTERT_wt, pTERT_ wild type.

Similar articles

References

    1. Ostrom QT, Patil N, Cioffi G, Waite K, Kruchko C, Barnholtz-Sloan JS. Cbtrus statistical report: Primary brain and other central nervous system tumors diagnosed in the united states in 2013-2017. Neuro-oncology (2020) 22(12 Suppl 2):iv1–iv96. doi: 10.1093/neuonc/noaa200 - DOI - PMC - PubMed
    1. Louis DN, Perry A, Wesseling P, Brat DJ, Cree IA, Figarella-Branger D, et al. . The 2021 who classification of tumors of the central nervous system: A summary. Neuro-oncology (2021) 23(8):1231–51. doi: 10.1093/neuonc/noab106 - DOI - PMC - PubMed
    1. Danussi C, Bose P, Parthasarathy PT, Silberman PC, Van Arnam JS, Vitucci M, et al. . Atrx inactivation drives disease-defining phenotypes in glioma cells of origin through global epigenomic remodeling. Nat Commun (2018) 9(1):1057. doi: 10.1038/s41467-018-03476-6 - DOI - PMC - PubMed
    1. Cahill D, Turcan S. Origin of gliomas. Semin Neurol (2018) 38(1):5–10. doi: 10.1055/s-0037-1620238 - DOI - PubMed
    1. Azzarelli R, Simons BD, Philpott A. The developmental origin of brain tumours: A cellular and molecular framework. Development (2018) 145(10). doi: 10.1242/dev.162693 - DOI - PMC - PubMed