

Gene expression profiling of circulating tumor cells captured by MicroCavity Array is superior to enumeration in demonstrating therapy response in patients with newly diagnosed advanced and locally advanced non-small cell lung cancer
- PMID: 36762061
- PMCID: PMC9903084
- DOI: 10.21037/tlcr-22-314
Gene expression profiling of circulating tumor cells captured by MicroCavity Array is superior to enumeration in demonstrating therapy response in patients with newly diagnosed advanced and locally advanced non-small cell lung cancer
Abstract
Background: Circulating tumor cells (CTCs) are a promising non-invasive tool for monitoring therapy response. The only Food and Drug Administration (FDA)-approved test is limited to enumeration of epithelial CTC without further characterization and is not approved for the management of non-small cell lung cancer (NSCLC). Here we use a MicroCavity Array (MCA) system to capture CTC agnostic of epithelial markers for further molecular testing in NSCLC.
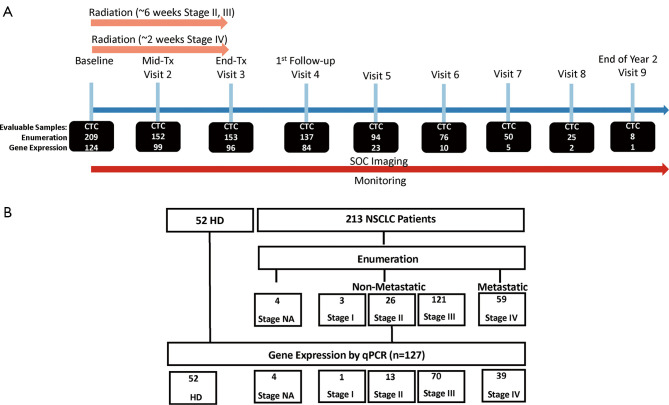
Methods: CTCs were enumerated by fluorescent microscopy as longitudinal sampling throughout disease management from 213 NSCLC patients. CTC-enriched samples from a subset of 127 patients were interrogated for gene expression by reverse transcription polymerase chain reaction (RT-PCR) using a customized pre-selected panel of 20 genes.
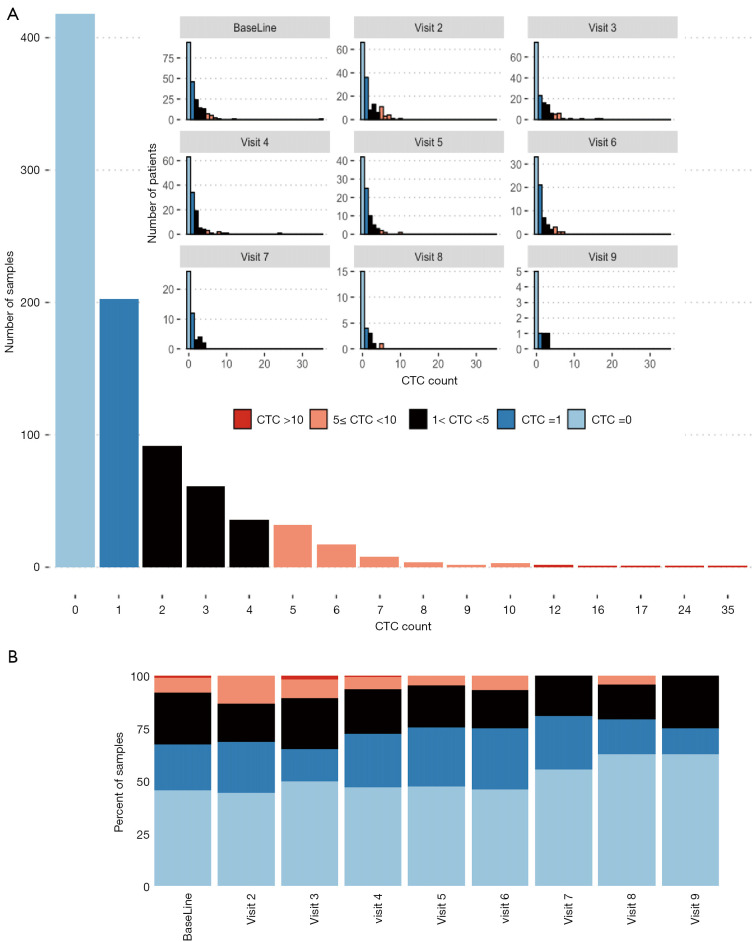
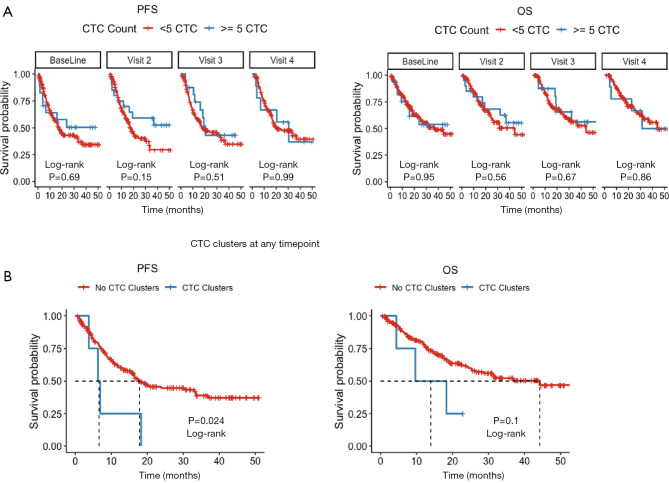
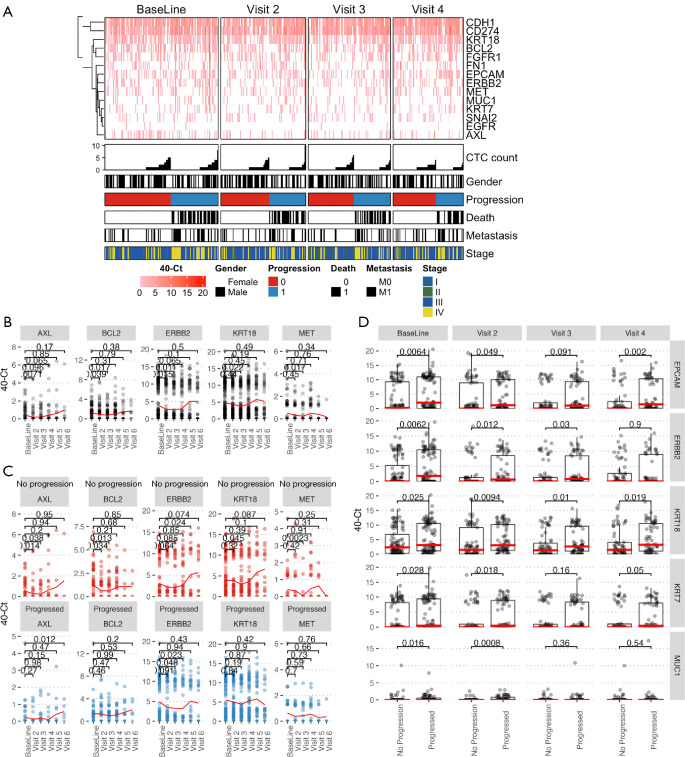
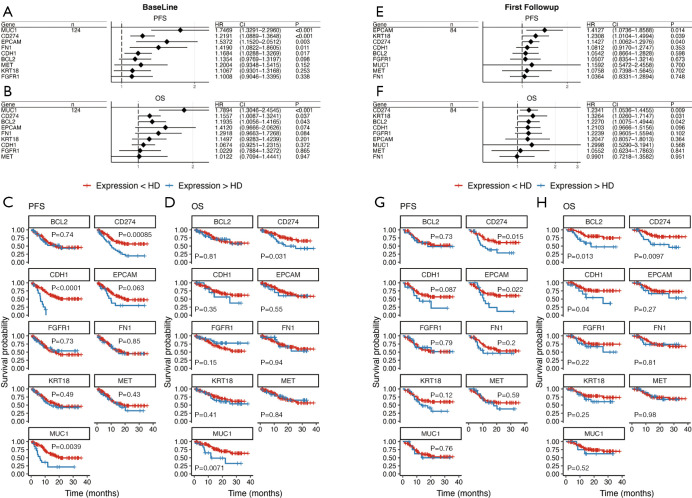
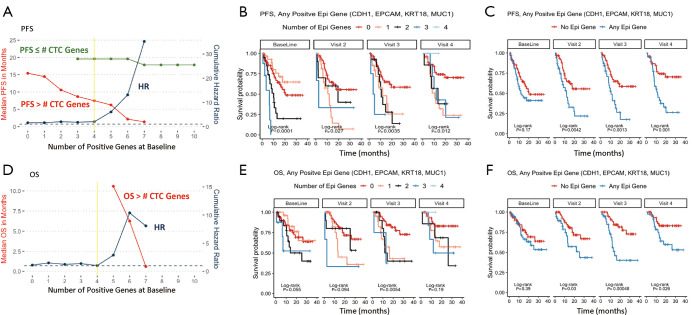
Results: At least 1 CTC was detected by enumeration in 53.8% of samples. Most patients had fewer than 5 CTCs (91%) and the highest observed count was 35 CTCs. Enumeration of single CTCs was not prognostic, although detection of CTC clusters at any time point was associated with increased risk of progression [hazard ratio (HR) 3.00, 95% confidence interval (CI): 1.1-8.2, P=0.0318]. In contrast, 124 (97.6%) patients with samples interrogated for gene expression had at least 1 gene detectable in at least 1 sample, and 101 (79.5%) had at least one elevated epithelial gene in at least one timepoint. High expression of BCL2, CD274 [programmed death-ligand 1 (PD-L1)], CDH1, EPCAM, FGFR1, FN1, KRT18, MET and MUC1 were associated with poor prognosis. Patients with CTCs positive for at least 3 epithelial genes at baseline all progressed within 10 months (HR 8.2, P<0.001, 95% CI: 3.2-21.1). BCL2, CD274 (PD-L1), EPCAM and MUC1 remained significant independent prognostic factors in multivariate, time-dependent analyses of progression and death.
Conclusions: The selective profile of CTC genes and identification of CTC clusters better correlated with prognosis than enumeration of enriched CTC in NSCLC patients in this study.
Keywords: Blood; biomarkers, tumor; liquid biopsy; neoplastic cells, circulating.
2023 Translational Lung Cancer Research. All rights reserved.
Conflict of interest statement
Conflicts of Interest: All authors have completed the ICMJE uniform disclosure form (available at https://tlcr.amegroups.com/article/view/10.21037/tlcr-22-314/coif). SHL serves as an unpaid editorial board member of Translational Lung Cancer Research from October 2021 to September 2023. All authors report that Hitachi Chemical Company of Tokyo Japan (currently Showa Denko Materials Co., Ltd.) and The University of Texas MD Anderson Cancer Center entered into a Strategic Alliance Agreement to develop the MCA instrument and conduct the clinical trial that produced data reported in this manuscript. JMR serves as a member of the Scientific Advisory Board for Angle plc. SHL reports grants from STCube Pharmaceuticals, Beyond Spring Pharmaceuticals, Nektar Therapeutics, other support from Creatv Microtech, AstraZeneca Inc., XRAD Therapeutics, non-financial support from Scenexo, Inc., outside the submitted work. The authors have no other conflicts of interest to declare.
Figures
Similar articles
-
Enumeration and molecular characterization of circulating tumor cells enriched by microcavity array from stage III non-small cell lung cancer patients.Transl Lung Cancer Res. 2020 Oct;9(5):1974-1985. doi: 10.21037/tlcr-20-841. Transl Lung Cancer Res. 2020. PMID: 33209617 Free PMC article.
-
Size-based isolation of circulating tumor cells in lung cancer patients using a microcavity array system.PLoS One. 2013 Jun 28;8(6):e67466. doi: 10.1371/journal.pone.0067466. Print 2013. PLoS One. 2013. PMID: 23840710 Free PMC article. Clinical Trial.
-
Post-therapeutic circulating tumor cell-associated white blood cell clusters predict poor survival in patients with advanced driver gene-negative non-small cell lung cancer.BMC Cancer. 2023 Jun 22;23(1):578. doi: 10.1186/s12885-023-10985-1. BMC Cancer. 2023. PMID: 37349714 Free PMC article.
-
Prognostic significance of programmed cell death-ligand 1 expression on circulating tumor cells in various cancers: A systematic review and meta-analysis.Cancer Med. 2021 Oct;10(20):7021-7039. doi: 10.1002/cam4.4236. Epub 2021 Aug 23. Cancer Med. 2021. PMID: 34423578 Free PMC article.
-
Enumeration and molecular characterization of circulating tumor cells as an innovative tool for companion diagnostics in breast cancer.Expert Rev Mol Diagn. 2020 Aug;20(8):815-828. doi: 10.1080/14737159.2020.1784009. Epub 2020 Jun 30. Expert Rev Mol Diagn. 2020. PMID: 32546017 Review.
Cited by
-
Utilization of Circulating Tumor Cells in the Management of Solid Tumors.J Pers Med. 2023 Apr 20;13(4):694. doi: 10.3390/jpm13040694. J Pers Med. 2023. PMID: 37109080 Free PMC article. Review.
-
Phenotypic Plasticity in Circulating Tumor Cells Is Associated with Poor Response to Therapy in Metastatic Breast Cancer Patients.Cancers (Basel). 2023 Mar 6;15(5):1616. doi: 10.3390/cancers15051616. Cancers (Basel). 2023. PMID: 36900406 Free PMC article.
-
Advances in diagnosis and prediction for aggression of pure solid T1 lung cancer.Precis Clin Med. 2023 Aug 17;6(3):pbad020. doi: 10.1093/pcmedi/pbad020. eCollection 2023 Sep. Precis Clin Med. 2023. PMID: 38025970 Free PMC article.
-
Portable Aptasensor Based on Parallel Rolling Circle Amplification for Tumor-Derived Exosomes Liquid Biopsy.Adv Sci (Weinh). 2024 Aug;11(32):e2403371. doi: 10.1002/advs.202403371. Epub 2024 Jun 26. Adv Sci (Weinh). 2024. PMID: 38923850 Free PMC article.
-
Enhanced CT-based radiomics model to predict natural killer cell infiltration and clinical prognosis in non-small cell lung cancer.Front Immunol. 2024 Jan 12;14:1334886. doi: 10.3389/fimmu.2023.1334886. eCollection 2023. Front Immunol. 2024. PMID: 38283362 Free PMC article.
References
-
- Facts & Figures 2022. In: American Cancer Society. Bethesda, MD. 2022. Available online: https://seer.cancer.gov/statfacts/html/lungb.html. Accessed 4/21/2022.
LinkOut - more resources
Full Text Sources
Research Materials
Miscellaneous