. 2023 Jan 25:14:1102277.
doi: 10.3389/fphar.2023.1102277. eCollection 2023.

Transcription factor ZBTB42 is a novel prognostic factor associated with immune cell infiltration in glioma

Affiliations

Transcription factor ZBTB42 is a novel prognostic factor associated with immune cell infiltration in glioma

Yanwen Li et al. Front Pharmacol. .

Abstract

Background: ZBTB42 is a transcription factor that belongs to the ZBTB transcript factor family and plays an important role in skeletal muscle development. Dysregulation of ZBTB42 expression can lead to a variety of diseases. However, the function of ZBTB42 in glioma development has not been studied by now. Methods: We analyzed the expression of ZBTB42 in LGG and GBM via the The Cancer Genome Atlas CGA and Chinese Glioma Genome Atlas database. Gene Ontology, KEGG, and GSVA analyses were performed to illustrate ZBTB42-related pathways. ESTIMATE and CIBERSORT were applied to calculate the immune score and immune cell proportion in glioma. One-class logistic regression OCLR algorithm was used to study the stemness of glioma. Multivariate Cox analysis was employed to detect the prognostic value of five ZBTB42-related genes. Results: Our results show that ZBTB42 is highly expressed in glioma and may be a promising prognostic factor for Low Grade Glioma and GBM. In addition, ZBTB42 is related to immune cell infiltration and may play a role in the immune suppression microenvironment. What's more, ZBTB42 is correlated with stem cell markers and positively associated with glioma stemness. Finally, a five genes nomogram based on ZBTB42 was constructed and has an effective prognosis prediction ability. Conclusion: We identify that ZBTB42 is a prognostic biomarker for Low Grade Glioma and GBM and its function is related to the suppressive tumor microenvironment and stemness of glioma.

Keywords: ZBTB42; glioma; immune suppression; microenvironment; stemness.


Conflict of interest statement

The authors declare that the research was conducted in the absence of any commercial or financial relationships that could be construed as a potential conflict of interest.

Figures
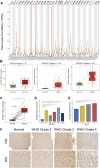
FIGURE 1
FIGURE 1
ZBTB42 expression profile in pan-cancer and glioma. (A) ZBTB42 mRNA expression of pan-cancer in TCGA dataset. (B) ZBTB42 is highly expressed in glioma compared with normal tissue in three different GEO datasets. (C) ZBTB42 mRNA expression in normal brain and glioma tissues. (D) ZBTB42 mRNA expression in human glia cell line and different glioma cell lines. (E) Quantification of ZBTB42 IHC staining between different WHO grades of gliomas and normal tissues (n = 12). (F) Immunohistochemistry staining of ZBTB42 in normal brain and glioma samples (n = 12). *p < 0.05; **p < 0.01; ***p < 0.001; ****p < 0.0001.
FIGURE 2
FIGURE 2
ZBTB42 expression in different subgroups of glioma and correlated with tumor progression. (A) Expression of ZBTB42 in clinical subgroups of glioma. (B) Optimal cut point determination in glioma, LGG, and GBM. (C) High expression of ZBTB42 leads to poor prognosis in both LGG and GBM. *p < 0.05; **p < 0.01; ***p < 0.001; ****p < 0.0001.
FIGURE 3
FIGURE 3
The copy number variations, mutation and epigenetic modification of ZBTB42 (A) Amplification state of ZBTB42 in glioma. (B) Copy number variations (CNVs) changes of ZBTB42. (C,D) Methylation of ZBTB42 promoter and ZBTB42 body in different WHO grades glioma. (E,F) Methylation of ZBTB42 promoter and ZBTB42 body in 1p19q codel and 1p19q non-codel subgroups. (G,H) Methylation of ZBTB42 promoter and ZBTB42 body in IDH wild type and mutant subgroups. *p < 0.05; **p < 0.01; ***p < 0.001; ****p < 0.0001.
FIGURE 4
FIGURE 4
Pathway enrichment analysis of dysregulation of ZBTB42 in TCGA cohort. (A,B) Biological process analysis on upregulated genes (A) and downregulated genes (B) between the ZBTB42 high expression group and low expression group. (C) The pathways related to upregulated genes and downregulated genes by KEGG enrichment analysis. (D) GSVA analysis on Reactome gene set between glioma patients with high ZBTB42 expression and low expression. (E) GSVA analysis on Hallmark gene set between glioma patients with high ZBTB42 expression and low expression. (F) Protein-protein interaction network based on ZBTB42-related genes by STRING database. The lines between genes represent protein-protein associations and different colors represent how these relationships were validated. The green line represents two genes are neighborhood genes; The pink line represents the relationship that has been experimentally determined by existing papers. The black line represents two genes that are co-expressed. The purple line represents protein homology.
FIGURE 5
FIGURE 5
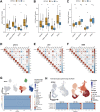
High ZBTB42 expression group is associated with immune suppression in glioma. (A) The fraction of 22 immune cell infiltration in high ZBTB42 expression group and low expression group of gliomas. (B) Immune-related signature scores between high ZBTB42 expression group and low expression group of gliomas by ssGSEA analysis. (C,D) Stromal score, Immune score, and ESTIMATE score, and tumor purity of LGG (C) and GBM (D) in the TCGA dataset. (E–H) Map of ZBTB42 correlation with cytokine genes, chemokine genes, and immune checkpoint genes in LGG (E, G) and GBM (F, H). *p < 0.05; **p < 0.01; ***p < 0.001.
FIGURE 6
FIGURE 6
High ZBTB42 expression is related to the stronger tumor-stemness feature of glioma. (A,B) mDNAsi, EREG.mDNAsi, DMPsi, and ENHsi of high ZBTB42 expression and low expression group in glioma (A), LGG (B) and GBM (C). (D–F) Map of ZBTB42 correlation with stemness characteristic genes in glioma (D), LGG (E), and GBM (F). (G,H) ZBTB42 was expressed in stem-like and proliferation stem-like cell subtypes analyzed by single cell sequencing data. *p < 0.05; **p < 0.01; ***p < 0.001.
FIGURE 7
FIGURE 7
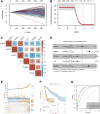
Construction of a prognostic model with ZBTB42-related genes in LGG. (A) LASSO coefficients profiles of DEG between high ZBTB42 expression group and low expression group in LGG. (B) LASSO regression with cross-validation obtained optimal prognostic-related genes in LGG. (C) Map of ZBTB42 correlation with prognostic related genes in LGG. (D) Multivariate Cox analysis of KCNIP3, IGFBP2, CRTAC1, IL15, and SAMD9L with clinical outcomes for LGG. (E) The risk score, survival time, and expression distribution of the five genes in the LGG cohort. (F) Kaplan-Meier survival analysis of high-risk model and low-risk model. (G) Prediction sensitivity validation of the prognostic model by receiver operating characteristic (ROC) curve analysis in 1, 3, and 5 years for LGG patients. *p < 0.05; **p < 0.01; ***p < 0.001.

References

    1. Akkari L., Bowman R. L., Tessier J., Klemm F., Handgraaf S. M., De Groot M., et al. (2020). Dynamic changes in glioma macrophage populations after radiotherapy reveal CSF-1R inhibition as a strategy to overcome resistance. Sci. Transl. Med. 12, eaaw7843. 10.1126/scitranslmed.aaw7843 - DOI - PubMed
    1. Aoki K., Natsume A. (2019). Overview of DNA methylation in adult diffuse gliomas. Brain Tumor Pathol. 36, 84–91. 10.1007/s10014-019-00339-w - DOI - PubMed
    1. Choi W. I., Kim M. Y., Jeon B. N., Koh D. I., Yun C. O., Li Y., et al. (2014). Role of promyelocytic leukemia zinc finger (PLZF) in cell proliferation and cyclin-dependent kinase inhibitor 1A (p21WAF/CDKN1A) gene repression. J. Biol. Chem. 289, 18625–18640. 10.1074/jbc.M113.538751 - DOI - PMC - PubMed
    1. Ehrlich M. (2019). DNA hypermethylation in disease: Mechanisms and clinical relevance. Epigenetics 14, 1141–1163. 10.1080/15592294.2019.1638701 - DOI - PMC - PubMed
    1. Fleetwood A. J., Dinh H., Cook A. D., Hertzog P. J., Hamilton J. A. (2009). GM-CSF- and M-CSF-dependent macrophage phenotypes display differential dependence on type I interferon signaling. J. Leukoc. Biol. 86, 411–421. 10.1189/jlb.1108702 - DOI - PubMed