. 2022 Jul 18:1113:1-110.
doi: 10.3897/zookeys.1113.82172. eCollection 2022.

Benthic megafauna of the western Clarion-Clipperton Zone, Pacific Ocean

Affiliations

Benthic megafauna of the western Clarion-Clipperton Zone, Pacific Ocean

Guadalupe Bribiesca-Contreras et al. Zookeys. .

Abstract

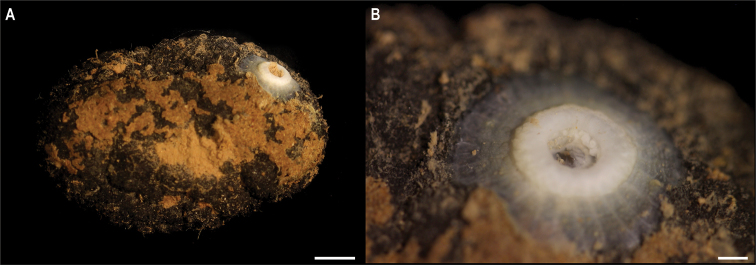
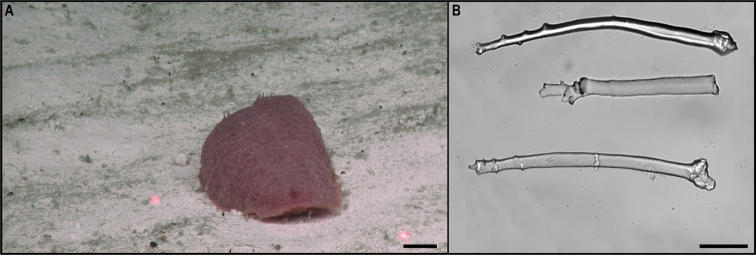
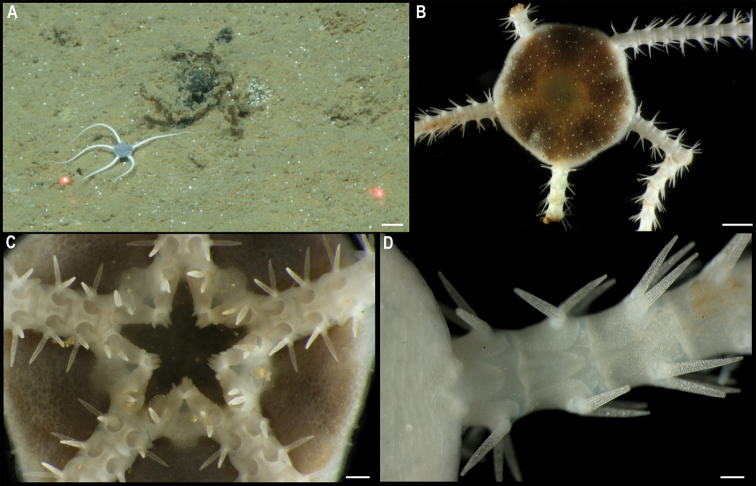
There is a growing interest in the exploitation of deep-sea mineral deposits, particularly on the abyssal seafloor of the central Pacific Clarion-Clipperton Zone (CCZ), which is rich in polymetallic nodules. In order to effectively manage potential exploitation activities, a thorough understanding of the biodiversity, community structure, species ranges, connectivity, and ecosystem functions across a range of scales is needed. The benthic megafauna plays an important role in the functioning of deep-sea ecosystems and represents an important component of the biodiversity. While megafaunal surveys using video and still images have provided insight into CCZ biodiversity, the collection of faunal samples is needed to confirm species identifications to accurately estimate species richness and species ranges, but faunal collections are very rarely carried out. Using a Remotely Operated Vehicle, 55 specimens of benthic megafauna were collected from seamounts and abyssal plains in three Areas of Particular Environmental Interest (APEI 1, APEI 4, and APEI 7) at 3100-5100 m depth in the western CCZ. Using both morphological and molecular evidence, 48 different morphotypes belonging to five phyla were found, only nine referrable to known species, and 39 species potentially new to science. This work highlights the need for detailed taxonomic studies incorporating genetic data, not only within the CCZ, but in other bathyal, abyssal, and hadal regions, as representative genetic reference libraries that could facilitate the generation of species inventories.

Keywords: Biogeography; DNA barcoding; DNA taxonomy; deep-sea mining; megafauna; polymetallic nodules.


Figures

Figure 1.
Figure 1.
Map of the Clarion-Clipperton Zone (top left) indicating the nine Areas of Particular Environmental Interest (APEIs) in red, exploration areas in green, and reserved areas in orange. Shapefiles were sourced from https://www.naturalearthdata.com/downloads/10m-physical-vectors/10m-bathymetry/, and https://www.isa.org.jm/minerals/maps. Detailed maps of the study areas: APEIs 1 (top right), 4 (bottom left), and 7 (bottom right) show bathymetry from satellite values for the entire APEI, and multibeam values obtained during the DeepCCZ expedition. Sites, and specific geoform, where megafauna samples were collected are indicated as yellow stars in abyssal plains, green triangles in seamounts, and pink hexagons in seamount slopes.
Figure 2.
Figure 2.
Rooted Bayesian phylogeny for the family Aphroditidae. COI-only BEAST median consensus tree with posterior probability (PP) and bootstrap (BS) values indicated for each node. Only values of PP > 0.70 and BS > 50 are shown, with values of PP > 0.95 and BS > 90 indicated with a circle. Nodes not recovered on the RAxML tree are indicated with a hyphen. Sequences generated in this study are highlighted in violet.
Figure 3.
Figure 3.
Laetmonice stet. CCZ_060 A in situ image B ventral surface C elytra on dorsal surface D harpoon-shaped chaeta E dorsal surface F neurochaeta with fringed tips G notochaetal spine shafts. Scale bars: 2cm (A); 0.5 cm (B, E). Image attribution: Durden and Smith (A), Wiklund, Durden, Drennan, and McQuaid (B, E), Drennan (C, D, F, G).
Figure 4.
Figure 4.
Rooted Bayesian phylogeny of Scalpellomorpha. Concatenated (18S, and COI) BEAST median consensus tree with posterior probability (PP) and bootstrap (BS) values indicated. Only values of PP > 0.70 and BS > 50 are shown, with values of PP > 0.95 and BS > 90 indicated with a circle. Nodes not recovered on the RAxML tree are indicated with a hyphen. Sequences generated in this study are highlighted in violet.
Figure 5.
Figure 5.
Trianguloscalpellumgigas (Hoek, 1883). Specimen CCZ_074: A in situ photograph, attached to a glass sponge stalk B left C and right lateral views. Scale bars: 5 cm (A); 1 mm (B, C). Image attribution: Durden and Smith (A), Hosie (B, C). Arrows indicate position of T.gigas (specimen CCZ_074; lower, yellow) and Catherinumcf.albatrossianum (specimen CCZ_073; upper, green).
Figure 6.
Figure 6.
Catherinumcf.albatrossianum (Pilsbry, 1907). Specimen CCZ_073: A left B right lateral views. Scale bars: 2 mm. Image attribution: Hosie (A, B).
Figure 7.
Figure 7.
Catherinumcf.novaezelandiae (Hoek, 1883). Specimen CCZ_185: A in situ photograph B right C left lateral views. Scale bars: 1 cm (A); 1 mm (B, C). Image attribution: Durden and Smith (A), Hosie (B, C).
Figure 8.
Figure 8.
Rooted Bayesian phylogeny of Actiniaria. Concatenated (12S, 16S, 18S, 28S, COI, and COX3) BEAST median consensus tree with posterior probability (PP) and bootstrap (BS) values indicated. Only values of PP > 0.70 and BS > 50 are shown, with values of PP > 0.95 and BS > 90 indicated with a circle. Nodes not recovered on the RAxML tree are indicated with a hyphen. Sequences generated in this study are highlighted in violet.
Figure 9.
Figure 9.
Metridioidea stet. CCZ_072 A oral B lateral views. Scale bars: 5 mm (A, B). Image attribution: Wiklund, Durden, Drennan, and McQuaid (A, B).
Figure 10.
Figure 10.
Metridioidea stet. CCZ_154 A in situ image B specimen before preservation. Scale bars: A, B 1 cm. Image attribution: Durden and Smith (A), Wiklund, Durden, Drennan, and McQuaid (B).
Figure 11.
Figure 11.
Metridioidea stet. CCZ_164 A in situ image of specimen CCZ_164 B detail of oral disc C lateral view of specimen. Scale bars: 2 cm (A); 2 mm (B); 5 mm (C). Image attribution: Durden and Smith (A), Wiklund, Durden, Drennan, and McQuaid (B, C).
Figure 12.
Figure 12.
Actinostolidae stet. CCZ_183 A specimen attached to nodule B close-up of specimen. Scale bars: 1 cm (A), 2 mm (B). Image attribution: Wiklund, Durden, Drennan, and McQuaid (A, B).
Figure 13.
Figure 13.
Actinostolidae stet. CCZ_202 A in situ image B detail of specimen. Scale bars: 1 cm (A); 1 mm (B). Image attributions: Durden and Smith (A), Wiklund, Durden, Drennan, and McQuaid (B).
Figure 14.
Figure 14.
Fungiacyathus (Fungiacyathus) cf. fragilis Sars, 1872. Specimen CCZ_107: A in situ image B dorsal view of live specimen C bleached skeleton. Scale bars: 1 cm (A); 3 mm (B, C). Image attribution: Durden and Smith (A); Wiklund, Durden, Drennan, and McQuaid (B); Bribiesca-Contreras (C).
Figure 15.
Figure 15.
Rooted Bayesian phylogeny of Octocorallia. Concatenated (16S, COI, mtMutS, NADH2) median consensus BEAST tree with posterior probability (PP) and bootstrap (BS) values indicated. Only values of PP > 0.70 and BS > 50 are shown, with values of PP > 0.95 and BS > 90 indicated with a circle. Nodes not recovered on the RAxML tree are indicated with a hyphen. Sequences generated in this study are highlighted in violet.
Figure 16.
Figure 16.
Chrysogorgia sp. CCZ_112 A, B in situ images of colony C closed polyp on live specimen D opened polyp on live specimen showing light orange colouration E closed polyp of preserved specimen. Scale bars: 2 cm (A); 0.5 mm (C–E). Image attribution: Durden and Smith (A, B); Wiklund, Durden, Drennan, and McQuaid (C, D); Bribiesca-Contreras (E).
Figure 17.
Figure 17.
Mopseidae sp. CCZ_088 A in situ image B whole colony attached to a nodule C detail of polyps before preservation. Scale bars: 5 cm (A); 2 cm (B); 5 mm (C). Image attribution: Durden and Smith (A); Wiklund, Durden, Drennan, and McQuaid (B, C).
Figure 18.
Figure 18.
Calyptrophoradistolos Cairns, 2018. Specimen CCZ_132: A in situ image B whole colony C detail of polyps before preservation. Scale bars: 2 cm (A, B); 5 mm (C). Image attribution: Durden and Smith (A); Wiklund, Durden, Drennan, and McQuaid (B, C).
Figure 19.
Figure 19.
Protoptilum stet. CCZ_068 A in situ image B whole colony C detail of polyps before preservation. Scale bars: 1 cm (A); 5 mm (B); 2 mm (C). Image attribution: Durden and Smith (A); Wiklund, Durden, Drennan, and McQuaid (B, C).
Figure 20.
Figure 20.
Rooted Bayesian phylogeny of Ceriantharia. Concatenated (12S, 16S, 18S, 28S, and COI) median consensus BEAST tree with posterior probability (PP) and bootstrap (BS) values indicated. Only values of PP > 0.70 and BS > 50 are shown, with values of PP > 0.95 and BS > 90 indicated with a circle. Nodes not recovered on the RAxML tree are indicated with a hyphen. Sequences generated in this study are highlighted in violet.
Figure 21.
Figure 21.
Spirularia stet. CCZ_067 A in situ image B specimen before preservation. Scale bars: 1 cm (A); 2 mm (B). Image attribution: Durden and Smith (A); Wiklund, Durden, Drennan, and McQuaid (B).
Figure 22.
Figure 22.
Rooted Bayesian phylogeny of Scyphozoa. Concatenated (16S, 18S, 28S, and COI) median consensus BEAST tree with posterior probability (PP) and bootstrap (BS) values indicated. Only values of PP > 0.70 and BS > 50 are shown, with values of PP > 0.95 and BS > 90 indicated with a circle. Nodes not recovered on the RAxML tree are indicated with a hyphen. Sequences generated in this study are highlighted in violet.
Figure 23.
Figure 23.
Ulmaridae stet. CCZ_069 A in situ image B specimen before preservation C rhopalia. Scale bars: 1 cm (A); 5 mm (B). Image attribution: Durden and Smith (A); Wiklund, Durden, Drennan, and McQuaid (B, C).
Figure 24.
Figure 24.
Rooted Bayesian phylogeny of Asteroidea. Concatenated (12S, 16S, 18S, COI, and H3) median consensus BEAST tree with posterior probability (PP) and bootstrap (BS) values indicated. Only values of PP > 0.70 and BS > 50 are shown, with values of PP > 0.95 and BS > 90 indicated with a circle. Nodes not recovered on the RAxML tree are indicated with a hyphen. Sequences generated in this study are highlighted in violet.
Figure 25.
Figure 25.
Freyasteracf.tuberculata (Sladen, 1889). Specimen CCZ_175: A in situ image C whole specimen D ventral surface of the arms before preservation. Specimen CCZ_087: B in situ image E details of dorsal disc F ventral disc surface before preservation. Scale bars: 2 cm (A, B); 1 cm (C); 2 mm (D); 1 mm (E); 0.5 mm (F). Image attribution: Durden and Smith (A, B); Wiklund, Durden, Drennan, and McQuaid (C–F).
Figure 26.
Figure 26.
Freyastera stet. CCZ_201 A in situ image B whole specimen C dorsal disc surface D ventral disc surface. Scale bars: 2 cm (A); 2 mm (B); 1 cm (C); 2 mm (D). Image attribution: Durden and Smith (A); Wiklund, Durden, Drennan, and McQuaid (B–D).
Figure 27.
Figure 27.
Zoroaster stet. CCZ_065 A in situ image B abactinal view of whole specimen C detail of abactinal surface D detail of actinal surface before preservation. Scale bars: 3 cm (A); 2 cm (B); 5 mm (C, D). Image attribution: Durden and Smith (A); Wiklund, Durden, Drennan, and McQuaid (B–D).
Figure 28.
Figure 28.
Rooted Bayesian phylogeny of Crinoidea. Concatenated (16S, 18S, 28S, COI, and CytB) median consensus BEAST tree with posterior probability (PP) and bootstrap (BS) values indicated. Only values of PP > 0.70 and BS > 50 are shown, with values of PP > 0.95 and BS > 90 indicated with a circle. Nodes not recovered on the RAxML tree are indicated with a hyphen. Sequences generated in this study are highlighted in violet.
Figure 29.
Figure 29.
cf. sp. CCZ_165 A in situ image B xenomorph stalk attached to a polymetallic nodule C detached crown before preservation. Scale bars:1 cm (A). Image attribution: Durden and Smith (A); Wiklund, Durden, Drennan, and McQuaid (B, C).
Figure 30.
Figure 30.
Bathymetrinae inc. CCZ_176 A side view of adult specimen. Specimen CCZ_186 B pentacrinoid stage attached to a glass sponge stalk C pentacrinoid stage. Scale bars: 5 mm (A); 1 mm (B); 0.5 mm (C). Image attribution: Wiklund, Durden, Drennan, and McQuaid (A, B); Bribiesca-Contreras 2019 (C).
Figure 31.
Figure 31.
Phylogenetic tree of Echinoidea. COI-only median consensus BEAST tree with posterior probability (PP) and bootstrap (BS) values indicated. Only values of PP > 0.70 and BS > 50 are shown, with values of PP > 0.95 and BS > 90 indicated with a circle. Nodes not recovered on the RAxML tree are indicated with a hyphen. Sequences generated in this study are highlighted in violet.
Figure 32.
Figure 32.
Plesiodiademacf.globulosum (A. Agassiz, 1898). Specimen CCZ_196: A in situ image B specimen after recovery C detail of pedicellaria of specimen CCZ_196. Scale bars: 2 cm (A); 1 cm (B). Image attribution: Durden and Smith (A); Wiklund, Durden, Drennan, and McQuaid (B, C).
Figure 33.
Figure 33.
Kamptosomaabyssale Mironov, 1971. Specimen CCZ_082: A, B in situ images C oral view D aboral view of specimen before preservation. Scale bars: 1 cm (A, B); 5 mm (C, D). Image attribution: Durden and Smith (A, B); Wiklund, Durden, Drennan, and McQuaid (C, D).
Figure 34.
Figure 34.
Phylogenetic tree of the class Holothuroidea. Concatenated (12S, 16S, 18S, 28S, COI, and H3) median consensus BEAST tree with posterior probability (PP) and bootstrap (BS) values indicated. Only values of PP > 0.70 and BS > 50 are shown, with values of PP > 0.95 and BS > 90 indicated with a circle. Nodes not recovered on the RAxML tree are indicated with a hyphen. Sequences generated in this study are highlighted in violet.
Figure 35.
Figure 35.
Molpadiodemas stet. CCZ_102 A in situ image B tentacle ossicles C tube feet D dorsal surface E ventral surface of specimen before preservation. Scale bars: 2 cm (A); 20 μm (B); 1 cm (D, E). Image attribution: Durden and Smith (A); Bribiesca-Contreras (B, C); Wiklund, Durden, Drennan, and McQuaid (D, E).
Figure 36.
Figure 36.
Molpadiodemas stet. CCZ_194 A in situ image B tentacle ossicles C epibionts on ventral surface D detail of epibionts E dorsal surface F ventral view of specimen before preservation. Scale bars: 2 cm (A); 25 μm (B); 1 cm (E, F). Image attribution: Durden and Smith (A); Bribiesca-Contreras (B–D); Wiklund, Durden, Drennan, and McQuaid (E, F).
Figure 37.
Figure 37.
Synallactidae stet. CCZ_061 A in situ image B tentacle ossicles. Scale bars: 2 cm (A); 50 μm (B). Image attribution: Durden and Smith (A); Bribiesca-Contreras (B).
Figure 38.
Figure 38.
Synallactidae stet. CCZ_066 A in situ image B ossicles on dorsal skin C tentacle ossicles D dorsal surface E ventral surface of specimen before preservation. Scale bars: 2 cm (A, D, E); 50 μm (B, C). Image attribution: Durden and Smith (A); Bribiesca-Contreras (B, C); Wiklund, Durden, Drennan, and McQuaid (D, E).
Figure 39.
Figure 39.
Synallactes stet. CCZ_153 A in situ image B ossicles from dorsal skin C ossicles from ventral skin D dorsal view of specimen before preservation, E ventral view. Scale bars: 2 cm (A); 50 μm (B, C); 5 mm (D, E). Image attribution: Durden and Smith (A); Bribiesca-Contreras (B, C); Wiklund, Durden, Drennan, and McQuaid (D, E).
Figure 40.
Figure 40.
Oneirophanta stet. CCZ_100 A dorsal view of specimen before preservation B in situ image C ventral view D dorsal ossicles E ventral ossicles. Scale bars: 2 cm (A, C); 5 cm (B); 200 μm (D); 100 μm (E). Image attribution: Wiklund, Durden, Drennan, and McQuaid (A, C); Durden and Smith (B); Kremenetskaia (D, E).
Figure 41.
Figure 41.
Oneirophantacf.mutabilis Théel, 1879. Specimen CCZ_193 A in situ image B dorsal ossicles C dorsal view before preservation D ventral view. Scale bars: 200 μm (B); 1 cm (C, D). Image attribution: Durden and Smith (A); Bribiesca-Contreras (B); Wiklund, Durden, Drennan, and McQuaid (C, D).
Figure 42.
Figure 42.
Psychropotesverrucicaudatus Xiao, Gong, Kou, Li, 2019. Specimen CCZ_086: A, B in situ images C dorsal view of specimen before preservation D ventral view E dorsal ossicles F detail of warts and ossicles on dorsal body wall G mouth tentacles. Scale bars: 5 cm (B); 2 cm (C, D); 100 μm (E). Image attribution: Durden and Smith (A, B); Wiklund, Durden, Drennan, and McQuaid (C, D); Bribiesca-Contreras (E–G).
Figure 43.
Figure 43.
Psychropotesdyscrita (Clark, 1920). Specimen CCZ_083: A, B in situ images C lateral view D ventral view. Scale bars: 5 cm (A, B); 2 cm (C, D). Image attribution: Durden and Smith (A, B); Wiklund, Durden, Drennan, and McQuaid (C, D).
Figure 44.
Figure 44.
Benthodytescf.sanguinolenta Théel, 1882. Specimen CCZ_178: A in situ image B dorsal view of specimen before preservation C ventral view. Scale bars: 2 cm (A); 1 cm (B, C). Image attribution: Durden and Smith (A); Wiklund, Durden, Drennan, and McQuaid (B, C).
Figure 45.
Figure 45.
Benthodytesmarianensis Li, Xiao, Zhang & Zhang, 2018. CCZ_019: A in situ image B dorsal ossicles including peculiar cross-shaped ossicle C ventral ossicles. Scale bar: 5 cm (A); 100 µm (B, C). Image attribution: Durden and Smith (A), Kremenetskaia (B, C).
Figure 46.
Figure 46.
Peniagoneleander Pawson & Foell, 1986. Specimen CCZ_018: A, B in situ images C tentacle ossicles. Scale bars: 100 µm (C). Image attribution: Durden and Smith (A, B); Bribiesca-Contreras (C).
Figure 47.
Figure 47.
Peniagonevitrea Théel, 1882. Specimen CCZ_077: A, B in situ images C lateral view before preservation D dorsal view E dorsal ossicles. Scale bars:2 cm (A); 3 cm (B); 200 μm (E). Image attribution: Durden and Smith (A, B); Wiklund, Durden, Drennan, and McQuaid (C, D); Bribiesca-Contreras (E)
Figure 48.
Figure 48.
Psychronaetes sp. CCZ_101. Specimen CCZ_063 A in situ image. Specimen CCZ_101 B in situ image F dorsal ossicles. Specimen CCZ_103 C in situ image H dorsal ossicles. Specimen CCZ_104 D in situ image E dorsal view of specimen before preservation G ventral view. Scale bars: 5 cm (A, D); 2 cm (B); 1 cm (E, G); 75 μm (F); 100 μm (H). Image attribution: Durden and Smith (A–D); Wiklund, Durden, Drennan, and McQuaid (E, G); Bribiesca-Contreras (F, H).
Figure 49.
Figure 49.
Laetmogonecf.wyvillethomsoni Théel, 1979. Specimen CCZ_062 A in situ image; B dorsal view of specimen before preservation C ventral view D dorsal calcareous ossicles. Scale bars: 2 cm (A); 1 cm (B, C); 50 μm (D). Image attribution: Durden and Smith (A); Wiklund, Durden, Drennan, and McQuaid (B, C); Bribiesca-Contreras (D).
Figure 50.
Figure 50.
Phylogenetic tree of Ophiuroidea. Concatenated (28S, and COI) median consensus BEAST tree with posterior probability (PP) and bootstrap (BS) values indicated. Only values of PP > 0.70 and BS > 50 are shown, with values of PP > 0.95 and BS > 90 indicated with a circle. Nodes not recovered on the RAxML tree are indicated with a hyphen. Sequences generated in this study are highlighted in violet.
Figure 51.
Figure 51.
Ophiocymbiumtanyae Martynov, 2010 A dorsal view of specimen CCZ_206 before preservation B ventral view C detail of dorsal disc surface and dorsal arm plates D detail of jaws, ventral disc surface and ventral arm plates. Scale bars: 2 cm (A, B); 5 mm (C, D). Image attribution: Wiklund, Durden, Drennan, and McQuaid (A–D).
Figure 52.
Figure 52.
Ophiocymbiumcf.rarispinum Martynov, 2010. Specimen CCZ_197 A in situ image B dorsal surface before preservation C detail of ventral surface, jaws and ventral arm plates D detail of dorsal arm plates. Scale bars: 1 cm (A, B); 5 mm (C); 2.5 mm (D). Image attribution: Durden and Smith (A); Wiklund, Durden, Drennan, and McQuaid (B–D).
Figure 53.
Figure 53.
Ophiuroglyphacf.irrorata (Lyman, 1878). Specimen CCZ_059 A in situ image. Specimen CCZ_058 B in situ image C dorsal view of specimen before preservation D ventral view E arm hooklets F detail of ventral disc surface and ventral arm plates. Scale bars: 2 cm (A, B); 1 cm (C, D); 2 mm (F). Image attribution: Durden and Smith (A, B); Wiklund, Durden, Drennan, and McQuaid (C–F).
Figure 54.
Figure 54.
Phylogenetic tree of Hexactinellida. Concatenated (16S, 18S, 28S, and COI) median consensus BEAST tree with posterior probability (PP) and bootstrap (BS) values indicated. Only values of PP > 0.70 and BS > 50 are shown, with values of PP > 0.95 and BS > 90 indicated with a circle. Nodes not recovered on the RAxML tree are indicated with a hyphen. Sequences generated in this study are highlighted in violet.
Figure 55.
Figure 55.
Hyalonema stet. CCZ_020. Specimen CCZ_179 A in situ image B specimen before preservation. Specimen CCZ_020 C in situ image. Scale bars: 2 cm (A, C); 1 cm (B). Image attribution: Durden and Smith (A, C); Wiklund, Durden, Drennan, and McQuaid (B).
Figure 56.
Figure 56.
Hyalonema stet. CCZ_081 A in situ image, B. Scale bars: 1 cm (A); 5 mm (B). Image attribution: Durden and Smith (A); Wiklund, Durden, Drennan, and McQuaid (B).
Figure 57.
Figure 57.
Euplectellinae stet. CCZ_199 A in situ image B detail of body C whole specimen with protruding basalia. Scale bars: 1 cm (A); 5 mm (B). Image attribution: Durden and Smith (A); Wiklund, Durden, Drennan, and McQuaid (B, C).
Figure 58.
Figure 58.
Docosaccus sp. CCZ_021 A in situ image B dermal surface C and atrial surface. Scale bars: 1 cm (A, B, C). Image attribution: Durden and Smith (A); Wiklund, Durden, Drennan, and McQuaid (B, C).
Figure 59.
Figure 59.
Holascus stet. CCZ_078 A in situ image B lateral view of specimen before preservation C top view. Scale bars: 2 cm (A); 1 cm (B). Image attribution: Durden and Smith (A); Wiklund, Durden, Drennan, and McQuaid (B, C).
Figure 60.
Figure 60.
Bolosominae stet. CCZ_198 A, C in situ images B specimen before preservation. Scale bars: 5 cm (A, C). Image attribution: Durden and Smith (A, C); Wiklund, Durden, Drennan, and McQuaid (B).
Figure 61.
Figure 61.
Bathyxiphus sp. CCZ_151. Specimen CCZ_151 A, E in situ images B, C, D specimen before preservation. Scale bars: 2 cm (B, C). Image attribution: Durden and Smith (A, E); Wiklund, Durden, Drennan, and McQuaid (B–D).

References

    1. Agassiz A. (1881) Report on the Echinoidea dredged by H.M.S. Challenger during the years 1873–1876. Report on the Scientific Results of the Voyage of HMS Challenger during the years 1873–76. Zoology (Jena, Germany) 3: 1–321.
    1. Agassiz A. (1898) Reports on the dredging operations off the west coast of Central America to the Galápagos, to the west coast of México, and in the Gulf of California, in charge of Alexander Agassiz, carried on by the U.S. Fish Commission Streamer "Albatross", during 1891, Lieut. Commander Z. L. Tanner, U.S.N., Commanding. XXIII. Preliminary report on the Echini. Bulletin of the Museum of Comparative Zoology 32: 71–86.
    1. Agassiz A. (1904) The Panamic deep sea echini. Memoirs of the Museum of Comparative Zoology at Harvard College 31: 1–243.
    1. Amon DJ, Ziegler AF, Dahlgren TG, Glover AG, Goineau A, Gooday AJ, Wiklund H, Smith CR. (2016) Insights into the abundance and diversity of abyssal megafauna in a polymetallic-nodule region in the eastern Clarion-Clipperton Zone. Scientific Reports 6(1): 1–12. 10.1038/srep30492 - DOI - PMC - PubMed
    1. Amon DJ, Ziegler AF, Drazen JC, Grischenko AV, Leitner AB, Lindsay DJ, Voight JR, Wicksten MK, Young CM, Smith CR. (2017a) Megafauna of the UKSRL exploration contract area and eastern Clarion-Clipperton Zone in the Pacific Ocean: Annelida, Arthropoda, Bryozoa, Chordata, Ctenophora, Mollusca. Biodiversity Data Journal 14598: e14598. 10.3897/BDJ.5.e14598 - DOI - PMC - PubMed

LinkOut - more resources