

Immunity against Moraxella catarrhalis requires guanylate-binding proteins and caspase-11-NLRP3 inflammasomes
- PMID: 36762431
- PMCID: PMC10015372
- DOI: 10.15252/embj.2022112558
Immunity against Moraxella catarrhalis requires guanylate-binding proteins and caspase-11-NLRP3 inflammasomes
Abstract
Moraxella catarrhalis is an important human respiratory pathogen and a major causative agent of otitis media and chronic obstructive pulmonary disease. Toll-like receptors contribute to, but cannot fully account for, the complexity of the immune response seen in M. catarrhalis infection. Using primary mouse bone marrow-derived macrophages to examine the host response to M. catarrhalis infection, our global transcriptomic and targeted cytokine analyses revealed activation of immune signalling pathways by both membrane-bound and cytosolic pattern-recognition receptors. We show that M. catarrhalis and its outer membrane vesicles or lipooligosaccharide (LOS) can activate the cytosolic innate immune sensor caspase-4/11, gasdermin-D-dependent pyroptosis, and the NLRP3 inflammasome in human and mouse macrophages. This pathway is initiated by type I interferon signalling and guanylate-binding proteins (GBPs). We also show that inflammasomes and GBPs, particularly GBP2, are required for the host defence against M. catarrhalis in mice. Overall, our results reveal an essential role for the interferon-inflammasome axis in cytosolic recognition and immunity against M. catarrhalis, providing new molecular targets that may be used to mitigate pathological inflammation triggered by this pathogen.
Keywords: IL-1; MCC950; STING; TLR4; cGAS.
© 2023 The Authors. Published under the terms of the CC BY 4.0 license.
Figures
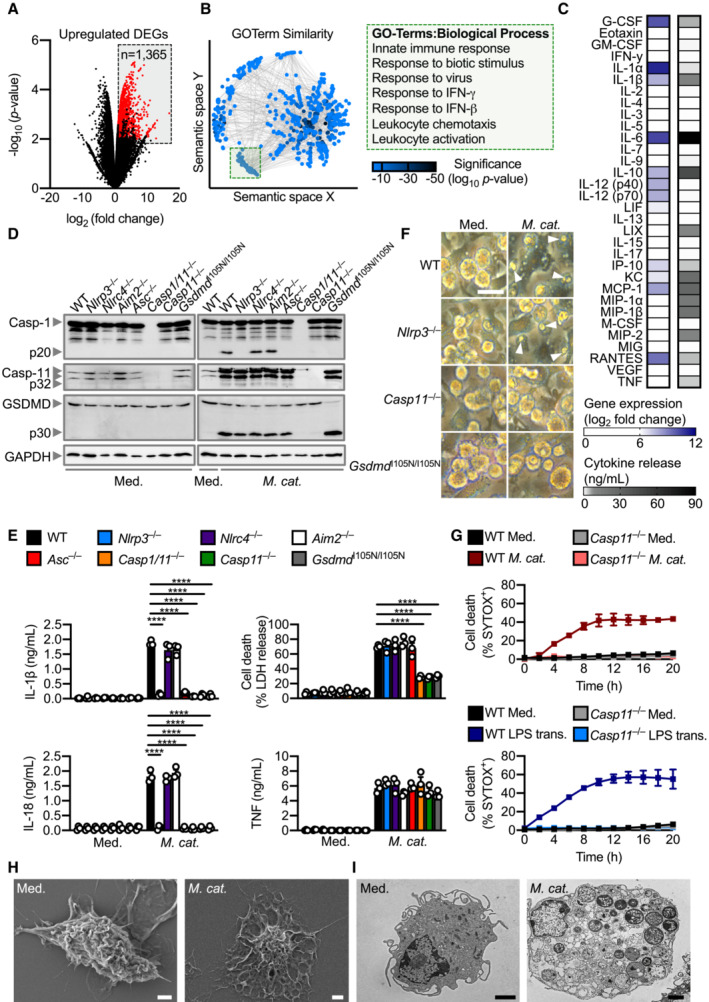
Volcano plot profiling of gene expression changes in WT BMDMs infected with M. catarrhalis (Ne11, MOI 100) for 8 h relative to untreated WT BMDMs. Upregulated differentially expressed genes (DEGs) are represented by red dots (P‐value < 0.01, counts per million > 1 and fold‐change > 2) within the grey box.
Enrichment and similarity analysis of gene ontology terms associated with the significantly upregulated DEGs depicted in (A).
Multiplex ELISA of secreted inflammatory cytokines (right) and associated gene expression by RNA‐sequencing (left) of WT BMDMs infected with M. catarrhalis (Ne11) as in (A).
Immunoblot analysis of caspase‐1 (Casp‐1), caspase‐11 (Casp‐11), gasdermin D (GSDMD) and GAPDH (loading control) in WT and mutant BMDMs left untreated (Med.) or assessed 20 h after infection with M. catarrhalis (Ne11, MOI 100).
Release of IL‐1β, IL‐18, TNF and LDH from BMDMs after treatment as in (D).
Brightfield microscopy analysis of WT and mutant BMDMs after treatment as in (D).
IncuCyte live‐imaging analysis of WT and Casp11 −/− BMDM viability after infection with M. catarrhalis as in (D), or transfection with LPS.
Scanning electron microscopy of WT BMDMs left untreated or assessed after infection as in (D).
Transmission electron microscopy of WT BMDMs left untreated or assessed after infection as in (D).
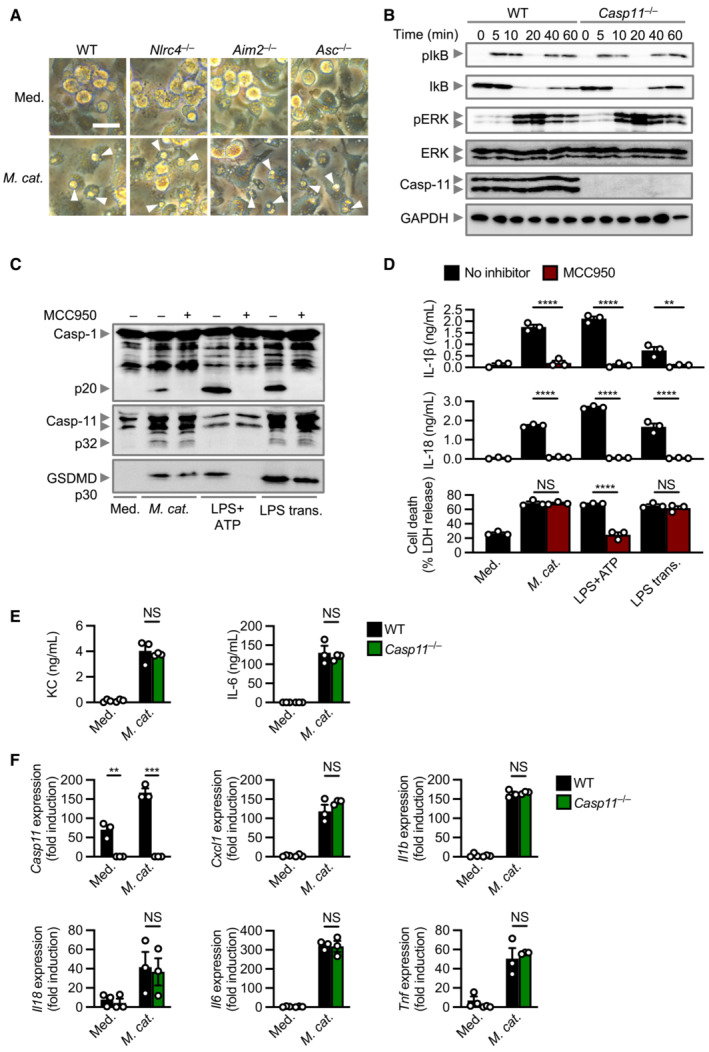
Brightfield microscopy analysis of WT and mutant BMDMs left untreated (Med.) or assessed 20 h after infection with M. catarrhalis (Ne11, MOI 100).
Immunoblot analysis of phospho‐IkB (pIkB), IkB, phospho‐ERK (pERK), ERK, caspase‐11 (Casp‐11) and GAPDH (loading control) of WT and Casp11 −/− BMDMs 0–60 min after infection with M. catarrhalis (Ne11 strain, MOI 50).
Immunoblot analysis of caspase‐1 (Casp‐1), Casp‐11 and gasdermin D (GSDMD) in WT BMDMs left untreated (Med.) or assessed 20 h after infection with M. catarrhalis (Ne11, MOI 100), 30 min after treatment with LPS + ATP (5 mM) or 5 h after transfection with 5 μg of Escherichia coli LPS in the absence (−) or presence (+) of the NLRP3 inhibitor MCC950 (20 μM).
Release of IL‐1β, IL‐18 and LDH from BMDMs after treatment as in (C).
Release of KC and IL‐6 in WT and Casp11 −/− BMDMs left untreated (Med.) or infected as in (A).
qRT–PCR analysis of the genes encoding Casp‐11, KC (Cxcl1), IL‐1β, IL‐18, IL‐6 and TNF in WT and Casp11 −/− BMDMs left untreated or assessed 4 h after infection with M. catarrhalis (Ne11 strain, MOI 50), relative to Gapdh.
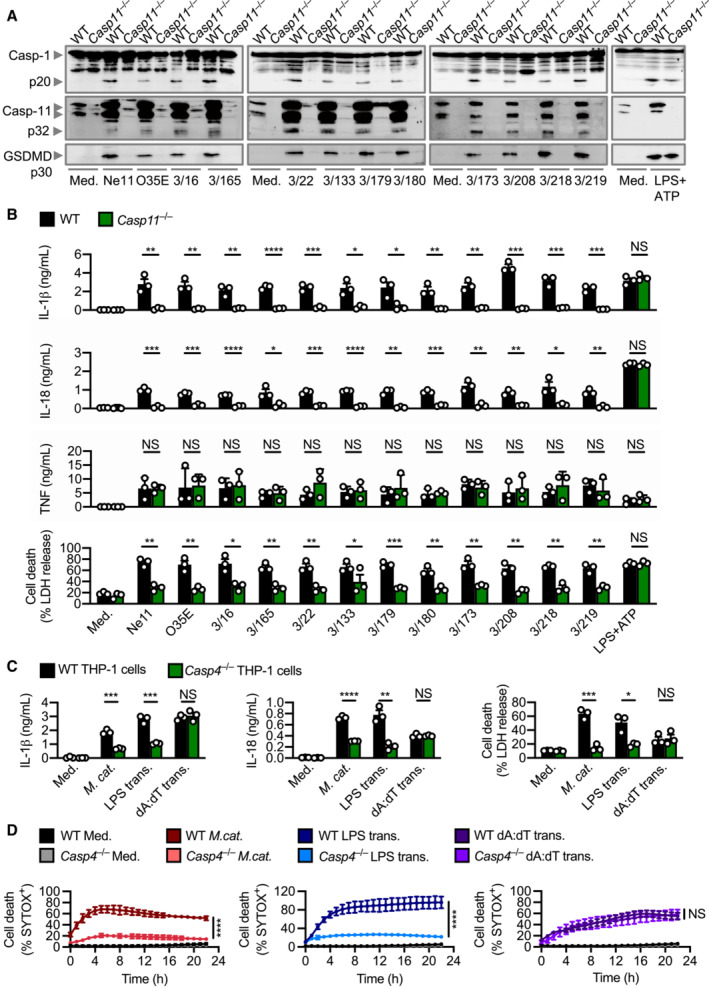
Immunoblot analysis of caspase‐1 (Casp‐1), caspase‐11 (Casp‐11) and gasdermin D (GSDMD) in WT and Casp11 −/− BMDMs left untreated (Med.) or assessed 10 h after infection with 12 strains of M. catarrhalis (MOI 50), or 30 min after treatment with LPS + ATP (5 mM).
Release of IL‐1β, IL‐18, TNF and LDH from BMDMs after treatment as in (A).
Release of IL‐1β, IL‐18 and LDH from WT and Casp4 −/− THP‐1 macrophage‐like cells left untreated (Med.), assessed 6 h after infection with M. catarrhalis (Ne11, MOI 50), following overnight transfection with 5 μg of Escherichia coli LPS or after Pam3CSK4 priming with overnight transfection with 5 μg of poly(dA:dT).
IncuCyte live‐imaging analysis of WT and Casp4 −/− THP‐1 macrophage‐like cell viability assessed after treatment as in (C).
- A
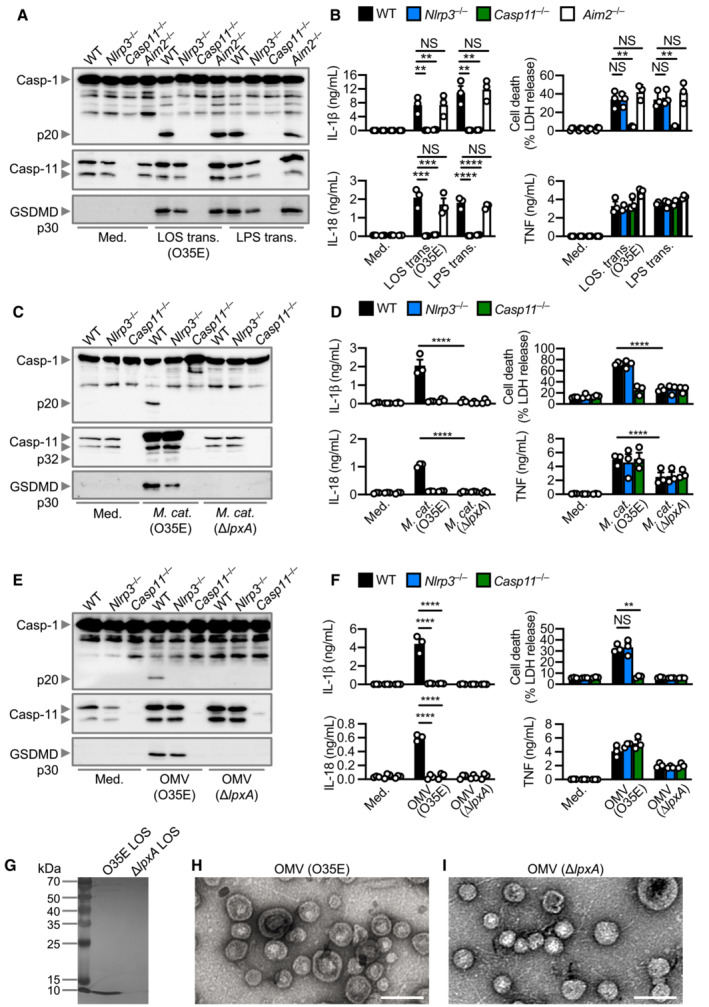
Immunoblot analysis of caspase‐1 (Casp‐1), caspase‐11 (Casp‐11) and gasdermin D (GSDMD) in WT, Nlrp3 −/−, Casp11 −/− and Aim2 −/− BMDMs left untreated (Med.) or 5 h after transfection with 5 μg of LOS from M. catarrhalis (O35E) or 5 μg of LPS from Escherichia coli.
- B
Release of IL‐1β, IL‐18, TNF and LDH from BMDMs after treatment as in (A).
- C
Immunoblot analysis of Casp‐1, Casp‐11 and GSDMD in WT, Nlrp3 −/− and Casp11 −/− BMDMs left untreated (Med.) or assessed 10 h after infection with M. catarrhalis (O35E and ΔlpxA, MOI 100).
- D
Release of IL‐1β, IL‐18, TNF and LDH from BMDMs after treatment as in (C).
- E
Immunoblot analysis of Casp‐1, Casp‐11 and GSDMD in WT, Nlrp3 −/− and Casp11 −/− BMDMs left untreated (Med.) or assessed 10 h after incubation with 10 μg of OMVs purified from M. catarrhalis (O35E and ΔlpxA).
- F
Release of IL‐1β, IL‐18, TNF and LDH from BMDMs after treatment as in (E).
- G
Silver‐stained SDS–PAGE of LOS purified from M. catarrhalis (O35E and ΔlpxA).
- H, I
Transmission electron microscopy of negative stained OMVs purified from M. catarrhalis (O35E and ΔlpxA).
- A–D
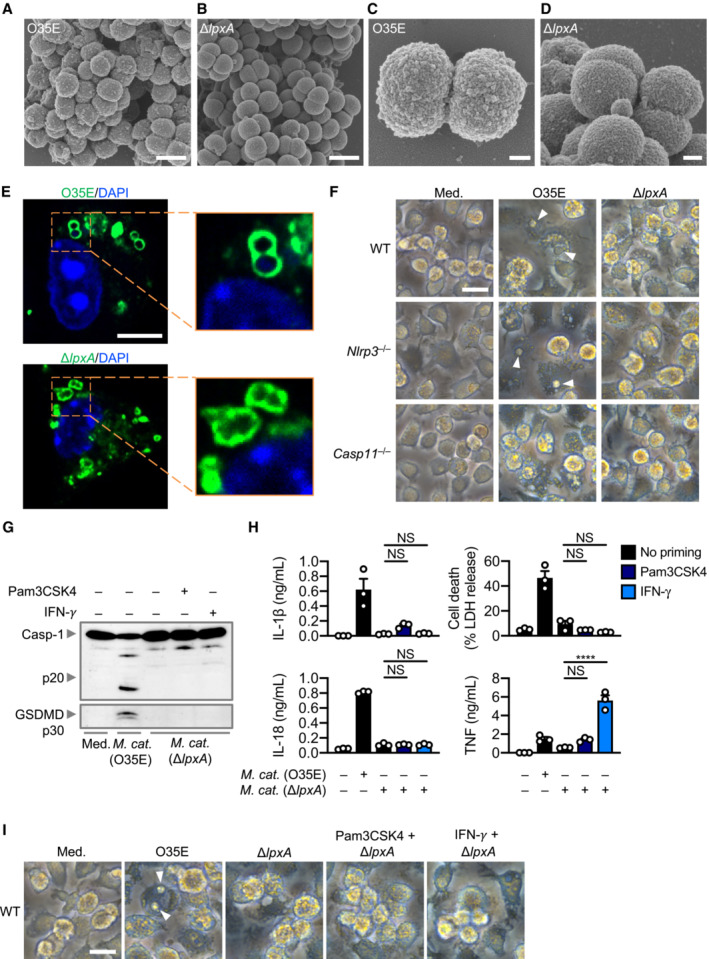
Scanning electron microscopy (SEM) of M. catarrhalis O35E and ΔlpxA.
- E
Confocal microscopy analysis of intracellular M. catarrhalis (green) in WT BMDMs 12 h after infection with O35E or ΔlpxA (MOI 20).
- F
Brightfield microscopy analysis of WT, Nlrp3 −/− and Casp11 −/− BMDMs left untreated (Med.) or assessed 10 h after infection with M. catarrhalis (O35E and ΔlpxA, MOI 100).
- G
Immunoblot analysis of caspase‐1 (Casp‐1) and gasdermin D (GSDMD) in WT BMDMs left untreated (Med.) or assessed 10 h after infection with O35E or ΔlpxA (MOI 100) either in the absence of priming or following 3 h of priming with Pam3CSK4 (0.5 μg/ml) or IFN‐γ (100 U/ml).
- H
Release of IL‐1β, IL‐18, TNF and LDH from WT BMDMs after treatment as in (G).
- I
Brightfield microscopy analysis of WT BMDMs after treatment as in (G).
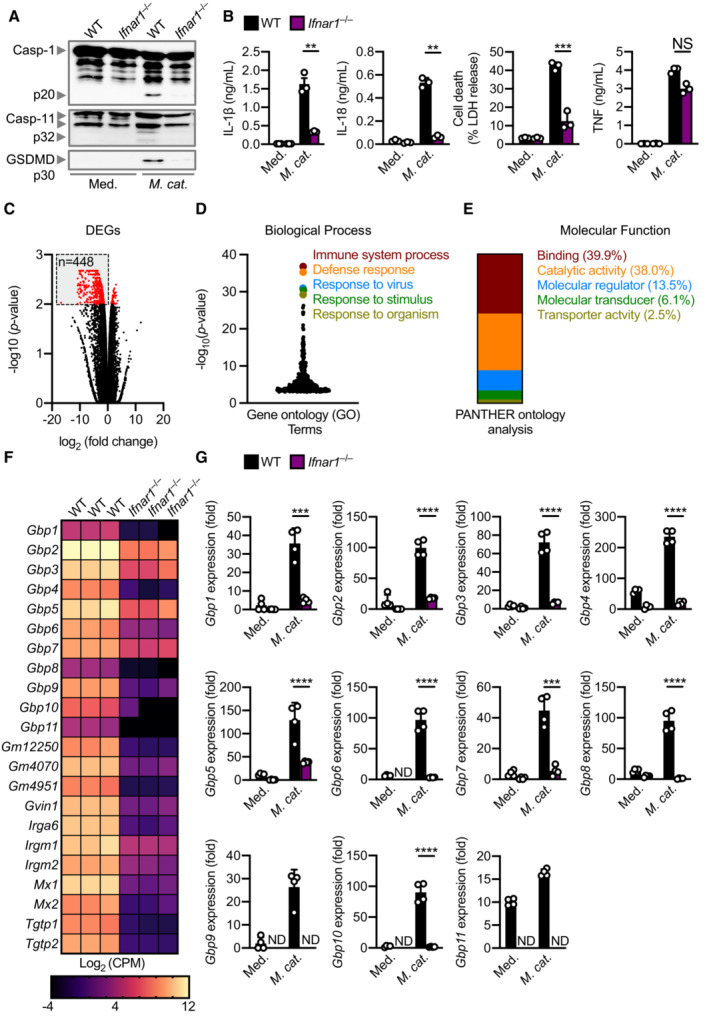
Immunoblot analysis of caspase‐1 (Casp‐1), caspase‐11 (Casp‐11) and gasdermin D (GSDMD) in WT and Ifnar1 −/− BMDMs left untreated (Med.) or assessed 20 h after infection with M. catarrhalis (Ne11, MOI 50).
Release of IL‐1β, IL‐18, LDH and TNF from BMDMs after treatment as in (A).
Volcano plot profiling of gene expression changes in Ifnar1 −/− BMDMs, relative to WT BMDMs, infected with M. catarrhalis (Ne11, MOI 100) for 8 h. Differentially expressed genes (DEGs) are represented by red dots. Downregulated DEGs are shown in the grey box.
Gene ontology analysis of significantly downregulated DEGs (n = 448) as depicted in (C).
Functional ontology analysis of the downregulated DEGs present within the top 5 biological processes depicted in (C).
Transcript abundance for genes encoding GTPases in WT and Ifnar1 −/− BMDMs infected with M. catarrhalis as in (C). Transcript abundance is provided in counts per million (CPM).
qRT–PCR analysis of genes encoding the family of guanylate‐binding proteins (GBP1‐11) in WT and Ifnar1 −/− BMDMs left untreated (Med.) or following treatment as in (C).
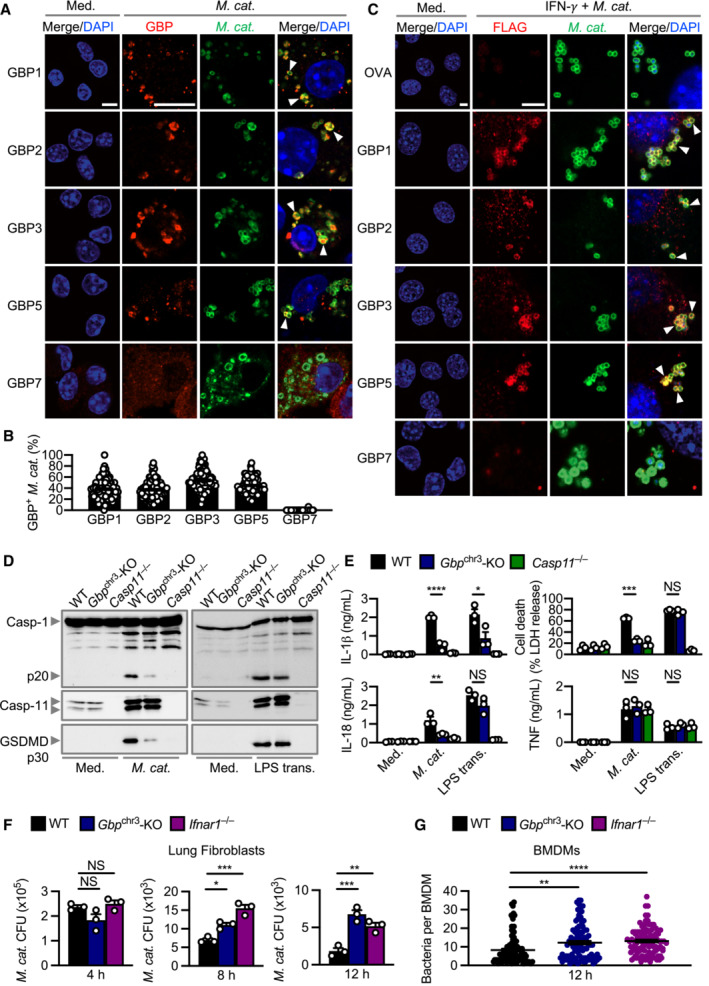
Confocal microscopy analysis of intracellular M. catarrhalis (green) and GBP1, GBP2, GBP3, GBP5 or GBP7 (red) in WT BMDMs left untreated (Med.) or assessed 12 h after infection with M. catarrhalis (Ne11, MOI 20).
Quantitation of GBP1‐, GBP2‐, GBP3‐, GBP5‐ and GBP7‐positive M. catarrhalis in WT BMDMs as treated in (A).
Confocal microscopy analysis of FLAG‐OVA, FLAG‐GBP1, FLAG‐GBP2, FLAG‐GBP3, FLAG‐GBP5, FLAG‐GBP7 (red) and M. catarrhalis (green) in LA‐4 cells left untreated (Med.), or 16 h after infection with M. catarrhalis (Ne11, MOI 20) primed with IFN‐γ (100 U/ml).
Immunoblot analysis of caspase‐1 (Casp‐1), caspase‐11 (Casp‐11) and gasdermin D (GSDMD) in WT, Gbp chr3‐KO and Casp11 −/− BMDMs left untreated (Med.) or assessed 10 h after infection with M. catarrhalis (Ne11, MOI 100), or 5 h after transfection with 5 μg LPS from Escherichia coli.
Release of IL‐1β, IL‐18, TNF and LDH from BMDMs after treatment as in (D).
Recovery of M. catarrhalis (as colony‐forming units (CFU)) from primary WT, Gbp chr3‐KO and Ifnar1 −/− lung fibroblasts 4, 8 and 12 h after infection with M. catarrhalis (Ne11, MOI 100).
Quantitation of intracellular bacteria by Transmission electron microscopy (TEM) in WT, Gbp chr3‐KO and Ifnar1 −/− BMDMs infected with M. catarrhalis (Ne11, MOI 50) for 12 h.
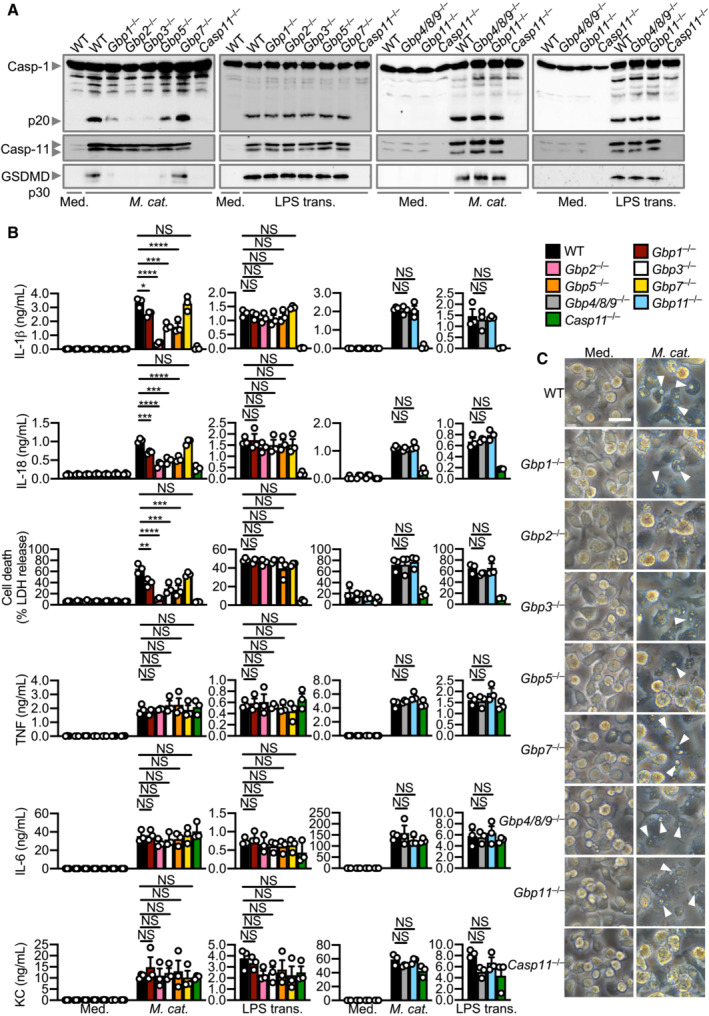
Immunoblot analysis of caspase‐1 (Casp‐1), caspase‐11 (Casp‐11) and gasdermin D (GSDMD) in WT, Gbp1 −/−, Gbp2 −/−, Gbp3 −/−, Gbp5 −/−, Gbp7 −/−, Gbp4/8/9 −/−, Gbp11 −/− and Casp11 −/− BMDMs left untreated (Med.) or assessed 10 h after infection with M. catarrhalis (Ne11, MOI 100), or 5 h after transfection with 5 μg LPS from Escherichia coli.
Release of IL‐1β, IL‐18, LDH, TNF, IL‐6 and KC from BMDMs after treatment as in (A).
Brightfield microscopy analysis of WT and mutant BMDMs after treatment as in (A).
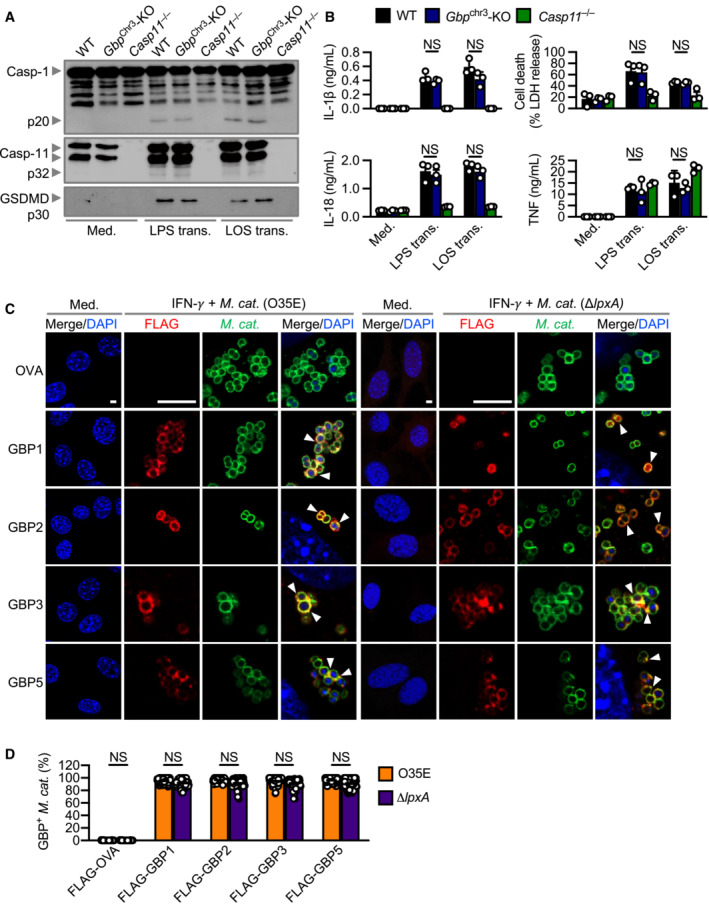
Immunoblot analysis of caspase‐1 (Casp‐1), caspase‐11 (Casp‐11) and gasdermin D (GSDMD) in WT, Gbp Chr3‐KO and Casp11 −/− BMDMs left untreated (Med.) or 10 h after transfection with 5 μg of LPS from Escherichia coli or 5 μg of LOS from M. catarrhalis (O35E).
Release of IL‐1β, IL‐18, TNF and LDH from BMDMs after treatment as in (A).
Confocal microscopy analysis of FLAG‐OVA, FLAG‐GBP1, FLAG‐GBP2, FLAG‐GBP3, FLAG‐GBP5 (red) and M. catarrhalis (green) in LA‐4 cells left untreated (Med.), or 16 h after infection of IFN‐γ‐primed (100 U/ml) LA‐4 cells with M. catarrhalis (O35E or ΔlpxA, MOI 20).
Quantitation of FLAG‐OVA, FLAG‐GBP1, FLAG‐GBP2, FLAG‐GBP3 and FLAG‐GBP5 positive M. catarrhalis in LA‐4 cells treated as in (C).
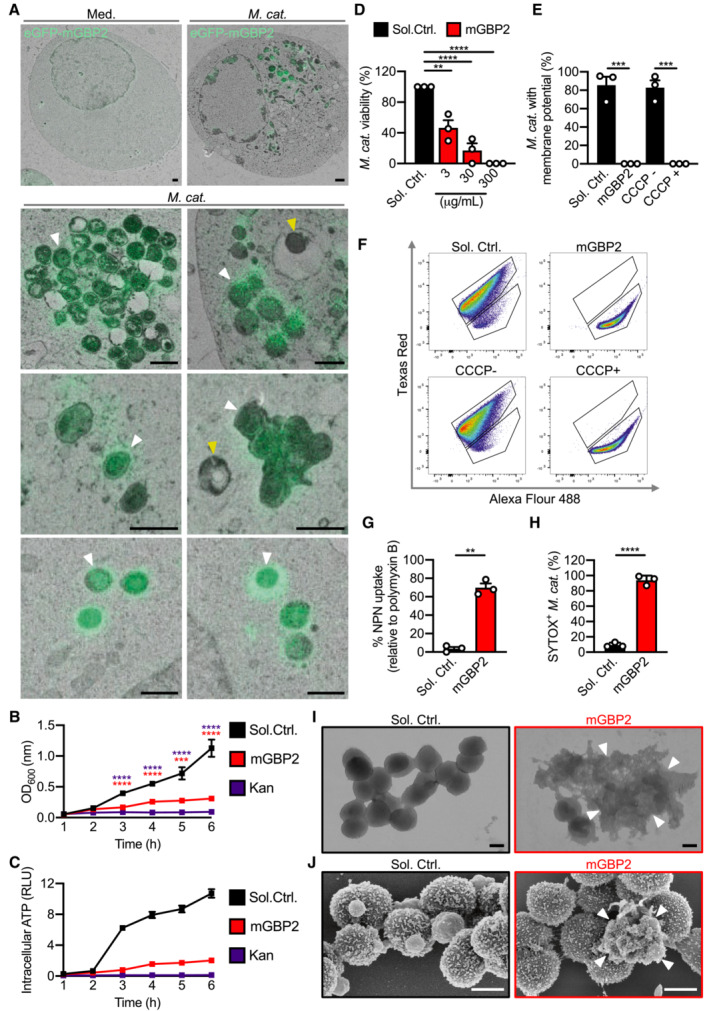
Correlative light electron microscopy (CLEM) of HEK293T cells overexpressing eGFP‐GBP2 left untreated (Med.) or infected with M. catarrhalis (Ne11, MOI 5).
Quantification of OD600 of M. catarrhalis in BHI media over 6 h in the presence of solvent control (Sol. Ctrl.), 80 μg/ml recombinant GBP2 or 50 μg/ml kanamycin.
Quantification of ATP from M. catarrhalis in BHI media over 6 h in the presence of Sol. Ctrl., 30 μg/ml recombinant GBP2 or 50 μg/ml kanamycin.
Viability of M. catarrhalis (as a percentage of CFU in relation to Sol. Ctrl.) assessed 6 h after incubation with recombinant GBP2 at 3, 30 or 300 μg/ml.
Quantitation of DiOC2(3) stained M. catarrhalis with fluorescence emission shift from green to red (as a percentage relative to Sol. Ctrl.) assessed 6 h after incubation with recombinant GBP2 at 50 μg/ml or 5 μM CCCP for 30 min.
Flow cytometry plots showing the gating strategy for analysis of fluorescence emission by DiOC2(3) stained bacteria.
Uptake of NPN in M. catarrhalis (as a percentage relative to 20 μg/ml polymyxin B treatment) assessed 15 min after incubation with Sol. Ctrl. or recombinant GBP2 at 40 μg/ml.
Flow cytometric quantitation of SYTOX‐stained M. catarrhalis treated with 100 μg/ml of recombinant GBP2 for 6 h.
Transmission electron microscopy (TEM) analysis of negative stained M. catarrhalis 6 h after treatment with Sol. Ctrl. or 100 μg/ml of recombinant GBP2.
Scanning electron microscopy (SEM) analysis of the morphology of M. catarrhalis 6 h after treatment as in (I).
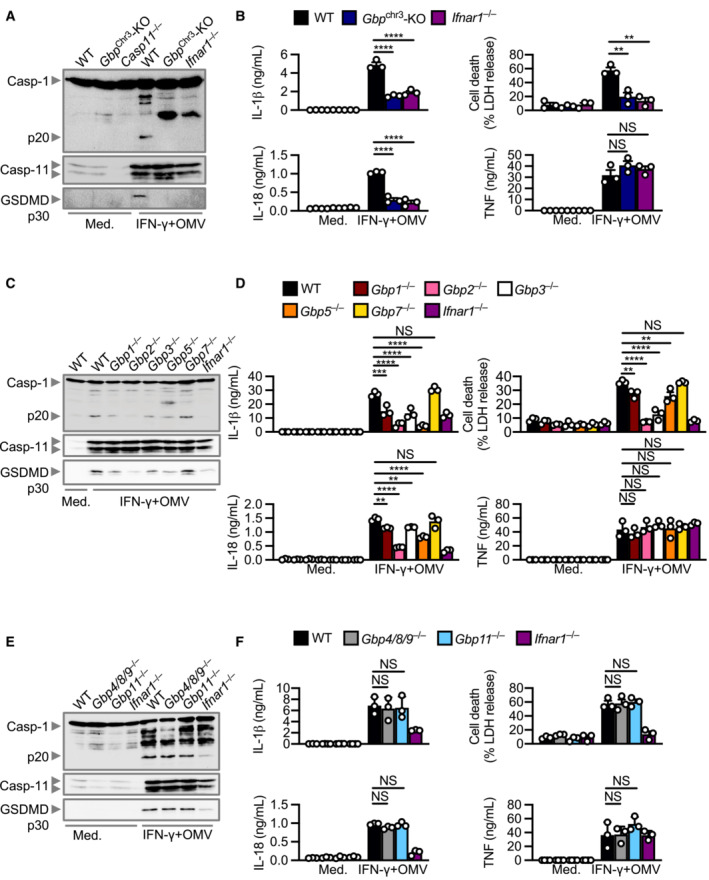
Immunoblot analysis of caspase‐1 (Casp‐1), caspase‐11 (Casp‐11) and gasdermin D (GSDMD) in WT, Gbp chr3‐KO and Ifnar1 −/− BMDMs left untreated (Med.) or primed with IFN‐γ (100 U/ml) and assessed 10 h after incubation with 10 μg of M. catarrhalis OMVs (Ne11).
Release of IL‐1β, IL‐18, TNF and LDH from BMDMs after treatment as in (A).
Immunoblot analysis of Casp‐1, Casp‐11 and GSDMD in WT, Gbp1 −/−, Gbp2 −/−, Gbp3 −/−, Gbp5 −/−, Gbp7 −/−, and Ifnar1 −/− BMDMs left untreated (Med.) or treated as in (A).
Release of IL‐1β, IL‐18, TNF and LDH from BMDMs after treatment as in (C).
Immunoblot analysis of Casp‐1, Casp‐11 and GSDMD in WT, Gbp4/8/9 −/−, Gbp11 −/− and Ifnar1 −/− BMDMs left untreated (Med.) or treated as in (A).
Release of IL‐1β, IL‐18, TNF and LDH from BMDMs after treatment as in (E).
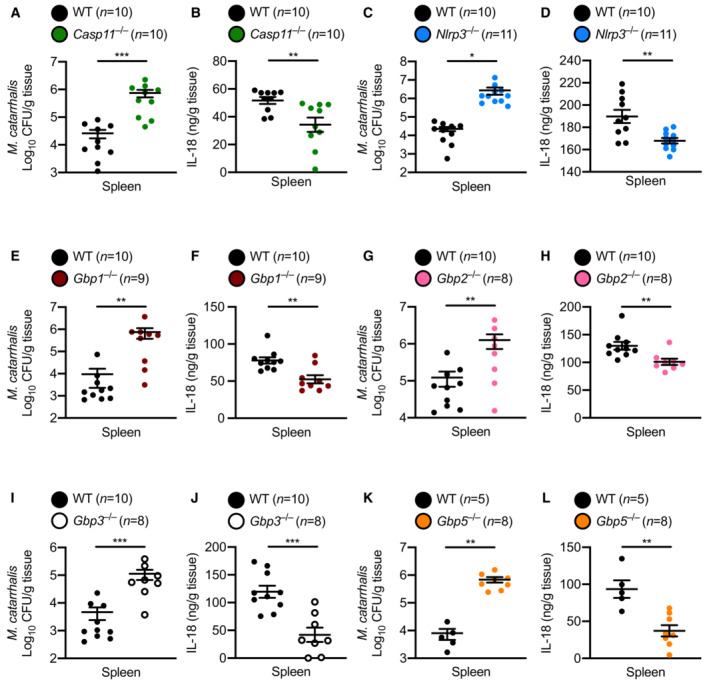
- A, B
Bacterial burden and concentration of IL‐18 in the spleen of WT mice (n = 10) and Casp11 −/− mice (n = 10) after M. catarrhalis infection.
- C, D
Bacterial burden and concentration of IL‐18 in the spleen of WT mice (n = 10) and Nlrp3 −/− mice (n = 11) after M. catarrhalis infection.
- E, F
Bacterial burden and concentration of IL‐18 in the spleen of WT mice (n = 10) and Gbp1 −/− mice (n = 9) after M. catarrhalis infection.
- G, H
Bacterial burden and concentration of IL‐18 in the spleen of WT mice (n = 10) and Gbp2 −/− mice (n = 8) after M. catarrhalis infection.
- I, J
Bacterial burden and concentration of IL‐18 in the spleen of WT mice (n = 10) and Gbp3 −/− mice (n = 8) after M. catarrhalis infection.
- K, L
Bacterial burden and concentration of IL‐18 in the spleen of WT mice (n = 5) and Gbp5 −/− mice (n = 8) after M. catarrhalis infection.
References
-
- Andreas S, Testa M, Boyer L, Brusselle G, Janssens W, Kerwin E, Papi A, Pek B, Puente‐Maestu L, Saralaya D et al (2022) Non‐typeable Haemophilus influenzae‐Moraxella catarrhalis vaccine for the prevention of exacerbations in chronic obstructive pulmonary disease: a multicentre, randomised, placebo‐controlled, observer‐blinded, proof‐of‐concept, phase 2b trial. Lancet Respir Med 10: 435–446 - PubMed
-
- Bluestone CD (2000) Clinical course, complications and sequelae of acute otitis media. Pediatr Infect Dis J 19: S37–S46 - PubMed
-
- Broz P, Dixit VM (2016) Inflammasomes: mechanism of assembly, regulation and signalling. Nat Rev Immunol 16: 407–420 - PubMed
Publication types
MeSH terms
Substances
Associated data
- Actions
LinkOut - more resources
Full Text Sources
Molecular Biology Databases
Research Materials
