. 2023 Apr;10(11):e2204113.
doi: 10.1002/advs.202204113. Epub 2023 Feb 10.

Enabling Single-Cell Drug Response Annotations from Bulk RNA-Seq Using SCAD

Affiliations

Enabling Single-Cell Drug Response Annotations from Bulk RNA-Seq Using SCAD

Zetian Zheng et al. Adv Sci (Weinh). 2023 Apr.

Abstract

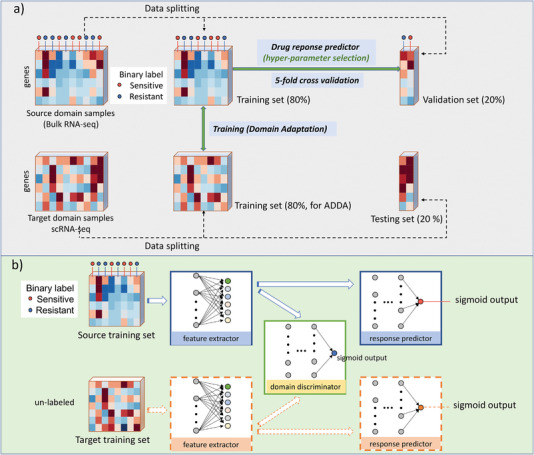
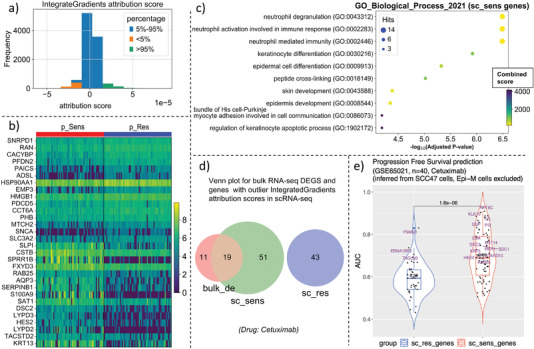
The single-cell RNA sequencing (scRNA-seq) quantifies the gene expression of individual cells, while the bulk RNA sequencing (bulk RNA-seq) characterizes the mixed transcriptome of cells. The inference of drug sensitivities for individual cells can provide new insights to understand the mechanism of anti-cancer response heterogeneity and drug resistance at the cellular resolution. However, pharmacogenomic information related to their corresponding scRNA-Seq is often limited. Therefore, a transfer learning model is proposed to infer the drug sensitivities at single-cell level. This framework learns bulk transcriptome profiles and pharmacogenomics information from population cell lines in a large public dataset and transfers the knowledge to infer drug efficacy of individual cells. The results suggest that it is suitable to learn knowledge from pre-clinical cell lines to infer pre-existing cell subpopulations with different drug sensitivities prior to drug exposure. In addition, the model offers a new perspective on drug combinations. It is observed that drug-resistant subpopulation can be sensitive to other drugs (e.g., a subset of JHU006 is Vorinostat-resistant while Gefitinib-sensitive); such finding corroborates the previously reported drug combination (Gefitinib + Vorinostat) strategy in several cancer types. The identified drug sensitivity biomarkers reveal insights into the tumor heterogeneity and treatment at cellular resolution.

Keywords: drug response annotation; single-cell sequencing; transfer learning.


Conflict of interest statement

The authors declare no conflict of interest.

Figures

Figure 1
Figure 1
Architecture of SCAD model. a) Data splitting of the source domain and target domain. The SCAD applied a five‐fold cross validation resampling method. For each split, four‐fold of the source domain and target domain are used to train the model, the details of training of process are described in part (b). Another fold of the source domain data is selected as validation set for hyper‐parameter selection. The performance of SCAD is quantified by the average AUC and AUPR scores on the isolated testing set of the target domain. b) Domain adaptation of SCAD, includes a shared feature extractor that extracts the latent feature representations of the source domain and target domain samples; a domain discriminator to help the feature extractor to learn domain invariant features from both the source domain and target domain; a domain communal drug response predictor which was trained by minimizing the loss of the predicted and ground truth drug sensitivities of the source domain data.
Figure 2
Figure 2
Evaluation of SCAD when the source domain includes all cell lines and when the source domain includes only solid tumor cell lines. a,b) Average AUC and AUPR scores of SCAD in seven drugs, respectively. The scRNA‐seq profiles were sequenced prior to drug treatment.
Figure 3
Figure 3
Identification of gene biomarker attributions to drug (Cetuximab) response heterogeneity. a) Density plot for IntegratedGradient attribution score of each gene in the scRNA‐seq expression data of the target domain. b) Heatmap for the top15 up‐regulated genes in p_Sens cells and the top15 up‐regulated genes in p_Res cells. In order to identify high confidence biomarkers, only genes with the largest absolute IntegratedGradient attribution scores (the subset of genes whose contribution values fall in the <5% interval or >95% interval in (a)) are retained for differential expression analysis. c) The gene enrichment analysis (Go Oncology Biological Process v2021) for identified candidate drug sensitive‐related genes for compound Cetuximab. d) Venn plot for the overlap of differentially expressed genes that is reported in a previous study[ 20 ] and differentially expressed genes (p_Sens vs. p_Res cells) among genes with largest absolute IntegratedGradient attribution scores (those genes whose contribution value falls in the <5% interval or >95% interval in (a)) in scRNA‐seq. The bulk_de is the shorthand for the differentially expressed genes from the bulk RNA‐seq result in the previous study;[ 20 ] sc_sens refers to the predicted gene set that may make cells susceptible to drugs; sc_res refers to the potential gene biomarkers that contribute to drug resistance. e) Progression free survival (PFS) status prediction on GSE65021 cohort based on the expression level of biomarker genes on GSE65021 dataset; the biomarkers are identified from scRNA‐seq data.
Figure 4
Figure 4
Drug resistance ranking of cells identifies potential prognosis biomarkers. a) The PCA dimensional reduction plot of single cells that is colored by the EpiSen status after the binarization of the EpiSen score, which was regarded as the ground truth drug sensitivity statues of cells to generate the labels of our target domain datasets. b) The PCA plot of single cells that is colored by the binarized (cutoff = median) SCAD prediction values. c) Visualization of single cells by PCA which is colored by the scaled SCAD prediction value after MinMaxScaler. d) Visualization of single cells by PCA plot, in which the SCAD prediction values of cells are stratified and colored by percentiles. e) Heatmap for the top15 up‐regulated genes in rank_Sens cells and the top15 up‐regulated genes in rank_Res cells. Only genes with the largest absolute IntegratedGradient attribution scores (the subset of genes whose contribution values fall in the <5% interval or >95% interval among all genes, abbreviated as outlier genes) are retained for differential expression analysis. f) Venn plot for the overlap of differentially expressed genes that is reported in a previous study (ref. [20]) and differential expression genes between rank_Sens and rank_Res cells in scRNA‐seq. The bulk_de is the shorthand for differentially expressed genes from the bulk RNA‐seq result in the previous study (ref. [20]); sc_sens refers to the predicted gene set that may make cells susceptible to drugs; sc_res refers to the potential gene biomarkers that contribute to drug resistance. g) Progression free survival (PFS) status prediction on GSE65021 cohort based on the expression level of biomarker genes from scRNA‐seq. Biomarkers are inferred from all SCC47 cells. The top 10% most Cetuximab‐sensitive cells and the top 10% most Cetuximab‐resistant cells are selected for differential expression analysis and biomarker inference.
Figure 5
Figure 5
Drug resistance ranking reveal potential drug combinations. a,e,i) The PCA plots of single cells that is colored by the ground truth label after the binarization of the EpiSen score. b,f,j) The PCA plots of single cells that is colored by the binarized (cutoff = median) SCAD prediction values. c,g,k) Visualization of single cells by PCA dimensional reduction which colored by the scaled SCAD prediction value after MinMaxScaler. d,h,l) Visualization of single cells by PCA dimensional reduction, in which the SCAD prediction values of cells are stratified and colored by percentiles.

Similar articles

Cited by

References

    1. Schwaederle M., Zhao M., Lee J. J., Eggermont A. M., Schilsky R. L., Mendelsohn J., Lazar V., Kurzrock R., J. Clin. Oncol. 2015, 33, 3817. - PMC - PubMed
    1. McGranahan N., Swanton C., Cell 2017, 168, 613. - PubMed
    1. Marusyk A., Janiszewska M., Polyak K., Cancer Cell 2020, 37, 471. - PMC - PubMed
    1. Carreira S., Romanel A., Goodall J., Grist E., Ferraldeschi R., Miranda S., Prandi D., Lorente D., Frenel J.‐S., Pezaro C., Omlin A., Rodrigues D. N., Flohr P., Tunariu N., de Bono J. S., Demichelis F., Attard G., Sci. Transl. Med. 2014, 6, 254ra125. - PMC - PubMed
    1. Wei W., Shin Y. S., Xue M., Matsutani T., Masui K., Yang H., Ikegami S., Gu Y., Herrmann K., Johnson D., Ding X., Hwang K., Kim J., Zhou J., Su Y., Li X., Bonetti B., Chopra R., James C. D., Cavenee W. K., Cloughesy T. F., Mischel P. S., Heath J. R., Gini B., Cancer Cell 2016, 29, 563. - PMC - PubMed

Publication types

LinkOut - more resources