. 2023 Mar 1;150(5):dev200839.
doi: 10.1242/dev.200839. Epub 2023 Mar 3.

Sp3 is essential for normal lung morphogenesis and cell cycle progression during mouse embryonic development

Affiliations

Sp3 is essential for normal lung morphogenesis and cell cycle progression during mouse embryonic development

Alyssa M McCoy et al. Development. .

Abstract

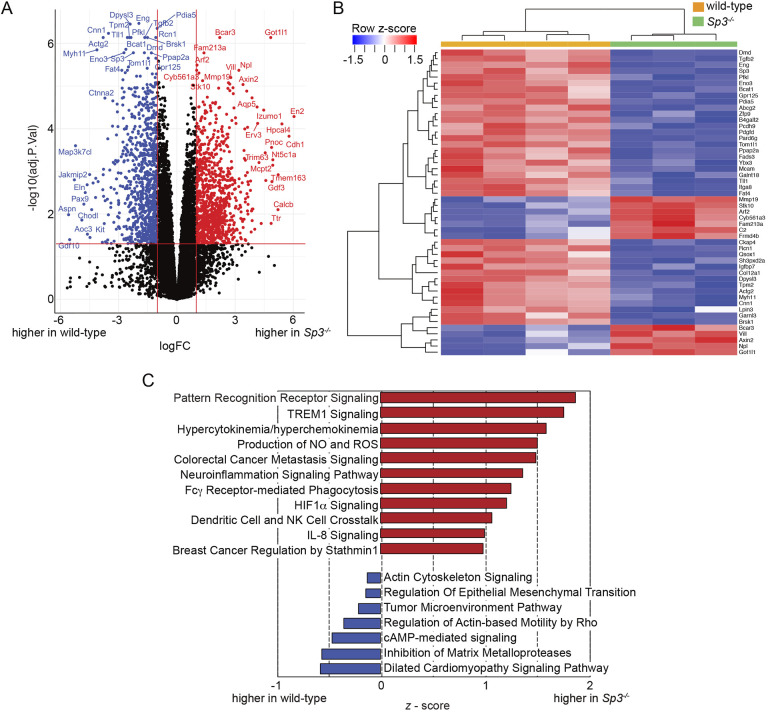
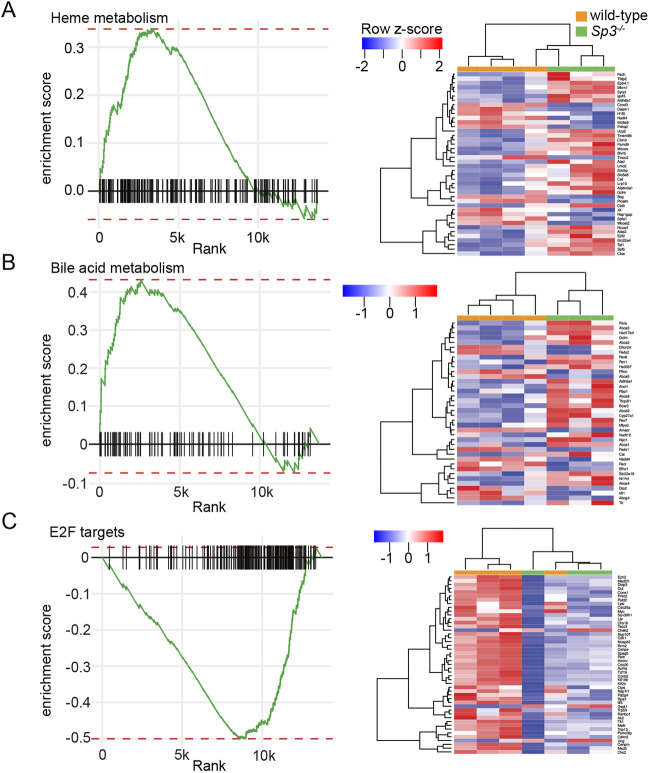
Members of the Sp family of transcription factors regulate gene expression via binding GC boxes within promoter regions. Unlike Sp1, which stimulates transcription, the closely related Sp3 can either repress or activate gene expression and is required for perinatal survival in mice. Here, we use RNA-seq and cellular phenotyping to show how Sp3 regulates murine fetal cell differentiation and proliferation. Homozygous Sp3-/- mice were smaller than wild-type and Sp+/- littermates, died soon after birth and had abnormal lung morphogenesis. RNA-seq of Sp3-/- fetal lung mesenchymal cells identified alterations in extracellular matrix production, developmental signaling pathways and myofibroblast/lipofibroblast differentiation. The lungs of Sp3-/- mice contained multiple structural defects, with abnormal endothelial cell morphology, lack of elastic fiber formation, and accumulation of lipid droplets within mesenchymal lipofibroblasts. Sp3-/- cells and mice also displayed cell cycle arrest, with accumulation in G0/G1 and reduced expression of numerous cell cycle regulators including Ccne1. These data detail the global impact of Sp3 on in vivo mouse gene expression and development.

Keywords: Alveolar development; Cell proliferation; Lipofibroblast; Lung mesenchyme; Myofibroblast; Transcriptional regulation.


Conflict of interest statement

Competing interests The authors declare no competing or financial interests.

Figures

Fig. 1.
Fig. 1.
Sp3 is required for normal lung growth and distal airway morphogenesis. (A) Gross appearance of WT, Sp3+/− and Sp3−/− embryos (E15 and E18) and neonates (PND0). (B) Sp3−/− embryos and neonates had shorter crown-rump length compared with WT and Sp3+/− littermates. Data are expressed as mean±s.e.m., n=4-10 mice for each genotype. **P<0.01 compared with WT using two-tailed unpaired t-test. (C) Gross appearance of WT and Sp3+/− E18 hearts and lungs. (D,E) Hematoxylin and Eosin-stained lung sections from E15, E18 and PND0 WT, Sp3+/− and Sp3−/− mice (D). Representative sections from littermates are shown. Lung morphometry measurements showed reduced airspace in Sp3−/− lungs at E18 and PND0 (E). Data expressed as mean±s.e.m., n=3-5 mice for each genotype at each time point. Number of random images analyzed for each genotype: E15, 17-24; E18, 26-27; PND0, 47-50. **P<0.01, ****P<0.0001 compared with WT at each time point using two-tailed unpaired t-test. (F,G) Reduced saccular airway branch formation in Sp3−/− fetal lung explants (F). E15 fetal lung explants were cultured for 72 h with images acquired at 24 and 72 h. Brightfield images show new branch formation and changes in branch morphology along the periphery. Sp3−/− explants developed fewer airways compared with WT and Sp3+/− explants (G). Data expressed as mean±s.e.m. Explants were isolated from five separate litters, with 6-15 embryos per genotype; 39-106 explants analyzed. Representative images are shown. *P<0.05 versus WT using two-tailed unpaired t-test. (H,I) Increased interstitium in Sp3−/− E15 fetal lung explants. Images were obtained 24 h after culture and peripheral interstitial regions were measured using ImageJ. Representative images are shown in H. Scale bar: 20 μm. Box and whisker plots of measurements are shown in I. Plots show median values (middle bars) and first to third interquartile ranges (boxes); whiskers indicated 1.5 times the interquartile ranges; dots indicate outliers. ****P<0.001 versus WT using two-tailed unpaired t-test. WT, 96 measurements were included; Sp3−/−, 68 measurements. (J) Time lapse images of E12 lungs cultured for 72 h. (K) Total branch number for each E12 lung measured every 12 h. The number of new branches formed in each lung during every 12 h period in WT and Sp3−/− lungs was calculated and compared using the Wilcoxon signed rank test (n=42 for WT, 24 for Sp3−/−; P=0.03).
Fig. 2.
Fig. 2.
Differential gene expression in Sp3−/− fetal lung mesenchymal cells. (A) Volcano plot showing differentially expressed genes in WT and Sp3−/− fetal lung mesenchymal cells. Red, genes upregulated in Sp3−/− cells (adjusted P-value <0.05 and |log2FoldChange|>1); blue, genes downregulated in Sp3−/− cells (adjusted P-value <0.05 and |log2FoldChange|>1). (B) Unsupervised hierarchically clustered heatmap with normalized expression (z-score) of 50 most differentially expressed genes when comparing WT with Sp3−/− RNA-seq datasets. Data for each replicate are shown (n=3 for Sp3−/− cells, n=4 for WT cells). Raw count data was transformed to log2-counts per million followed by TMM-normalization before differential expression analysis using the limma-voom method. (C) IPA of differentially expressed genes. Categories of transcripts more enriched in Sp3−/− cells are shown in red with a z-score>0. Categories higher in WT cells are shown in blue with z-score<0.
Fig. 3.
Fig. 3.
GSEA analysis of differentially expressed genes in WT and Sp3−/− cells. (A-C) GSEA of differentially expressed transcripts in Sp3−/− and WT cells revealed enriched gene sets related to heme metabolism (A), bile acid metabolism (B) and E2F targets (C). Heat maps showing normalized expression of leading-edge transcripts shown in right panels for each GSEA category. n=3 for Sp3−/−, n=4 for WT.
Fig. 4.
Fig. 4.
Impact of Sp3 deletion on specific mesenchymal gene categories. (A-D) Lists of transcripts related to extracellular matrix (A), developmental signaling (B), myofibroblast markers (C) and lipofibroblast markers (D) were analyzed in WT and Sp3−/− samples. Heat maps of differentially expressed genes within each category are shown in left panels. Transcripts expressed at higher normalized levels are indicated in red and lower levels in blue. For select genes, individual normalized CPM for each replicate are shown in right panels. n=3 for Sp3−/−, n=4 for WT.
Fig. 5.
Fig. 5.
Sp3 is required for normal vascular development in mouse lungs. (A) Three adjacent subnetworks identified from network analysis of Sp3−/− and WT differentially expressed genes were identified with biological properties related to cell-matrix interactions, tissue structure, and blood vessel development. GO terms of differentially expressed node members are shown to the right. (B-D) Altered endothelial cell morphology in Sp3−/− lungs at E15 (B), E18 (C) and PND0 (D). Sections labeled with DAPI (cyan), anti-α-SMA (yellow) and anti-PECAM1 (magenta) and imaged by confocal microscopy. Maximum z-projections of anti-PECAM1 labeling corresponding to the area outlined in white are shown at the right of each panel. White arrows indicate endothelial cells with rounder morphology in Sp3−/− lungs. Images shown are representative of samples from three separate litters.
Fig. 6.
Fig. 6.
Disruption of myofibroblast morphology and elastic fibers in Sp3−/− mouse lungs. (A-F) Lung sections from PND0 WT (A-C) and Sp3−/− (D-F) mice were stained with antibodies against α-SMA (yellow) to label airway smooth muscle and myofibroblasts, PECAM1 (magenta) to label endothelial cells and DAPI to label nuclei (cyan). Sections were imaged by confocal microscopy and images are representative of samples from three independent litters. Maximum z-projections of anti-α-SMA labeling are shown in B,C,E and F with areas outlined by white in B and E shown at higher magnification in C and F, respectively. White arrows highlight cells with different α-SMA staining patterns. (G-J) Lung sections from PND0 WT (G,H) and Sp3−/− (I,J) mice were stained using a modified Hart's stain to visualize elastic fibers. Areas outlined by boxes in G and I are shown at higher magnification in H and J. Arrows in H and J highlight differences in fiber appearance between WT and Sp3−/− samples. Images are representative of samples from three independent litters.
Fig. 7.
Fig. 7.
Deletion of Sp3 increased lipid accumulation in mouse lungs. (A) Subnetwork related to lipid and lipoprotein metabolism, with upregulated genes in Sp3−/− samples compared with WT indicated in red and downregulated genes shown in blue. (B) GO categories enriched for differentially expressed genes in this subnetwork. (C) Oil Red O staining of WT and Sp3−/− E18 and PND0 lung sections demonstrated more abundant and widespread lipid droplets throughout the lung interstitium of Sp3−/− mice. Areas outlined in boxes are shown at higher magnification in panels to the right. Images are representative of samples taken from three different litters. (D,E) Lung sections from E18 (D) and PND0 (E) WT and Sp3−/− mice were stained with antibodies against HOPX to label AT1 cells (yellow), surfactant protein C to label AT2 cells (SPC, magenta) and DAPI to label nuclei (cyan). Sections were imaged by confocal microscopy and images are representative of samples from three independent litters.
Fig. 8.
Fig. 8.
Sp3 is required for normal cell proliferation. (A,B) E18 WT (A) and Sp3−/− (B) liver sections were immunolabeled with an antibody against the mitotic cell marker phosphohistone H3 (PHH3, green). Nuclei were labeled with DRAQ5 (blue). Images were acquired by confocal microscopy. (C) Percentages of anti-PHH3+ cells were lower in Sp3−/− livers. Data are expressed as mean±s.e.m. Embryos from three separate litters were examined for each genotype, with 24 images acquired for each sample. ****P<0.0001 using two-tailed unpaired t-test. (D-G) Phase-contrast images of fetal lung mesenchymal cells from SV40ts and SV40ts-Sp3−/− mice cultured at 33°C (D,E) or transitioned to 37°C for 5 days (F,G). Representative images shown. (H,I) After culture at 37°C, SV40ts (orange) and SV40ts-Sp3−/− (green) cells were labeled with propidium iodide and analyzed by FACS. A representative FACS histogram is shown in H. Quantification of cell frequency within each cell cycle phase is shown in I. Data are shown as mean±s.e.m. N=3 independent experiments. *P<0.05 using two-tailed unpaired t-test.
Fig. 9.
Fig. 9.
Sp3 regulates expression of cell cycle regulators. (A) Subnetwork with differentially expressed genes involved in cell cycle regulation. Genes upregulated in Sp3−/− cells are shown in red, genes downregulated are shown in blue. (B) GO categories of enriched differentially expressed genes in this subnetwork. (C) Heat map of known cell cycle regulators showing differential expression, with majority of transcripts downregulated in Sp3−/− cells. Ccne1 (encoding cyclin E) is highlighted. (D) Normalized counts per million for Ccne1 shown for each RNA-seq replicate. (E) Gene structure of the mouse Ccne1 gene shown with Sp1 ChIP seq peaks concentrated around the promoter/enhancer region. Data from publicly available datasets via UCSC Genome Browser (mm39). (F) cyclin E immunoblot of E15 lung and E15 liver tissue homogenates from WT and Sp3−/− littermates. β-Actin shown as loading control. Densitometry of cyclin E bands (normalized to β-actin) showed lower expression in Sp3−/− liver samples compared with WT. Immunoblot is representative of three independent replicates. Data for each replicate are shown (n=3). ***P<0.001 using two-tailed unpaired t-test. (G) Cyclin E immunoblot of fetal lung mesenchymal cell lysates from SV40ts (WT) and SV40ts-Sp3−/− (Sp3−/−) mice. Cells were cultured at 37°C in the absence of IFN-γ for at least 5 days before cell lysis. β-Actin shown as loading control. Densitometry of cyclin E (normalized to β-actin) shows reduced expression in Sp3 mutant cells. Immunoblot is representative of 3-4 independent replicates. Data for each replicate are shown (n=4 for SV40ts, n=3 for SV40ts-Sp3−/−). *P<0.05 using two-tailed unpaired t-test.

Similar articles

Cited by

References

    1. Armulik, A., Genove, G. and Betsholtz, C. (2011). Pericytes: developmental, physiological, and pathological perspectives, problems, and promises. Dev. Cell 21, 193-215. 10.1016/j.devcel.2011.07.001 - DOI - PubMed
    1. Barkauskas, C. E., Cronce, M. J., Rackley, C. R., Bowie, E. J., Keene, D. R., Stripp, B. R., Randell, S. H., Noble, P. W. and Hogan, B. L. (2013). Type 2 alveolar cells are stem cells in adult lung. J. Clin. Invest. 123, 3025-3036. 10.1172/JCI68782 - DOI - PMC - PubMed
    1. Bhuiyan, T. and Timmers, H. T. M. (2019). Promoter recognition: putting TFIID on the spot. Trends Cell Biol. 29, 752-763. 10.1016/j.tcb.2019.06.004 - DOI - PubMed
    1. Birnbaum, M. J., Van Wijnen, A. J., Odgren, P. R., Last, T. J., Suske, G., Stein, G. S. and Stein, J. L. (1995). Sp1 trans-activation of cell cycle regulated promoters is selectively repressed by Sp3. Biochemistry 34, 16503-16508. 10.1021/bi00050a034 - DOI - PubMed
    1. Blondel, V. D., Guillaume, J.-L., Lambiotte, R. and Lefebvre, E. (2008). Fast unfolding of communities in large networks. "J. Stat. Mech., Theory Exp." 2008, P10008. 10.1088/1742-5468/2008/10/P10008 - DOI

Publication types

Substances