

In situ ligand restraints from quantum-mechanical methods
- PMID: 36762856
- PMCID: PMC9912925
- DOI: 10.1107/S2059798323000025
In situ ligand restraints from quantum-mechanical methods
Abstract
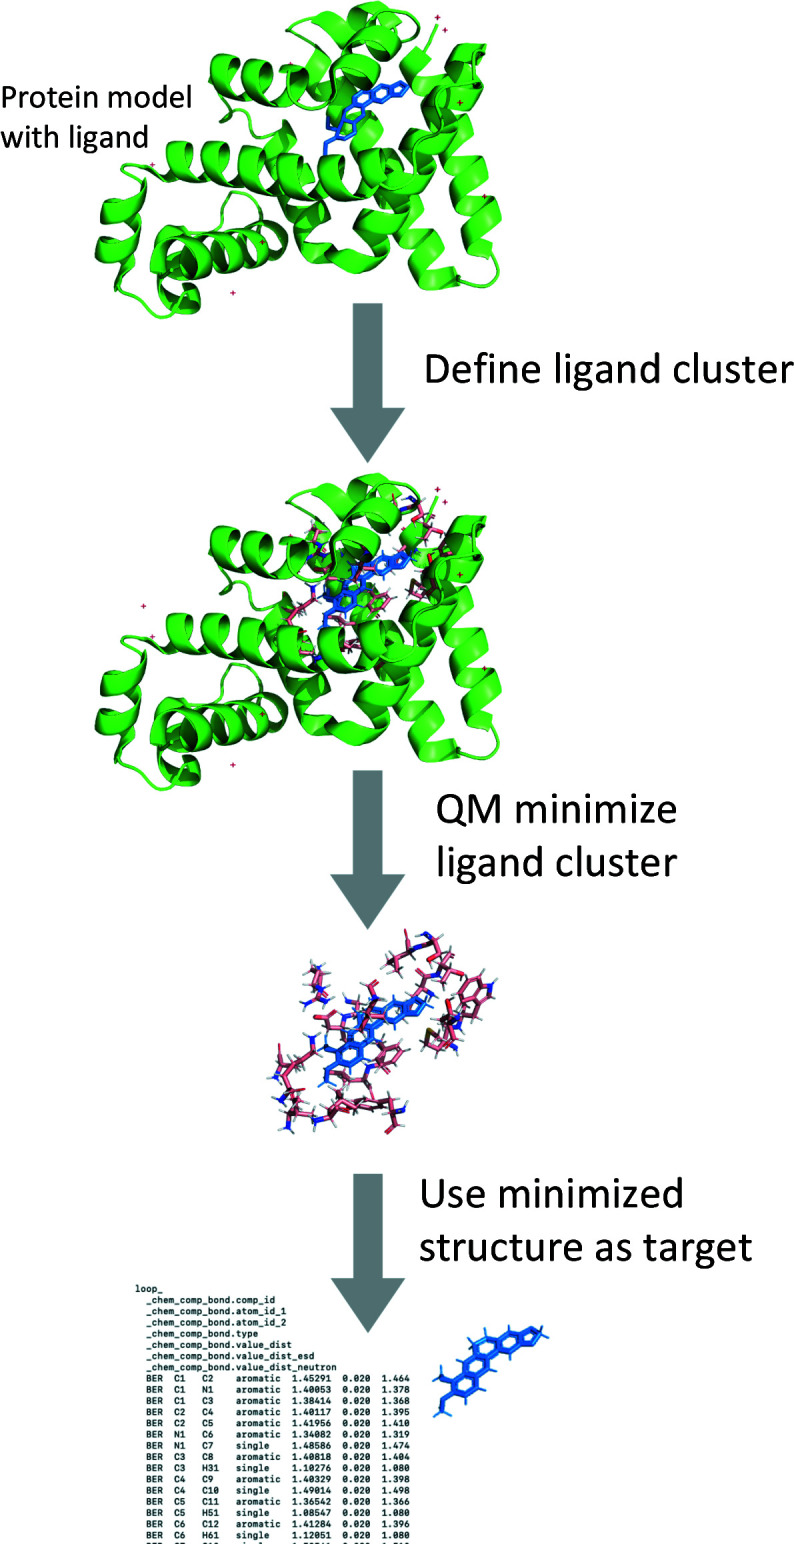
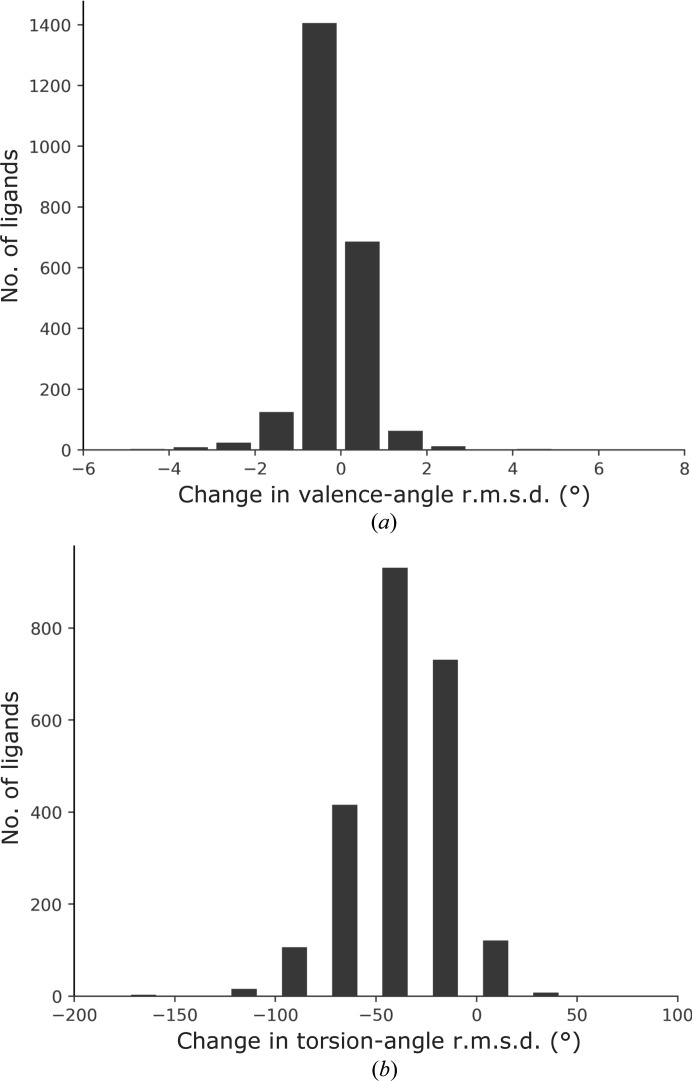
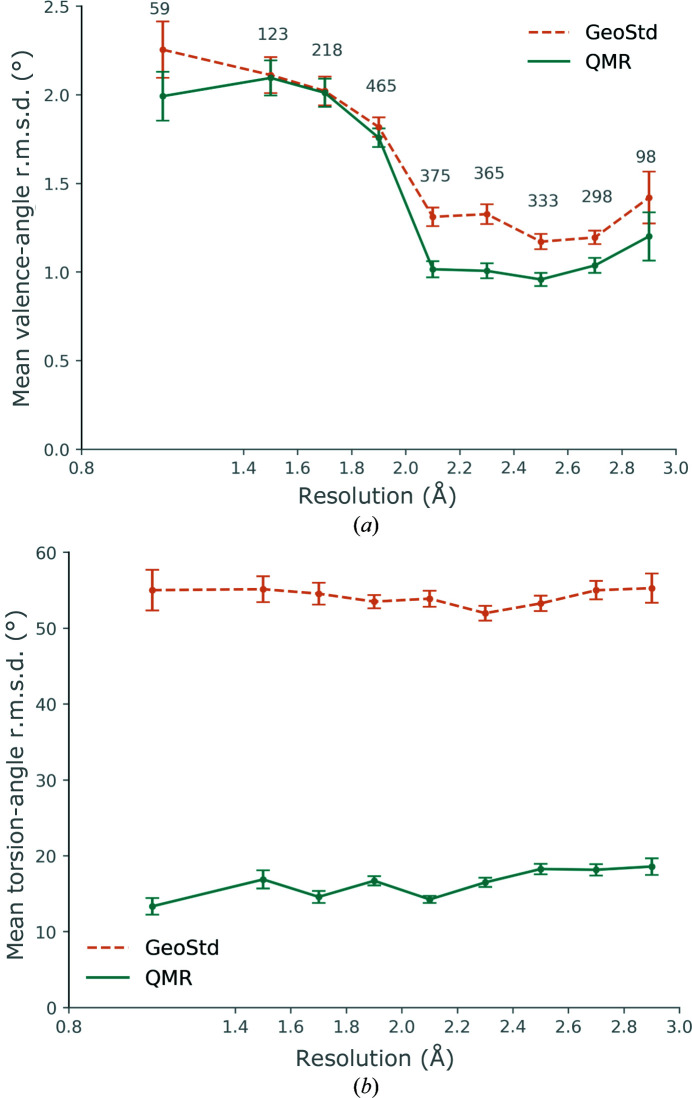
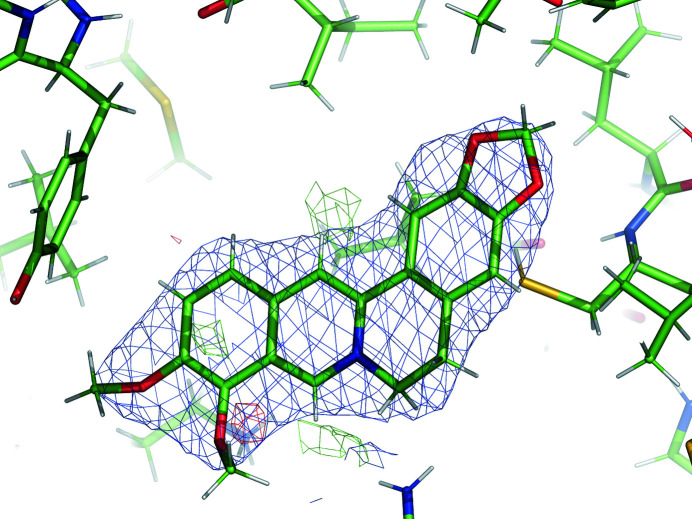
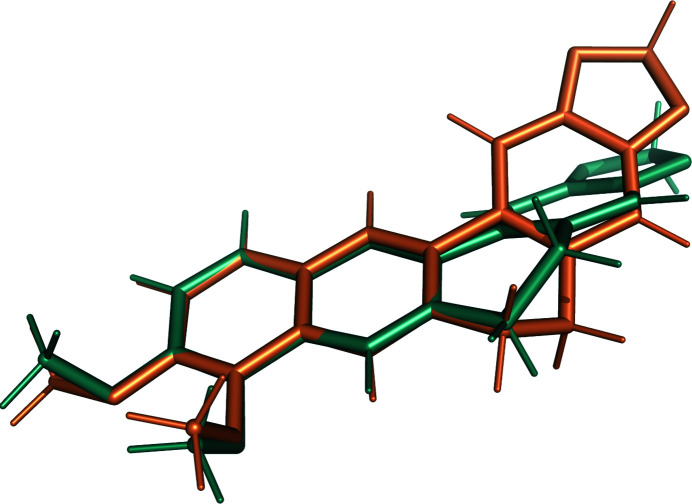
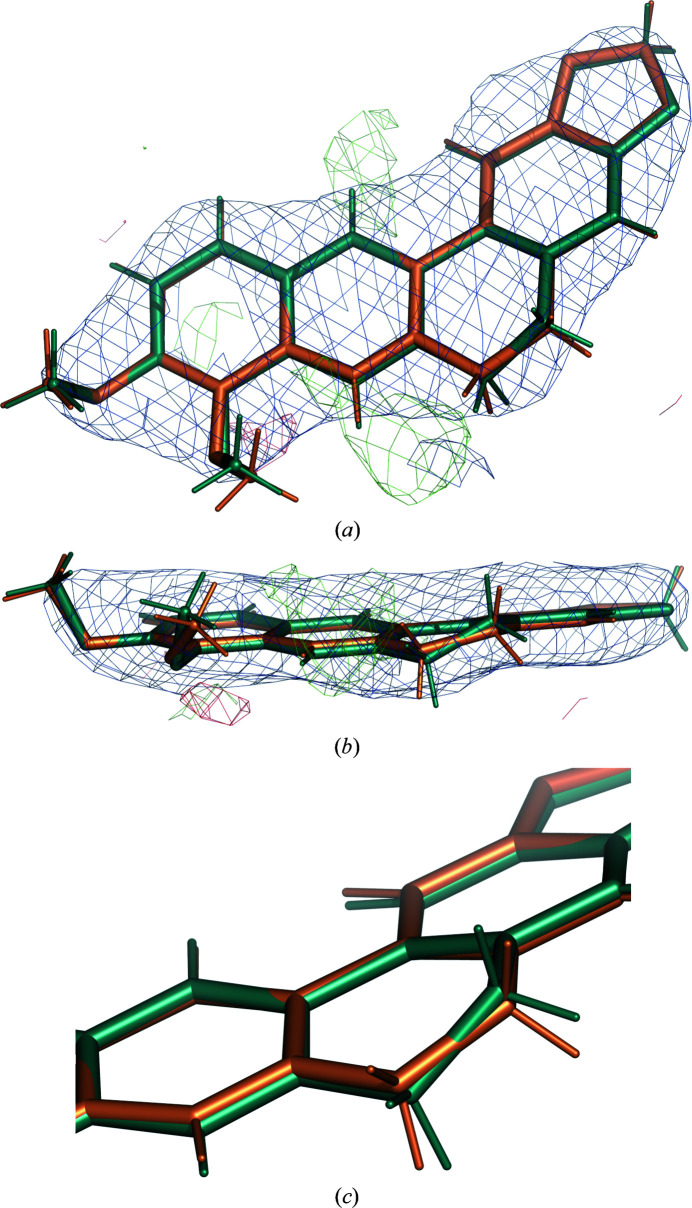
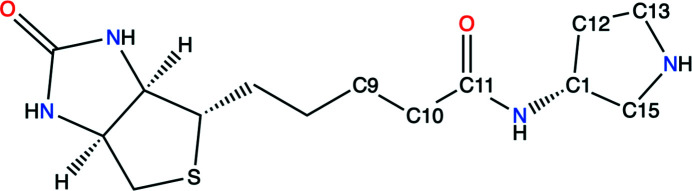
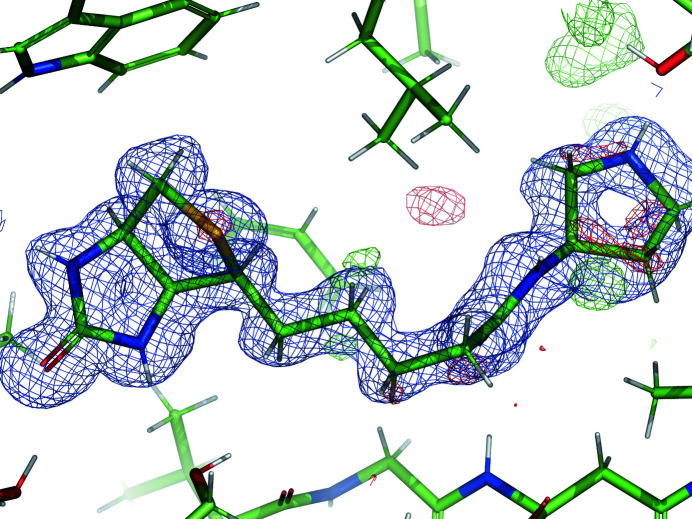
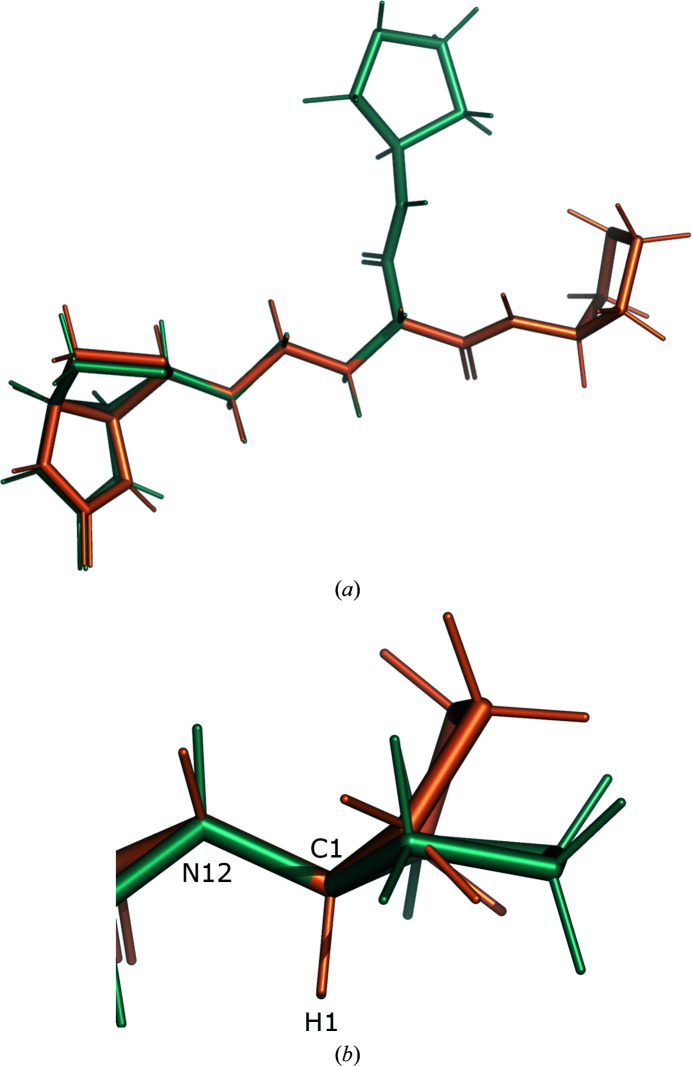
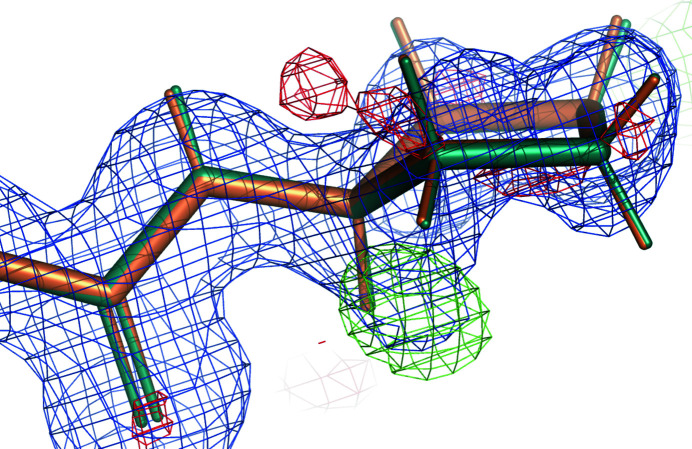
In macromolecular crystallographic structure refinement, ligands present challenges for the generation of geometric restraints due to their large chemical variability, their possible novel nature and their specific interaction with the binding pocket of the protein. Quantum-mechanical approaches are useful for providing accurate ligand geometries, but can be plagued by the number of minima in flexible molecules. In an effort to avoid these issues, the Quantum Mechanical Restraints (QMR) procedure optimizes the ligand geometry in situ, thus accounting for the influence of the macromolecule on the local energy minima of the ligand. The optimized ligand geometry is used to generate target values for geometric restraints during the crystallographic refinement. As demonstrated using a sample of >2330 ligand instances in >1700 protein-ligand models, QMR restraints generally result in lower deviations from the target stereochemistry compared with conventionally generated restraints. In particular, the QMR approach provides accurate torsion restraints for ligands and other entities.
Keywords: Quantum Mechanical Restraints; ligand restraints; macromolecular crystallography; quantum mechanics; refinement.
open access.
Figures
Similar articles
-
High-throughput quantum-mechanics/molecular-mechanics (ONIOM) macromolecular crystallographic refinement with PHENIX/DivCon: the impact of mixed Hamiltonian methods on ligand and protein structure.Acta Crystallogr D Struct Biol. 2018 Nov 1;74(Pt 11):1063-1077. doi: 10.1107/S2059798318012913. Epub 2018 Oct 29. Acta Crystallogr D Struct Biol. 2018. PMID: 30387765 Free PMC article.
-
Accurate macromolecular crystallographic refinement: incorporation of the linear scaling, semiempirical quantum-mechanics program DivCon into the PHENIX refinement package.Acta Crystallogr D Biol Crystallogr. 2014 May;70(Pt 5):1233-47. doi: 10.1107/S1399004714002260. Epub 2014 Apr 26. Acta Crystallogr D Biol Crystallogr. 2014. PMID: 24816093 Free PMC article.
-
Improved ligand geometries in crystallographic refinement using AFITT in PHENIX.Acta Crystallogr D Struct Biol. 2016 Sep;72(Pt 9):1062-72. doi: 10.1107/S2059798316012225. Epub 2016 Aug 31. Acta Crystallogr D Struct Biol. 2016. PMID: 27599738 Free PMC article.
-
Keep it together: restraints in crystallographic refinement of macromolecule-ligand complexes.Acta Crystallogr D Struct Biol. 2017 Feb 1;73(Pt 2):93-102. doi: 10.1107/S2059798316017964. Epub 2017 Feb 1. Acta Crystallogr D Struct Biol. 2017. PMID: 28177305 Free PMC article. Review.
-
Combining crystallography with quantum mechanics.Curr Opin Struct Biol. 2022 Feb;72:18-26. doi: 10.1016/j.sbi.2021.07.002. Epub 2021 Aug 12. Curr Opin Struct Biol. 2022. PMID: 34392061 Review.
Cited by
-
CryoEM structures of the human CLC-2 voltage-gated chloride channel reveal a ball-and-chain gating mechanism.Elife. 2024 Feb 12;12:RP90648. doi: 10.7554/eLife.90648. Elife. 2024. PMID: 38345841 Free PMC article.
-
Expanding automated multiconformer ligand modeling to macrocycles and fragments.Elife. 2025 Jun 30;14:RP103797. doi: 10.7554/eLife.103797. Elife. 2025. PMID: 40586518 Free PMC article.
-
Quantum refinement in real and reciprocal space using the Phenix and ORCA software.IUCrJ. 2024 Nov 1;11(Pt 6):921-937. doi: 10.1107/S2052252524008406. IUCrJ. 2024. PMID: 39345101 Free PMC article.
-
Expanding Automated Multiconformer Ligand Modeling to Macrocycles and Fragments.bioRxiv [Preprint]. 2025 Apr 30:2024.09.20.613996. doi: 10.1101/2024.09.20.613996. bioRxiv. 2025. Update in: Elife. 2025 Jun 30;14:RP103797. doi: 10.7554/eLife.103797. PMID: 39386683 Free PMC article. Updated. Preprint.
-
CryoEM structures of the human CLC-2 voltage gated chloride channel reveal a ball and chain gating mechanism.bioRxiv [Preprint]. 2023 Nov 29:2023.08.13.553136. doi: 10.1101/2023.08.13.553136. bioRxiv. 2023. Update in: Elife. 2024 Feb 12;12:RP90648. doi: 10.7554/eLife.90648. PMID: 37645939 Free PMC article. Updated. Preprint.
References
-
- Borbulevych, O. Y., Moriarty, N. W., Adams, P. D. & Westerhoff, L. M. (2014). Comput. Crystallogr. Newsl. 5, 26–30.
-
- Bruno, I. J., Cole, J. C., Kessler, M., Luo, J., Motherwell, W. D. S., Purkis, L. H., Smith, B. R., Taylor, R., Cooper, R. I., Harris, S. E. & Orpen, A. G. (2004). J. Chem. Inf. Comput. Sci. 44, 2133–2144. - PubMed
