

Single-Molecule Two-Color Coincidence Detection of Unlabeled alpha-Synuclein Aggregates
- PMID: 36762870
- PMCID: PMC10946743
- DOI: 10.1002/anie.202216771
Single-Molecule Two-Color Coincidence Detection of Unlabeled alpha-Synuclein Aggregates
Abstract
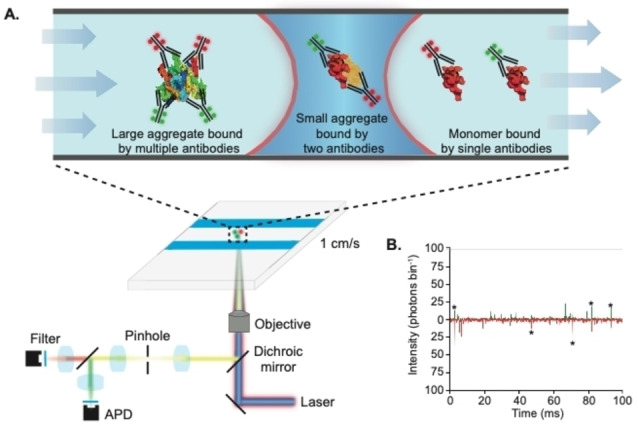
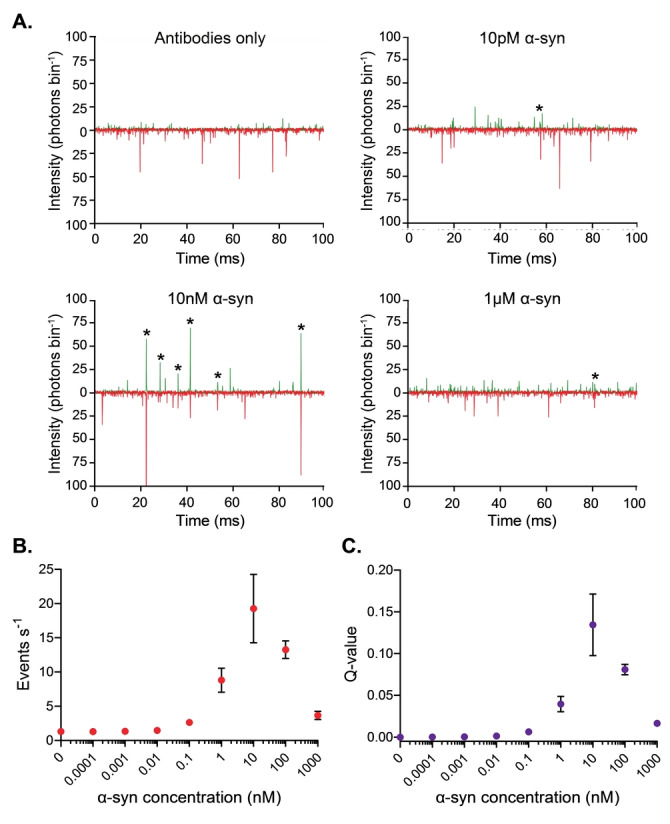
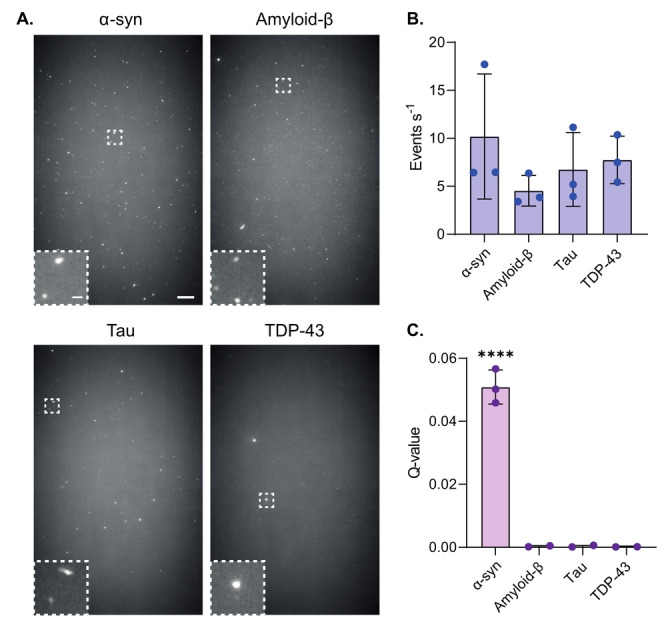
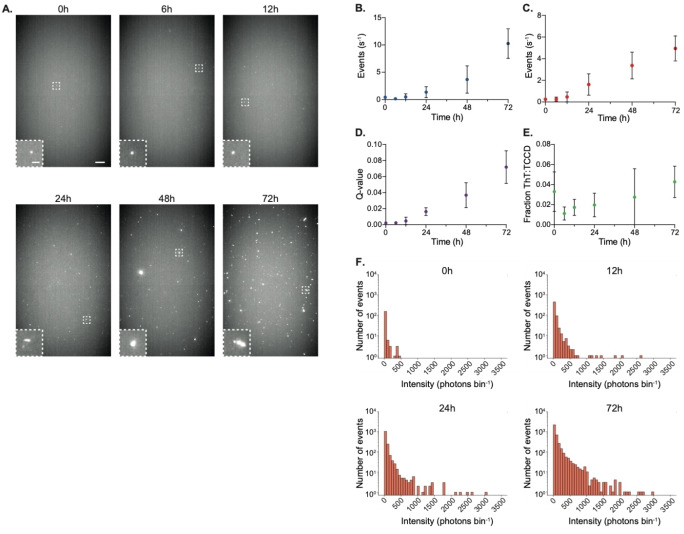
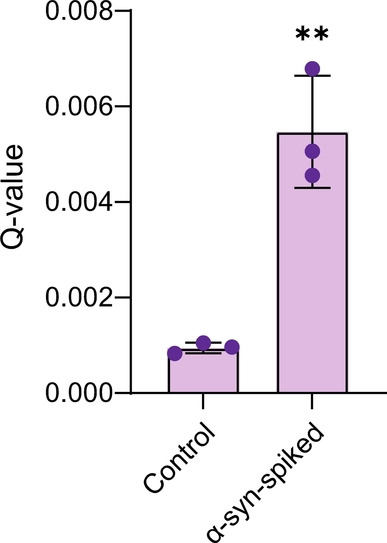
Protein misfolding and aggregation into oligomeric and fibrillar structures is a common feature of many neurogenerative disorders. Single-molecule techniques have enabled characterization of these lowly abundant, highly heterogeneous protein aggregates, previously inaccessible using ensemble averaging techniques. However, they usually rely on the use of recombinantly-expressed labeled protein, or on the addition of amyloid stains that are not protein-specific. To circumvent these challenges, we have made use of a high affinity antibody labeled with orthogonal fluorophores combined with fast-flow microfluidics and single-molecule confocal microscopy to specifically detect α-synuclein, the protein associated with Parkinson's disease. We used this approach to determine the number and size of α-synuclein aggregates down to picomolar concentrations in biologically relevant samples.
Keywords: Aggregation or Oligomerization; Fluorescence; Microscopy; Proteins; Single-Molecule.
© 2023 The Authors. Angewandte Chemie International Edition published by Wiley-VCH GmbH.
Conflict of interest statement
The authors declare no conflict of interest.
Figures
References
-
- Spillantini M. G., Schmidt M. L., Lee V. M.-Y., Trojanowski J. Q., Jakes R., Goedert M., Nature 1997, 388, 839–840. - PubMed
-
- Polymeropoulos M. H., Lavedan C., Leroy E., Ide S. E., Dehejia A., Dutra A., Pike B., Root H., Rubenstein J., Boyer R., Stenroos E. S., Chandrasekharappa S., Athanassiadou A., Papapetropoulos T., Johnson W. G., Lazzarini A. M., Duvoisin R. C., Di Iorio G., Golbe L. I., Nussbaum R. L., Science 1997, 276, 2045–2047. - PubMed
-
- Zarranz J. J., Alegre J., Gómez-Esteban J. C., Lezcano E., Ros R., Ampuero I., Vidal L., Hoenicka J., Rodriguez O., Atarés B., Llorens V., Gomez Tortosa E., del Ser T., Muñoz D. G., de Yebenes J. G., Ann. Neurol. 2004, 55, 164–173. - PubMed
-
- Lesage S., Anheim M., Letournel F., Bousset L., Honoré A., Rozas N., Pieri L., Madiona K., Dürr A., Melki R., Verny C., Brice A., Ann. Neurol. 2013, 73, 459–471. - PubMed
-
- Singleton B., Farrer M., Johnson J., Singleton A., Hague S., Kachergus J., Hulihan M., Peuralinna T., Dutra A., Nussbaum R., Lincoln S., Crawley A., Hanson M., Maraganore D., Adler C., Cookson M. R., Muenter M., Baptista M., Miller D., Blancato J., Hardy J., Gwinn-Hardy K., Science 2003, 302, 841. - PubMed
Publication types
MeSH terms
Substances
Grants and funding
LinkOut - more resources
Full Text Sources
Medical
