Comparison of mortality according to baseline, first year, and mean albumin levels in peritoneal dialysis: a retrospective study
- PMID: 36762995
- PMCID: PMC9930840
- DOI: 10.1080/0886022X.2023.2176165
Comparison of mortality according to baseline, first year, and mean albumin levels in peritoneal dialysis: a retrospective study
Abstract
Background: The relationship between hypoalbuminemia in peritoneal dialysis (PD) and mortality, risk of peritonitis, and decreased residual renal function (RRF) is known. However, we have not encountered a comprehensive study on which of the mean albumin values, at the beginning of peritoneal dialysis, in the first year, and during the peritoneal dialysis period, provide more predictive predictions regarding mortality, peritonitis risk, and RRF reduction.
Methods: A total of 407 PD patients in whom PD was initiated and followed up and PD was terminated were included in the study. Albumin levels, peritonitis, and RRF at the beginning of PD and at 3-month periods during PD were recorded.
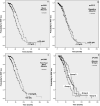
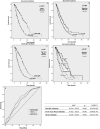
Results: In the evaluation of the patients, there was a significant relationship between mean, first-year albumin values in RRF loss (p = 0.001, p = 0.006, respectively) and peritonitis (p < 0.001), but no significant correlation was found with baseline albumin values (p = 0.213, p = 0.137, respectively). In the comparison of mortality ROC analysis of PD patients, a significant correlation was found with mortality at baseline, first year, and mean albumin values (p < 0.001). However, in the multivariate Cox regression analysis, it was determined that there was a more significant relationship between first-year albumin and mean albumin values compared to baseline albumin values (HR 0.918 [95% CI 0.302-0.528] (p < 0.001)), (HR 1.161 [95% CI 0.229-0.429] (p < 0.001)), (HR 0.081 [95% CI 0.718-1.184] (p = 0.525)).
Conclusions: In conclusion, mean and first-year mean albumin levels provide more determinative predictions for mortality, risk of peritonitis, and maintenance of residual renal functions in peritoneal dialysis patients compared to baseline albumin.
Keywords: Peritoneal dialysis; albumin level; mortality; peritonitis.
Conflict of interest statement
No potential conflict of interest was reported by the author(s).
Figures


References
-
- Li PKT, Chow KM, van de Luijtgaarden MWM, et al. . Changes in the worldwide epidemiology of peritoneal dialysis. Nat Rev Nephrol. 2017;13(2):90–103. - PubMed
-
- Singh T, Astor BC, Waheed S.. End-stage renal disease patients with low serum albumin: ıs peritoneal dialysis an option? Perit Dial Int. 2019;39(6):562–567. - PubMed
MeSH terms
Substances
LinkOut - more resources
Full Text Sources
Medical
