. 2023 May 1;4(3):180-207.
doi: 10.1158/2643-3230.BCD-22-0086.

In Vivo Screening Unveils Pervasive RNA-Binding Protein Dependencies in Leukemic Stem Cells and Identifies ELAVL1 as a Therapeutic Target

Affiliations

In Vivo Screening Unveils Pervasive RNA-Binding Protein Dependencies in Leukemic Stem Cells and Identifies ELAVL1 as a Therapeutic Target

Ana Vujovic et al. Blood Cancer Discov. .

Abstract

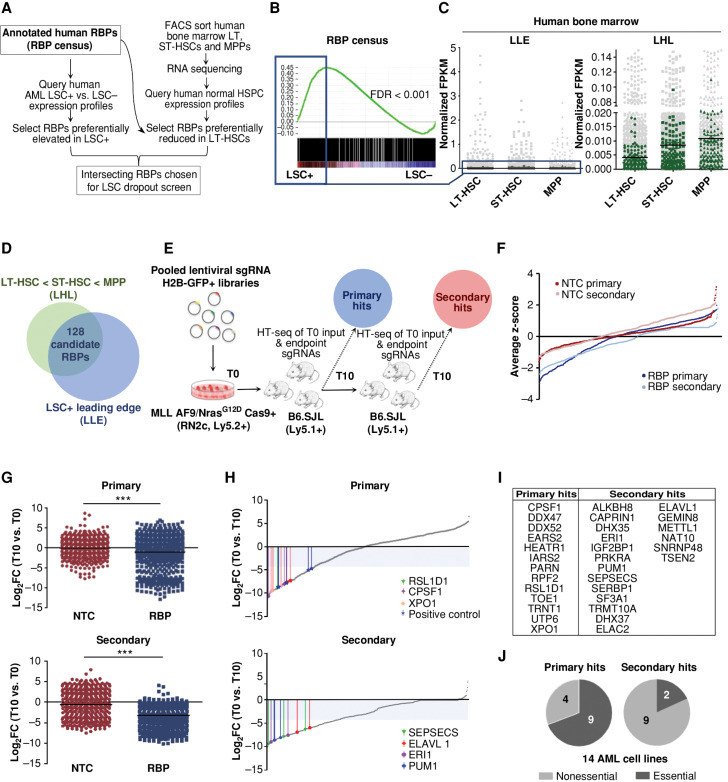
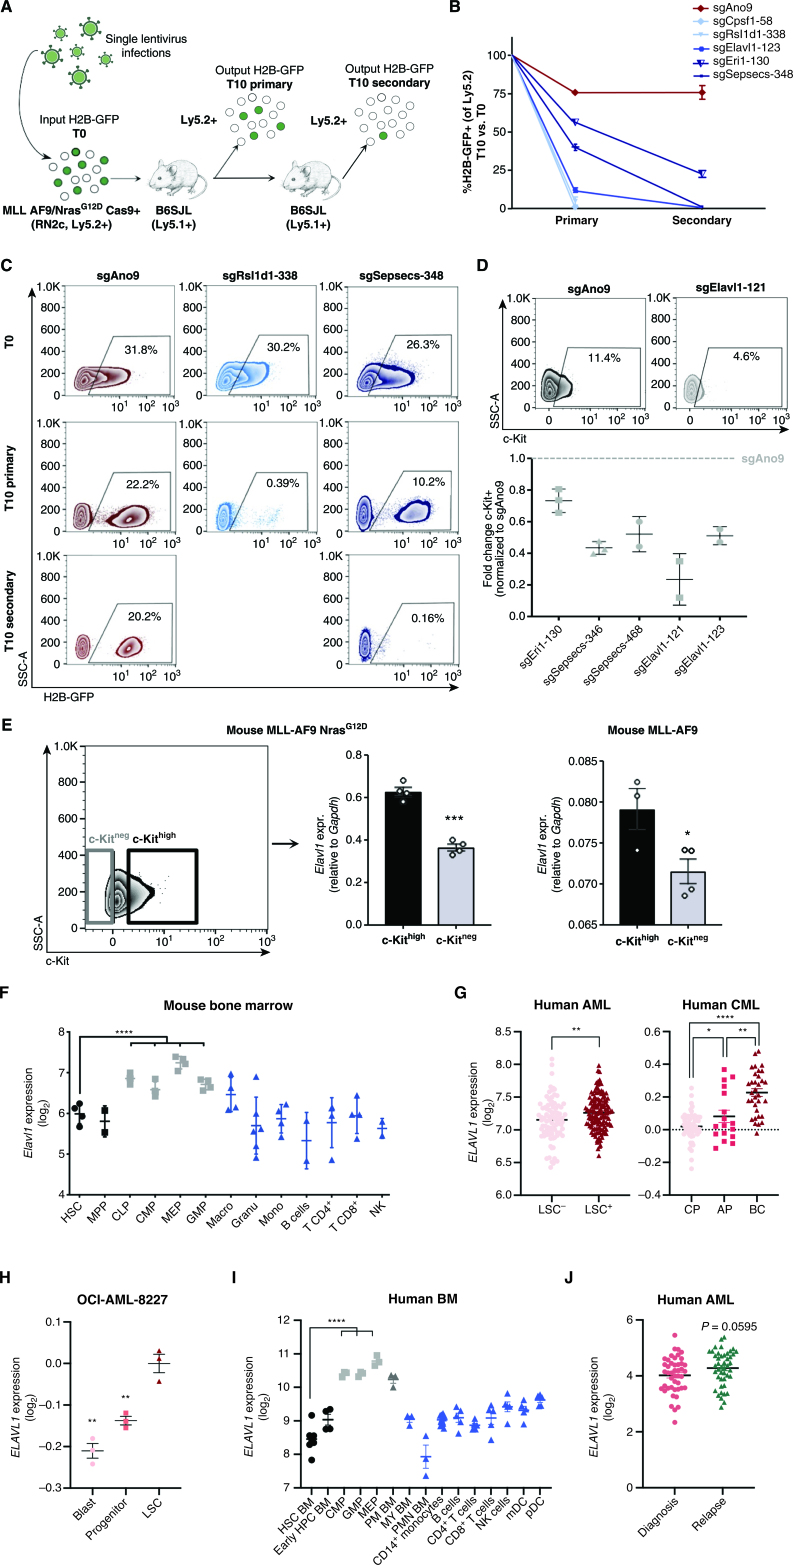
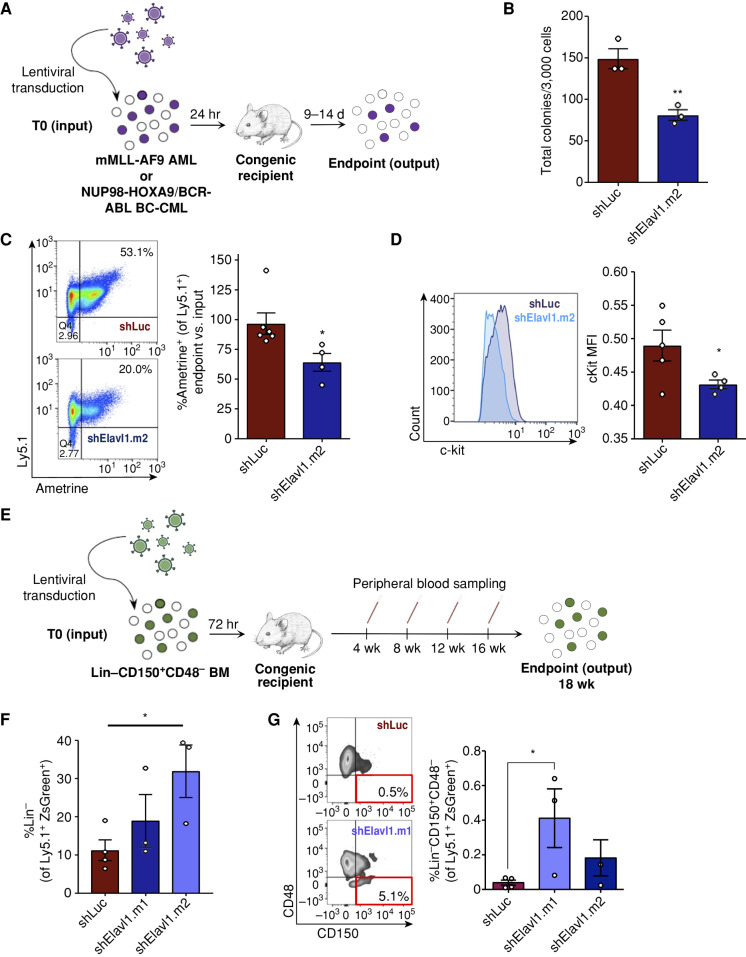
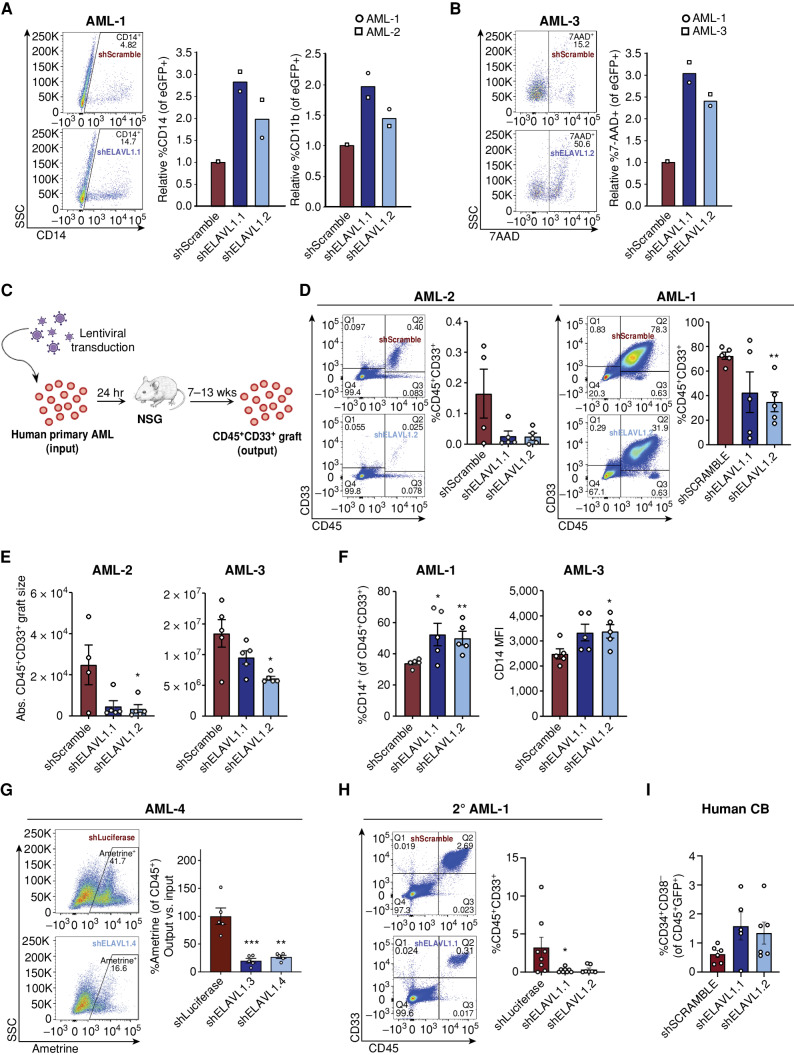
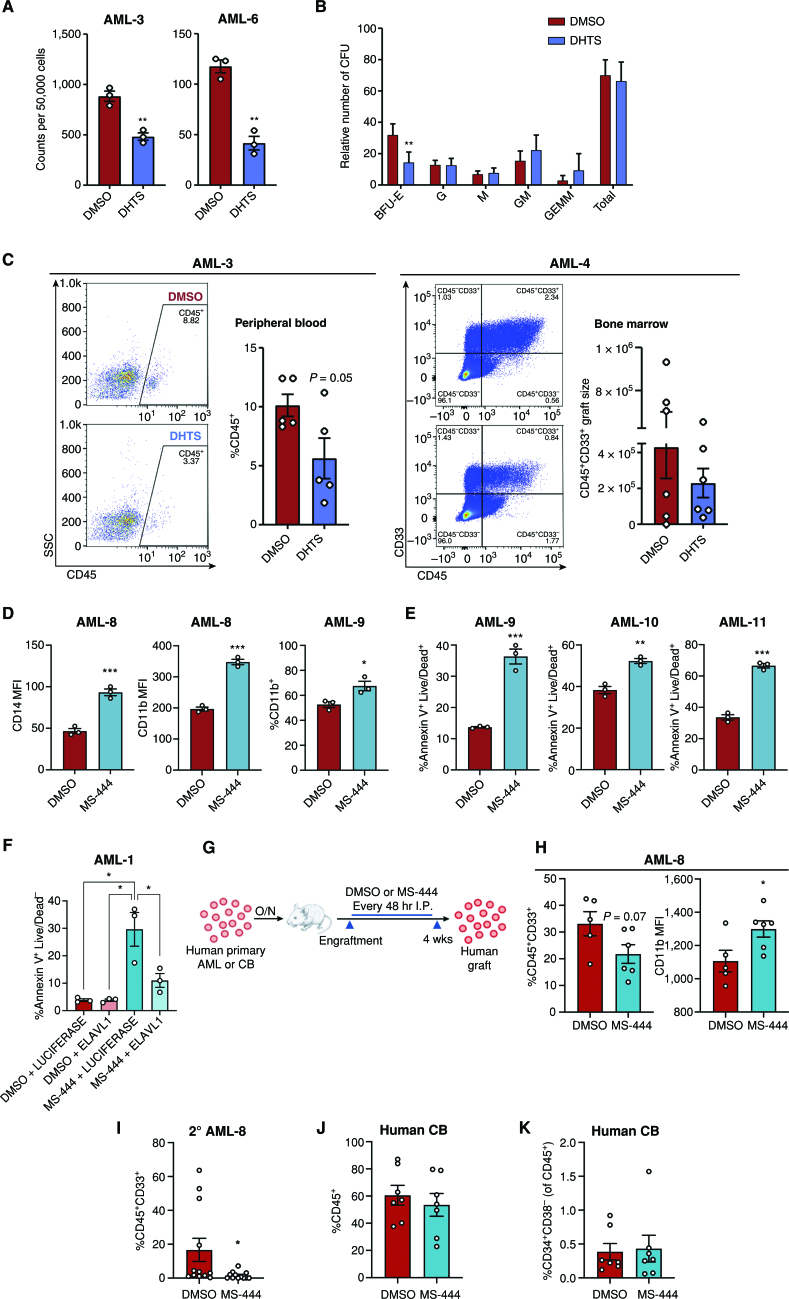
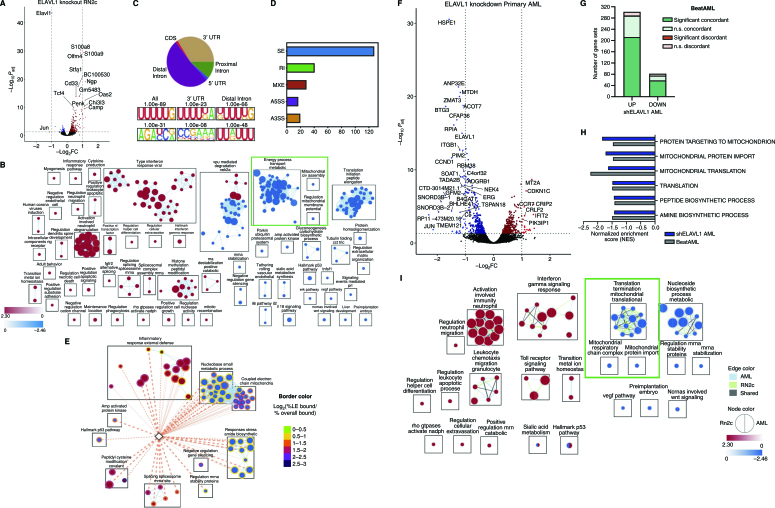
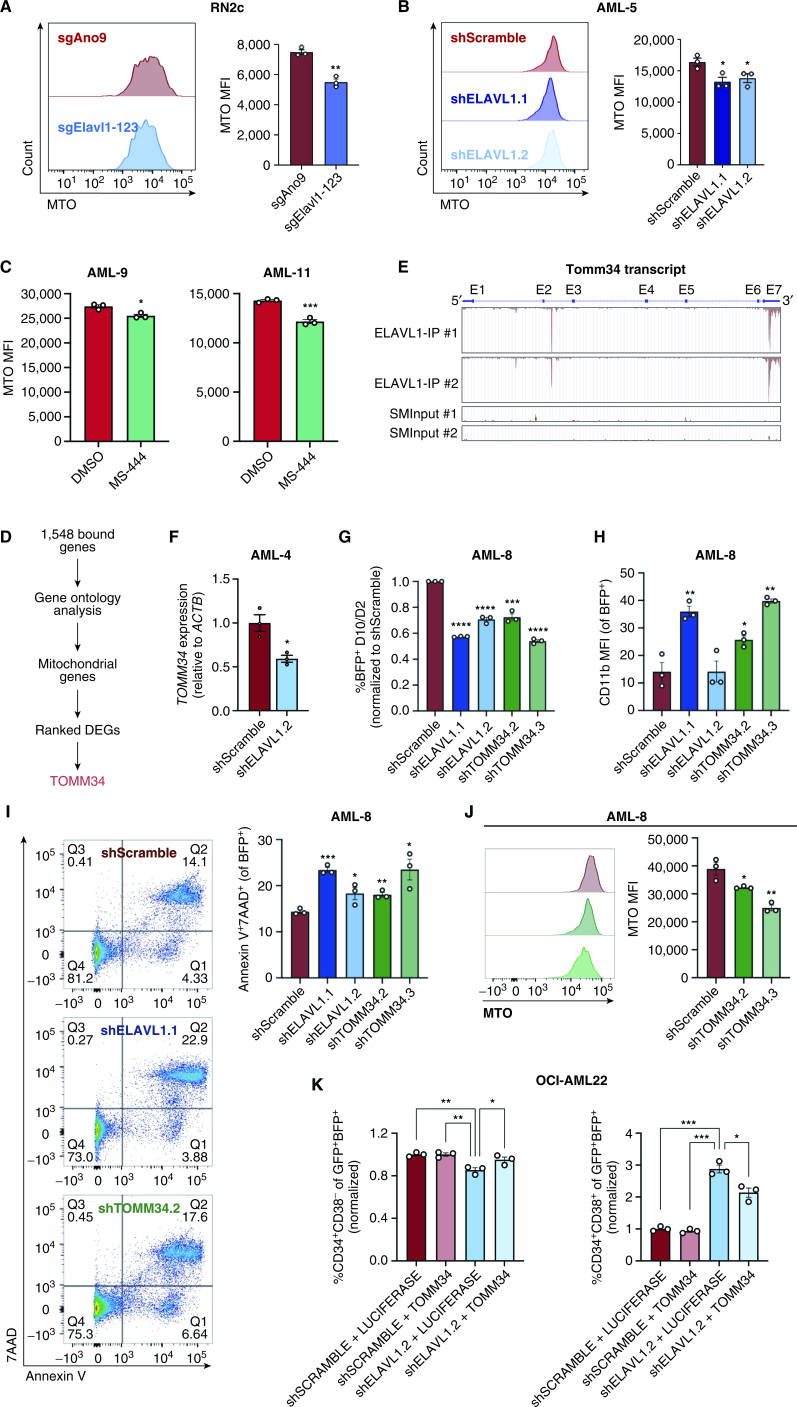
Acute myeloid leukemia (AML) is fueled by leukemic stem cells (LSC) whose determinants are challenging to discern from hematopoietic stem cells (HSC) or uncover by approaches focused on general cell properties. We have identified a set of RNA-binding proteins (RBP) selectively enriched in human AML LSCs. Using an in vivo two-step CRISPR-Cas9 screen to assay stem cell functionality, we found 32 RBPs essential for LSCs in MLL-AF9;NrasG12D AML. Loss-of-function approaches targeting key hit RBP ELAVL1 compromised LSC-driven in vivo leukemic reconstitution, and selectively depleted primitive malignant versus healthy cells. Integrative multiomics revealed differentiation, splicing, and mitochondrial metabolism as key features defining the leukemic ELAVL1-mRNA interactome with mitochondrial import protein, TOMM34, being a direct ELAVL1-stabilized target whose repression impairs AML propagation. Altogether, using a stem cell-adapted in vivo CRISPR screen, this work demonstrates pervasive reliance on RBPs as regulators of LSCs and highlights their potential as therapeutic targets in AML.

Significance: LSC-targeted therapies remain a significant unmet need in AML. We developed a stem-cell-adapted in vivo CRISPR screen to identify key LSC drivers. We uncover widespread RNA-binding protein dependencies in LSCs, including ELAVL1, which we identify as a novel therapeutic vulnerability through its regulation of mitochondrial metabolism. This article is highlighted in the In This Issue feature, p. 171.


Figures

Figure 1. Diverse RBPs are enriched in LSCs and identified as in vivo AML LSC essentialities through a two-step pooled in vivo CRISPR-Cas9 dropout screen. A, Overview of in silico selection of RBPs preferentially heightened in LSCs and reduced in LT-HSCs. B, GSEA plot showing LSC-enriched RBPs. The top 500 of the leading-edge LSC-enriched RBPs (LLE) are indicated by the blue box. C, Expression of LSC-enriched RBPs (LLE) in LT-HSC, ST-HSC, and MPP populations of human BM (dark gray, left) relative to all RBPs in census (light gray, left) and a subset of RBPs (LHL) with lowest expression in LT-HSCs of human BM (green, right) relative to all RBPs in census (light gray, right). D, Selection of the 128 RBPs exhibiting LSC-enriched and LT-HSC-reduced expression. E, Schematic illustrating the in vivo dropout screen. F, Average ranked dropout z-scores for all sgRNAs in both arms and transplantation rounds. G, Median log2 fold-change (T10 vs. T0) of unique sgRNAs in the NTC and RBP arms of the screen at the primary (top) and secondary (bottom) endpoints are shown. H, Median LFC of all sgRNAs within the RBP arm of the screen after the primary (top) and secondary (bottom) rounds. Select top-scoring sgRNAs are indicated with colored bars; shaded area indicates the decreased fold change of 20 cutoff. I, RBPs are called hits across primary and secondary screening arms. J, Analysis of general essentiality across a panel of AML cell lines (40) for the RBPs considered hits at primary endpoints (Primary, left) compared with RBP hits where all targeting sgRNAs dropped out only in secondary recipients (secondary, right). A gene was considered generally essential if its average log2 fold change in abundance was less than −1 in at least 12 of the 14 tested AML lines in vitro. n = 2–3 mice per 1° T10 and 2° T0 and T10 replicates. LT-HSC = CD34+CD38−CD90+CD49f+; ST-HSC = CD34+CD38−CD90+CD49f−; MPP = CD34+CD38−CD90−CD49f−. ***, P < 0.001, determined by a two-sided Student t test.
Figure 1.
Diverse RBPs are enriched in LSCs and identified as in vivo AML LSC essentialities through a two-step pooled in vivo CRISPR-Cas9 dropout screen. A, Overview of in silico selection of RBPs preferentially heightened in LSCs and reduced in LT-HSCs. B, GSEA plot showing LSC-enriched RBPs. The top 500 of the leading-edge LSC-enriched RBPs (LLE) are indicated by the blue box. C, Expression of LSC-enriched RBPs (LLE) in LT-HSC, ST-HSC, and MPP populations of human BM (dark gray, left) relative to all RBPs in census (light gray, left) and a subset of RBPs (LHL) with lowest expression in LT-HSCs of human BM (green, right) relative to all RBPs in census (light gray, right). D, Selection of the 128 RBPs exhibiting LSC-enriched and LT-HSC-reduced expression. E, Schematic illustrating the in vivo dropout screen. HT-seq, high-throughput sequencing. F, Average ranked dropout z-scores for all sgRNAs in both arms and transplantation rounds. G, Median log2 fold-change (T10 vs. T0) of unique sgRNAs in the NTC and RBP arms of the screen at the primary (top) and secondary (bottom) endpoints are shown. H, Median LFC of all sgRNAs within the RBP arm of the screen after the primary (top) and secondary (bottom) rounds. Select top-scoring sgRNAs are indicated with colored bars; shaded area indicates the decreased fold change of 20 cutoff. I, RBPs are called hits across primary and secondary screening arms. J, Analysis of general essentiality across a panel of AML cell lines (40) for the RBPs considered hits at primary endpoints (primary, left) compared with RBP hits where all targeting sgRNAs dropped out only in secondary recipients (secondary, right). A gene was considered generally essential if its average log2 fold change in abundance was less than −1 in at least 12 of the 14 tested AML lines in vitro. n = 2–3 mice per 1° T10 and 2° T0 and T10 replicates. LT-HSC = CD34+CD38CD90+CD49f+; ST-HSC = CD34+CD38CD90+CD49f; MPP = CD34+CD38CD90CD49f. ***, P < 0.001, determined by a two-sided Student t test.
Figure 2. Independent hit knockout validation replicates pooled CRISPR-Cas9 screen dropout dynamics and identifies ELAVL1 as a top LSC dependency. A, Schematic illustrating the in vivo screen validation strategy. B, Percentage of H2B-GFP+ cells in the output graft as compared with the T0 input. sgAno9 is the negative control and darkening shades of blue correlate with increasing time in vivo before sgRNA dropout. C, Representative flow plots of RN2c cells sampled at each time point (T0, T10 primary, T10 secondary) are shown. D, Fold change (FC) of cKit+ fractions within H2B-GFP+ populations of BM samples with >5% H2B-GFP+ of Ly5.2+. E, Transcript expression of Elavl1 in LSC+ (cKithigh, top 25%) and LSC− (cKitneg) MLL-AF9 NrasG12D (RN2c) cells (left; flow sorting gates are shown) and MLL-AF9 cells (right). F, Levels of Elavl1 mRNA across various subpopulations of the mouse hematopoietic hierarchy, adapted from BloodSpot. Mature hematopoietic lineages, progenitor populations, and primitive populations are shown in blue, gray, and black, respectively. G, Human ELAVL1 expression in LSC+ and LSC− AML subfractions (27) and throughout CML disease stages (adapted from ref. 46 and www.oncomine.org) are shown in left and right, respectively. H, Expression of ELAVL1 in subpopulations of OCI-AML-8227 cell line. I, Transcript levels of ELAVL1 across sorted subfractions of the human BM hematopoietic hierarchy, adapted from BloodSpot (43). Mature hematopoietic lineages, progenitor populations, and primitive populations are shown in blue, gray, and black, respectively. J, ELAVL1 expression levels across paired diagnosis-relapse primary human AML samples. *, P< 0.05; **, P < 0.01; ***, P < 0.001; ****, P < 0.0001, as determined by a two-sided Student t test. Error bars, SEM.
Figure 2.
Independent hit knockout validation replicates pooled CRISPR-Cas9 screen dropout dynamics and identifies ELAVL1 as a top LSC dependency. A, Schematic illustrating the in vivo screen validation strategy. B, Percentage of H2B-GFP+ cells in the output graft as compared with the T0 input. sgAno9 is the negative control and darkening shades of blue correlate with increasing time in vivo before sgRNA dropout. C, Representative flow plots of RN2c cells sampled at each time point (T0, T10 primary, T10 secondary) are shown. D, Fold change (FC) of cKit+ fractions within H2B-GFP+ populations of BM samples with >5% H2B-GFP+ of Ly5.2+. E, Transcript expression of Elavl1 in LSC+ (cKithigh, top 25%) and LSC (cKitneg) MLL-AF9 NrasG12D (RN2c) cells (left; flow sorting gates are shown) and MLL-AF9 cells (right). F, Levels of Elavl1 mRNA across various subpopulations of the mouse hematopoietic hierarchy, adapted from BloodSpot. Mature hematopoietic lineages, progenitor populations, and primitive populations are shown in blue, gray, and black, respectively. G, Human ELAVL1 expression in LSC+ and LSC AML subfractions (27) and throughout CML disease stages (adapted from ref. and www.oncomine.org) are shown in left and right, respectively. H, Expression of ELAVL1 in subpopulations of OCI-AML-8227 cell line. I, Transcript levels of ELAVL1 across sorted subfractions of the human BM hematopoietic hierarchy, adapted from BloodSpot (43). Mature hematopoietic lineages, progenitor populations, and primitive populations are shown in blue, gray, and black, respectively. J,ELAVL1 expression levels across paired diagnosis-relapse primary human AML samples. *, P < 0.05; **, P < 0.01; ***, P < 0.001; ****, P < 0.0001, as determined by a two-sided Student t test. Error bars, SEM. AP, accelerated phase; CP, chronic phase.
Figure 3. Elavl1 knockdown impairs in vivo leukemic propagation and spares healthy LT- HSCs. A, Schematic illustrating ELAVL1 loss-of-function in vivo transplantation assays in mMLL- AF9 and bcCML mouse models. B, CFU output from shLuciferase- and shElavl1-infected MLL-AF9 mouse leukemic BM, 10 days after plating (n = 3). C and D, Flow-cytometric analysis of the normalized output vs. input Ametrine+ fractions (C) and c-Kit mean fluorescence intensity (D) of shLuciferase- and shElavl1-infected MLL-AF9 BM at the secondary transplant endpoint. Representative flow plots and histograms are shown on the left in each panel. E, Schematic of in vivo evaluation of ELAVL1 knockdown in normal mouse BM stem and progenitor cells. F and G, Flow-cytometric analysis of Ly5.1+ZsGreen+ BM showing Lin− (F) and Lin−CD150+CD48− (G) fractions at the 18-week after transplant endpoint. *, P < 0.05, determined by a two-sided Student t test. Error bars, SEM.
Figure 3.
Elavl1 knockdown impairs in vivo leukemic propagation and spares healthy LT-HSCs. A, Schematic illustrating ELAVL1 loss-of-function in vivo transplantation assays in mMLL-AF9 and bcCML mouse models. B, CFU output from shLuciferase- and shElavl1-infected MLL-AF9 mouse leukemic BM, 10 days after plating (n = 3). C and D, Flow-cytometric analysis of the normalized output vs. input Ametrine+ fractions (C) and c-Kit mean fluorescence intensity (D) of shLuciferase- and shElavl1-infected MLL-AF9 BM at the secondary transplant endpoint. Representative flow plots and histograms are shown on the left in each panel. E, Schematic of in vivo evaluation of ELAVL1 knockdown in normal mouse BM stem and progenitor cells. F and G, Flow-cytometric analysis of Ly5.1+ZsGreen+ BM showing Lin (F) and LinCD150+CD48 (G) fractions at the 18-week after transplant endpoint. *, P < 0.05, determined by a two-sided Student t test. Error bars, SEM.
Figure 4. ELAVL1 knockdown selectively impairs in vivo leukemic engraftment. A and B, Flow-cytometric evaluation of (A) CD14+ and CD11b+ and (B) 7AAD+ fractions of shScramble- and shELAVL1-infected primary AML cultures 10 and 2 days after infection, respectively. C, Schematic illustrating in vivo ELAVL1 loss-of-function leukemic repopulation assays. D, Quantitative analysis of shELAVL1-infected primary AML cells at endpoint showing %CD45+CD33+ grafts in BM and (E) absolute graft size based on total cell counts in femurs and tibiae of recipient mice. F, Flow-cytometric analysis of CD14+ populations within CD45+CD33+ grafts in right femur and BM at the endpoint. G, Analysis of Ametrine+ fractions of shLuciferase- or shELAVL1-infected fractions within the injected right femur CD45+ grafts at the endpoint. H, Flow-cytometric analysis of leukemic grafts in the BM of secondary transplant recipient mice. Representative flow plots are shown. I, Percentage of human HSC in BM grafts of CB-transplanted recipient mice at the 12 weeks after transplant endpoint.*, P < 0.05; **, P < 0.01; ***, P < 0.001, determined by a two-sided Student t test. Error bars, SEM.
Figure 4.
ELAVL1 knockdown selectively impairs in vivo leukemic engraftment. A and B, Flow-cytometric evaluation of CD14+ and CD11b+ (A) and 7AAD+ (B) fractions of shScramble- and shELAVL1-infected primary AML cultures 10 and 2 days after infection, respectively. C, Schematic illustrating in vivo ELAVL1 loss-of-function leukemic repopulation assays. D and E, Quantitative analysis of shELAVL1-infected primary AML cells at endpoint showing %CD45+CD33+ grafts in BM (D) and absolute graft size (E) based on total cell counts in femurs and tibiae of recipient mice. F, Flow-cytometric analysis of CD14+ populations within CD45+CD33+ grafts in right femur and BM at the endpoint. G, Analysis of Ametrine+ fractions of shLuciferase- or shELAVL1-infected fractions within the injected right femur CD45+ grafts at the endpoint. H, Flow-cytometric analysis of leukemic grafts in the BM of secondary transplant recipient mice. Representative flow plots are shown. I, Percentage of human HSC in BM grafts of CB-transplanted recipient mice at the 12 weeks after transplant endpoint.*, P < 0.05; **, P < 0.01; ***, P < 0.001, determined by a two-sided Student t test. Error bars, SEM.
Figure 5. Small-molecule inhibition of ELAVL1 differentially targets leukemia-propagating vs. healthy hematopoietic cells. A and B, CFU output from primary AML (A) or lineage-depleted CB cells (B) treated with DMSO or DHTS (1.1 μmol/L). n = 2 independent CB units assessed over two independent experiments, n = 3 replicates for each condition. C, Flow-cytometric analysis of leukemic grafts in peripheral blood at 9 weeks after transplant and the CD45+CD33+ graft size based on total cell counts in BM at 8 weeks after transplant. Representative flow plots are shown. D and E, Flow-cytometric analysis of myeloid maturation markers, CD14 and CD11b (D) and cell death (Annexin V+Live/Dead+; E) in human primary AML samples treated with DMSO or 5 μmol/L MS-444. F, Quantification of apoptosis within primary AML cells infected with LUCIFERASE-overexpression and ELAVL1-overexpression in the presence of DMSO or 5 μmol/L MS-444. G, Schematic illustrating in vivo administration of DMSO or MS-444 in human primary AML- or CB-engrafted mice. H, Quantitative analysis of engraftment levels (left) and CD11b expression (in the CD11b+CD45+CD33+ fraction, right) in the BM of human primary AML-engrafted mice treated with DMSO or MS-444. I, Leukemic engraftment levels of secondary recipients transplanted with BM from primary mice treated with DMSO or MS-444. J and K, Flow-cytometric analysis of hematopoietic engraftment (J) and the primitive (CD34+CD38−) HSC population (of the CD45+ graft; K) in CB-transplanted mice treated with DMSO or MS-444. *, P < 0.05; **, P < 0.01; ***, P < 0.001, determined by a two-sided Student t test. Error bars, SEM.
Figure 5.
Small-molecule inhibition of ELAVL1 differentially targets leukemia-propagating vs. healthy hematopoietic cells. A and B, CFU output from primary AML (A) or lineage-depleted CB cells (B) treated with DMSO or DHTS (1.1 μmol/L). n = 2 independent CB units assessed over two independent experiments, n = 3 replicates for each condition. C, Flow-cytometric analysis of leukemic grafts in peripheral blood at 9 weeks after transplant and the CD45+CD33+ graft size based on total cell counts in BM at 8 weeks after transplant. Representative flow plots are shown. D and E, Flow-cytometric analysis of myeloid maturation markers, CD14 and CD11b (D) and cell death (Annexin V+Live/Dead+; E) in human primary AML samples treated with DMSO or 5 μmol/L MS-444. F, Quantification of apoptosis within primary AML cells infected with LUCIFERASE-overexpression and ELAVL1-overexpression in the presence of DMSO or 5 μmol/L MS-444. G, Schematic illustrating in vivo administration of DMSO or MS-444 in human primary AML- or CB-engrafted mice. H, Quantitative analysis of engraftment levels (left) and CD11b expression (in the CD11b+CD45+CD33+ fraction, right) in the BM of human primary AML-engrafted mice treated with DMSO or MS-444. I, Leukemic engraftment levels of secondary recipients transplanted with BM from primary mice treated with DMSO or MS-444. J and K, Flow-cytometric analysis of hematopoietic engraftment (J) and the primitive (CD34+CD38) HSC population (of the CD45+ graft; K) in CB-transplanted mice treated with DMSO or MS-444. *, P < 0.05; **, P < 0.01; ***, P < 0.001, determined by a two-sided Student t test. Error bars, SEM. A3SS, alternative 3’ splice site; A5SS, alternative 5’ splice site; BFU, burst-forming unit erythrocyte; G, granulocyte; GEMM, granulocyte/erythrocyte/monocyte/megakaryocyte; GM, granulocyte/monocyte; M, monocyte; MXE, mutually exclusive exons; RI, intron retention; SE, exon skipping.
Figure 6. Characterization of the ELAVL1-dependent circuitry in primitive leukemic cells. A, Volcano plot of differential gene expression in ELAVL1-knockout RN2c RNA-seq. Genes with significant differences in expression are highlighted. Blue and red dots represent genes significantly downregulated or upregulated, respectively, using a Padj < 0.05 (RNA-seq) cutoff. B, Enrichment map of gene sets significantly enriched (FDR < 0.1) in the transcriptome of ELAVL1-knockout RN2c cells. C, Distribution of ELAVL1 eCLIP peaks in different genic regions (top) and most common ELAVL1-binding motif sequences (bottom) in mouse bcCML cells. D, Distribution of splicing events in ELAVL1-knockout RN2c cells. E, Enrichment map of pathways enriched (FDR < 0.1) in the ELAVL1-knockout RN2c transcriptome and containing >5% of leading-edge transcripts bound by ELAVL1. Color of borders is based on the enrichment of transcript binding to leading edge relative to gene set background. F, Volcano plot of differential gene expression in ELAVL1-KD human primary AML. Blue and red dots represent genes significantly downregulated or upregulated, respectively, using a Padj < 0.05 cutoff. G, Number of pathways in the human ELAVL1-knockdown AML transcriptome that are significantly or nonsignificantly concordant and discordant in the BeatAML RNA-seq data set. H, Normalized enrichment scores (NES) of downregulated mitochondrial gene sets in the human ELAVL1-knockdown RNA-seq data set (highlighted by the green box in Supplementary Fig. S6I). I, Enrichment map of gene sets significantly (FDR < 0.25) altered in both ELAVL1-knockdown human AML and ELAVL1-knockout RN2c transcriptomes.
Figure 6.
Characterization of the ELAVL1-dependent circuitry in primitive leukemic cells. A, Volcano plot of differential gene expression in ELAVL1-knockout RN2c RNA sequencing (RNA-seq) Genes with significant differences in expression are highlighted. Blue and red dots represent genes significantly downregulated or upregulated, respectively, using a Padj < 0.05 (RNA-seq) cutoff. B, Enrichment map of gene sets significantly enriched (FDR < 0.1) in the transcriptome of ELAVL1-knockout RN2c cells. C, Distribution of ELAVL1 eCLIP peaks in different genic regions (top) and most common ELAVL1-binding motif sequences (bottom) in mouse bcCML cells. D, Distribution of splicing events in ELAVL1-knockout RN2c cells. E, Enrichment map of pathways enriched (FDR < 0.1) in the ELAVL1-knockout RN2c transcriptome and containing >5% of leading-edge transcripts bound by ELAVL1. Color of borders is based on the enrichment of transcript binding to leading edge relative to gene set background. F, Volcano plot of differential gene expression in ELAVL1-KD human primary AML. Blue and red dots represent genes significantly downregulated or upregulated, respectively, using a Padj < 0.05 cutoff. G, Number of pathways in the human ELAVL1-knockdown AML transcriptome that are significantly or nonsignificantly concordant and discordant in the BeatAML RNA-seq data set. H, Normalized enrichment scores (NES) of downregulated mitochondrial gene sets in the human ELAVL1-knockdown RNA-seq data set (highlighted by the green box in Supplementary Fig. S6I). I, Enrichment map of gene sets significantly (FDR < 0.25) altered in both ELAVL1-knockdown human AML and ELAVL1-knockout RN2c transcriptomes.
Figure 7. TOMM34 is a direct effector of ELAVL1 and is essential for mitochondrial metabolism and maintenance of primitive AML cells. A–C, Quantification of MitoTracker Orange (MTO) MFI in ELAVL1-depleted RN2c (A) and human primary AML cells (B) and in human primary AML cells treated with DMSO or 5 μmol/L MS-444 (C) 72 hours after infection or treatment. n = 3 technical replicates for each experiment. D, Flow chart illustrating the steps in identifying a top downregulated mitochondrial gene directly bound and regulated by ELAVL1. E, UCSC Genome Browser tracks showing ELAVL1-binding peaks along the TOMM34 transcript in reference to size-matched small input (SMInput) controls. F, qPCR of TOMM34 in shScramble- and shELAVL1-infected human primary AML. G–I, Flow-cytometric analysis of proliferation (BFP+; G), myeloid differentiation (H), and cell death (I) in ELAVL1- and TOMM34-depleted human primary AML cells compared with controls. J, MTO analysis of TOMM34-depleted human primary AML. K, Flow-cytometric evaluation of LSC (CD34+CD38−, left) and committed progenitor cells (CD34+CD38+, right) within OCI-AML22 cells coexpressing shSCRAMBLE/shELAVL1 and LUCIFERASE-/TOMM34-overexpression. *, P < 0.05; **, P < 0.01; ***, P < 0.001; ****, P < 0.0001, as determined by a two-sided Student t test. Error bars, SEM.
Figure 7.
TOMM34 is a direct effector of ELAVL1 and is essential for mitochondrial metabolism and maintenance of primitive AML cells. A–C, Quantification of MitoTracker Orange (MTO) MFI in ELAVL1-depleted RN2c (A) and human primary AML cells (B) and in human primary AML cells treated with DMSO or 5 μmol/L MS-444 (C) 72 hours after infection or treatment. n = 3 technical replicates for each experiment. D, Flow chart illustrating the steps in identifying a top downregulated mitochondrial gene directly bound and regulated by ELAVL1. E, UCSC Genome Browser tracks showing ELAVL1-binding peaks along the TOMM34 transcript in reference to size-matched small input (SMInput) controls. F, qPCR of TOMM34 in shScramble- and shELAVL1-infected human primary AML. G–I, Flow-cytometric analysis of proliferation (BFP+; G), myeloid differentiation (H), and cell death (I) in ELAVL1- and TOMM34-depleted human primary AML cells compared with controls. J, MTO analysis of TOMM34-depleted human primary AML. K, Flow-cytometric evaluation of LSC (CD34+CD38, left) and committed progenitor cells (CD34+CD38+, right) within OCI-AML22 cells coexpressing shSCRAMBLE/shELAVL1 and LUCIFERASE-/TOMM34-overexpression. *, P < 0.05; **, P < 0.01; ***, P < 0.001; ****, P < 0.0001, as determined by a two-sided Student t test. Error bars, SEM.

Comment in

  • 2643-3230. doi: 10.1158/2643-3230.BCD-4-3-ITI

References

    1. Dohner H, Weisdorf DJ, Bloomfield CD. Acute myeloid leukemia. N Engl J Med 2015;373:1136–52. - PubMed
    1. Kreso A, Dick JE. Evolution of the cancer stem cell model. Cell Stem Cell 2014;14:275–91. - PubMed
    1. Shlush LI, Mitchell A, Heisler L, Abelson S, Ng SWK, Trotman-Grant A, et al. Tracing the origins of relapse in acute myeloid leukaemia to stem cells. Nature 2017;547:104–8. - PubMed
    1. Guzman ML, Neering SJ, Upchurch D, Grimes B, Howard DS, Rizzieri DA, et al. Nuclear factor-kappaB is constitutively activated in primitive human acute myelogenous leukemia cells. Blood 2001;98:2301–7. - PubMed
    1. Guan Y, Gerhard B, Hogge DE. Detection, isolation, and stimulation of quiescent primitive leukemic progenitor cells from patients with acute myeloid leukemia (AML). Blood 2003;101:3142–9. - PubMed

Publication types

MeSH terms

Substances