. 2023 Jun 22;114(4):418-427.
doi: 10.1093/jhered/esad008.

A highly contiguous genome assembly for the California quail (Callipepla californica)

Affiliations

A highly contiguous genome assembly for the California quail (Callipepla californica)

Phred M Benham et al. J Hered. .

Abstract

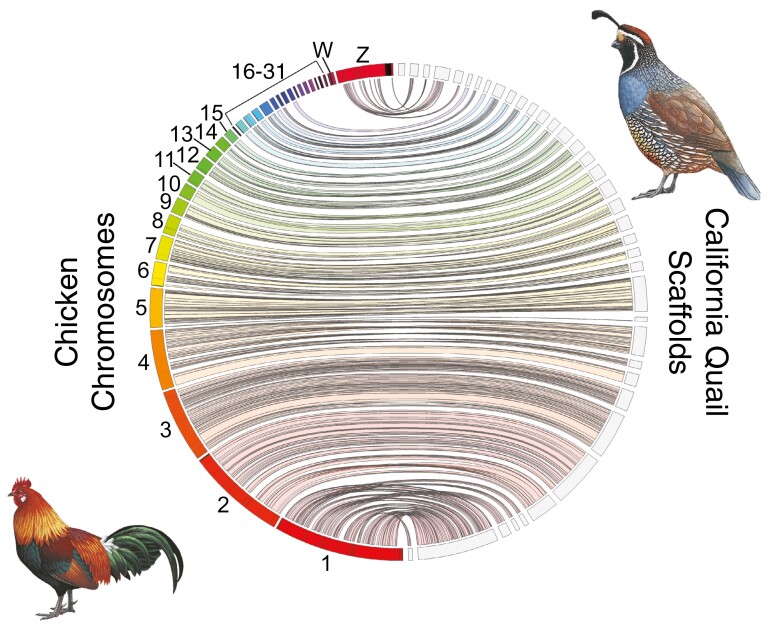
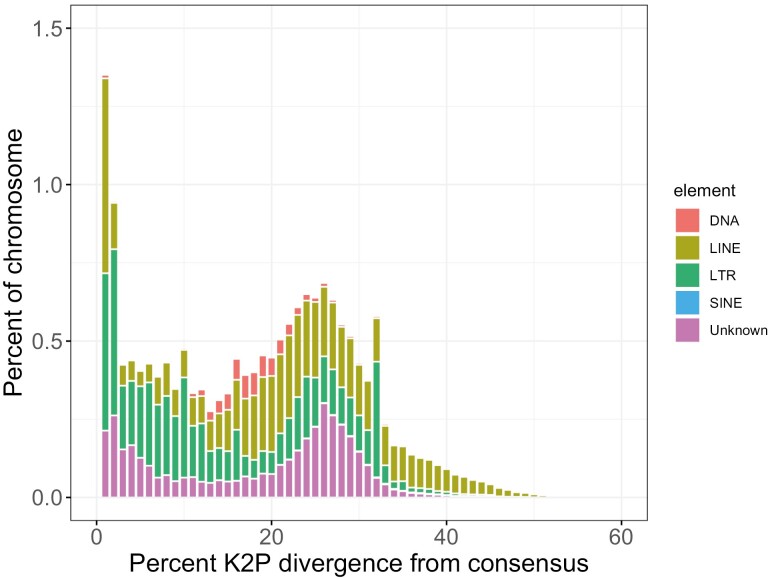
The California quail (Callipepla californica) is an iconic native bird of scrub and oak woodlands in California and the Baja Peninsula of Mexico. Here, we report a draft reference assembly for the species generated from PacBio HiFi long read and Omni-C chromatin-proximity sequencing data as part of the California Conservation Genomics Project (CCGP). Sequenced reads were assembled into 321 scaffolds totaling 1.08 Gb in length. Assembly metrics indicate a highly contiguous and complete assembly with a contig N50 of 5.5 Mb, scaffold N50 of 19.4 Mb, and BUSCO completeness score of 96.5%. Transposable elements (TEs) occupy 16.5% of the genome, more than previous Odontophoridae quail assemblies but in line with estimates of TE content for recent long-read assemblies of chicken and Peking duck. Together these metrics indicate that the present assembly is more complete than prior reference assemblies generated for Odontophoridae quail. This reference will serve as an essential resource for studies on local adaptation, phylogeography, and conservation genetics in this species of significant biological and recreational interest.

Keywords: California Conservation Genomics Project; Odontophoridae; transposable elements; upland game bird.


Figures

Fig. 1.
Fig. 1.
Female (a) and male (b) California quail (Callipepla californica). (c) Distribution of California quail (red) across western North America. Map includes both native and introduced populations. Distribution data from eBird (https://science.ebird.org/). Photos taken at Blue Oak Ranch Reserve, Santa Clara County, California and courtesy of Jackie Childers.
Fig. 2.
Fig. 2.
Visual overview of genome assembly metrics. a) K-mer spectra output generated from PacBio HiFi data without adapters using GenomeScope2.0. The bimodal pattern observed corresponds to a diploid genome and the k-mer profile matches that of low (<1%) heterozygosity. K-mers covered at lower coverage and lower frequency correspond to differences between haplotypes, whereas the higher coverage and higher frequency k-mers correspond to the similarities between haplotypes. b) BlobToolKit Snail plot showing a graphical representation of the quality metrics presented in Table 2 for the Callipepla californica primary assembly (bCalCai1). The plot circle represents the full size of the assembly. From the inside-out, the central plot covers length-related metrics. The red line represents the size of the longest scaffold; all other scaffolds are arranged in size-order moving clockwise around the plot and drawn in gray starting from the outside of the central plot. Dark and light orange arcs show the scaffold N50 and scaffold N90 values. The central light gray spiral shows the cumulative scaffold count with a white line at each order of magnitude. White regions in this area reflect the proportion of Ns in the assembly; the dark versus light blue area around it shows mean, maximum, and minimum GC versus AT content at 0.1% intervals (Challis et al. 2020). Hi-C contact maps for the primary (c) and alternate (d) genome assembly generated with PretextSnapshot. Hi-C contact maps translate proximity of genomic regions in 3D space to contiguous linear organization. Each cell in the contact map corresponds to sequencing data supporting the linkage (or join) between 2 such regions.
Fig. 3.
Fig. 3.
Jupiter plot comparing higher-level synteny and completeness between the chicken (Gallus gallus) genome (GRCg6a) and the California quail draft assembly. Chicken chromosomes are on the (colored) and quail scaffolds are on the right (light gray). Twists represent reversed orientation of scaffolds between assemblies. Bird illustrations reproduced from https://birdsoftheworld.org with permission from Lynx Edicions.
Fig. 4.
Fig. 4.
TE landscape for the California quail genome. Percent divergence on the x axis was calculated as the percent Kimura 2-parameter (K2P) distance with excluding CpG sites. The abundance of TEs in each percent divergence bin was normalized as percentage of the genome length on the y axis.

References

    1. Abdennur N, Mirny LA.. Cooler: scalable storage for Hi-C data and other genomically labeled arrays. Bioinformatics. 2020;36(1):311–316. - PMC - PubMed
    1. Allio R, Schomaker-Bastos A, Romiguier J, Prosdocimi F, Nabholz B, Delsuc F.. MitoFinder: efficient automated large-scale extraction of mitogenomic data in target enrichment phylogenomics. Mol Ecol Resour. 2020;20(4):892–905. - PMC - PubMed
    1. Bravo GA, Schmitt CJ, Edwards SV.. What have we learned from the first 500 avian genomes? Annu Rev Ecol Evol Syst. 2021;52(1):611–639. doi:10.1146/annurev-ecolsys-012121-085928 - DOI
    1. Calkins JD, Gee JM, Hagelin JC, Lott DF.. California quail (Callipepla californica), version 1.0. In: Poole AF, editor. Birds of the world. Ithaca (NY): Cornell Lab of Ornithology; 2014.
    1. Camacho C, Coulouris G, Avagyan V, Ma N, Papadopoulos J, Bealer K, Madden TL.. BLAST+: architecture and applications. BMC Bioinformatics. 2009;10(1):1–9. - PMC - PubMed

Publication types

Substances