. 2022 Nov 8;119(45):e2207067119.
doi: 10.1073/pnas.2207067119. Epub 2022 Nov 3.

Structural mechanisms for the activation of human cardiac KCNQ1 channel by electro-mechanical coupling enhancers

Affiliations

Structural mechanisms for the activation of human cardiac KCNQ1 channel by electro-mechanical coupling enhancers

Demin Ma et al. Proc Natl Acad Sci U S A. .

Abstract

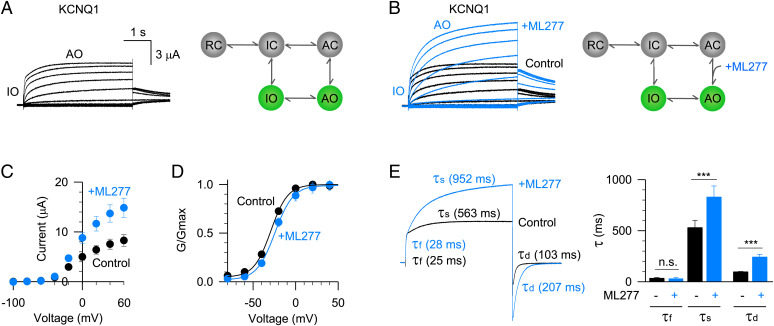
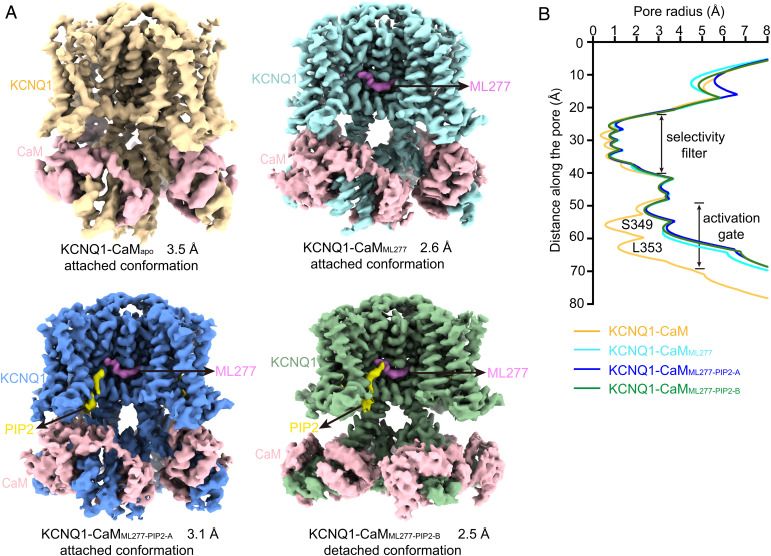
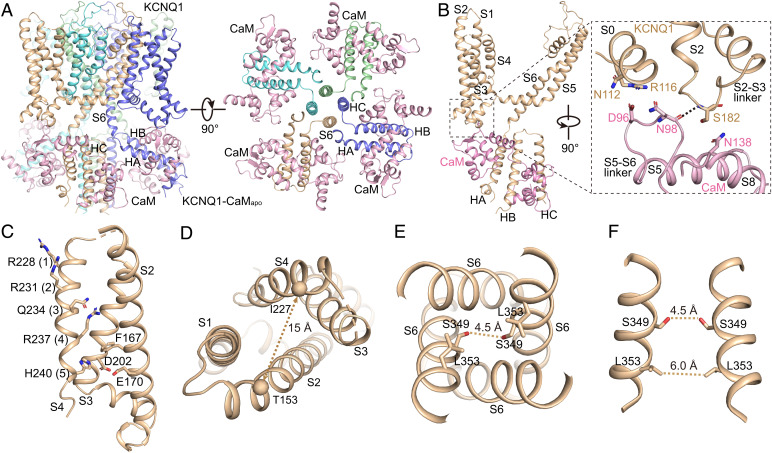
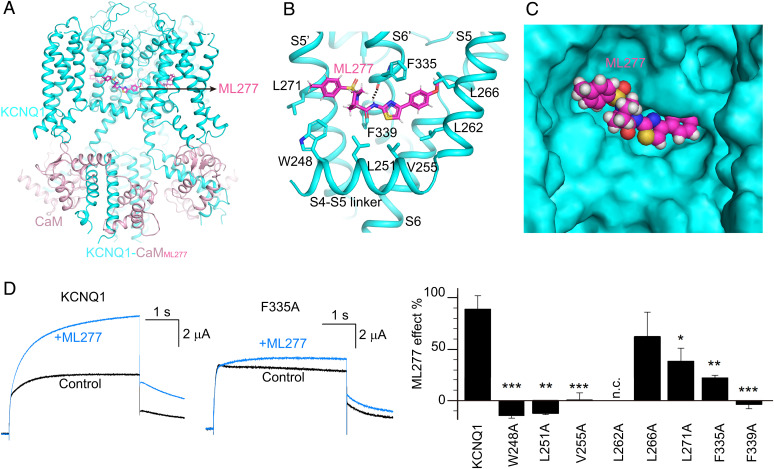
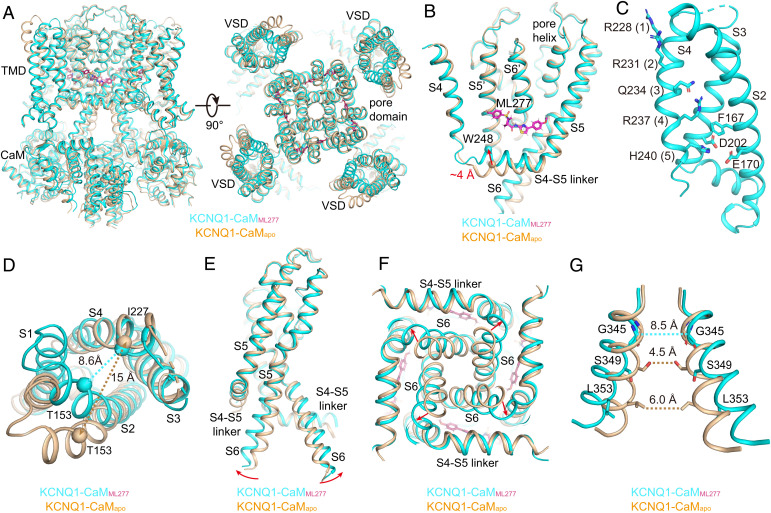
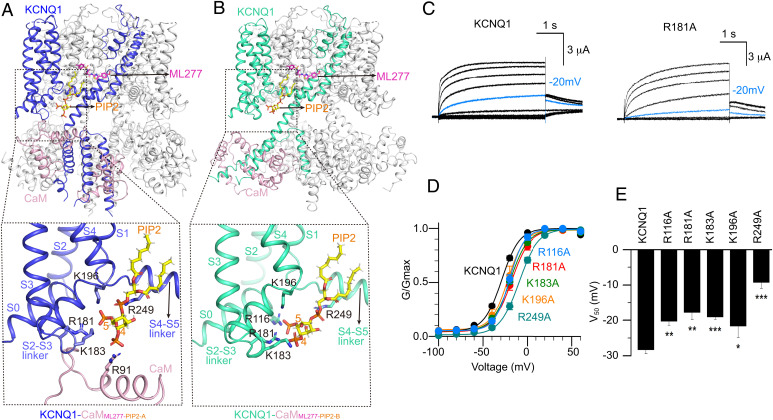
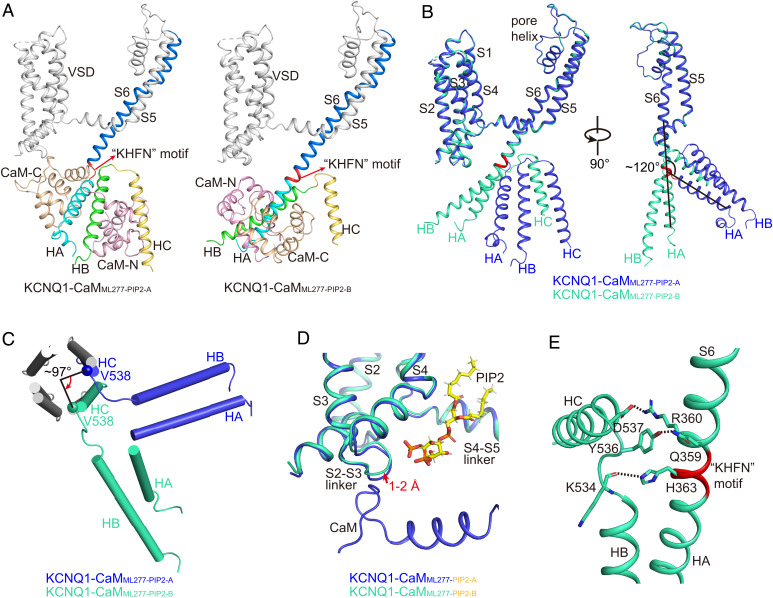
The cardiac KCNQ1 potassium channel carries the important IKs current and controls the heart rhythm. Hundreds of mutations in KCNQ1 can cause life-threatening cardiac arrhythmia. Although KCNQ1 structures have been recently resolved, the structural basis for the dynamic electro-mechanical coupling, also known as the voltage sensor domain-pore domain (VSD-PD) coupling, remains largely unknown. In this study, utilizing two VSD-PD coupling enhancers, namely, the membrane lipid phosphatidylinositol 4,5-bisphosphate (PIP2) and a small-molecule ML277, we determined 2.5-3.5 Å resolution cryo-electron microscopy structures of full-length human KCNQ1-calmodulin (CaM) complex in the apo closed, ML277-bound open, and ML277-PIP2-bound open states. ML277 binds at the "elbow" pocket above the S4-S5 linker and directly induces an upward movement of the S4-S5 linker and the opening of the activation gate without affecting the C-terminal domain (CTD) of KCNQ1. PIP2 binds at the cleft between the VSD and the PD and brings a large structural rearrangement of the CTD together with the CaM to activate the PD. These findings not only elucidate the structural basis for the dynamic VSD-PD coupling process during KCNQ1 gating but also pave the way to develop new therapeutics for anti-arrhythmia.

Keywords: E-M coupling; KCNQ1; ML277; PIP2.


Conflict of interest statement

The authors declare no competing interest.

Figures

Fig. 1.
Fig. 1.
ML277 activates the KCNQ1 channel. (A) Left, the KCNQ1 activation currents exhibit two phases: a fast phase approximates the intermediate-open (IO) state, and the slow phase approximates the activated-open (AO) state. The depolarization voltages were from −120 to +60 mV in 20 mV increments for 4 s and then stepped back to −40 mV to record the tail currents. Right, a five-state kinetic model recapitulates the unique gating process of the KCNQ1 channel (RC: resting closed, IC: intermediate closed, AC: activated closed). (B) Left, 1 µM ML277 activates the KCNQ1 currents. Current recorded before (black) and after (blue) adding ML277 were superimposed to show the ML277 effects. Right, ML277 enhances the VSD-PD coupling transition of the AO state. (C) Averaged current–voltage (I–V) relations of KCNQ1 channel before (black, n = 6) and after (blue, n = 6) adding ML277. (D) Normalized G–V relations of KCNQ1 channel before (black, n = 6) and after (blue, n = 6) adding ML277. Data points were fitted with a Boltzmann equation. (E) Left, activation and deactivation time constants (τ) of KCNQ1 currents before (black) and after (blue) adding ML277. The voltage was +60 mV for 4 s to activate KCNQ1 and then stepped to –120 mV for 2 s to deactivate KCNQ1. The activation time constants of the fast phase (τf) and slow phase (τs) were 25 and 563 ms for control, and 28 and 952 ms after adding ML277. The deactivation time constants (τd) were 103 ms for control and 207 ms after adding ML277. Right, averaged results of time constants (τf, τs, and τd) of KCNQ1 currents before (black) and after (blue) adding ML277 (n ≥ 8). n.s.: nonsignificant. The P values are 0.69 for τf, 0.00073 for τs, and 0.00011 for τd.
Fig. 2.
Fig. 2.
Structures of KCNQ1-CaM in different ligand-bound states. (A) The cryo-EM maps of KCNQ1-CaMapo (Upper Left), KCNQ1-CaMML277 (Upper Right), KCNQ1-CaMML277-PIP2-A (Lower Left), and KCNQ1-CaMML277-PIP2-B (Lower Right). KCNQ1, ML227, PIP2, and CaM are labeled. (B) Pore radii along the ion permeation pathway in different KCNQ1-CaM structures. Key residues forming the two constriction layers of the activation gate in the closed KCNQ1 are labeled.
Fig. 3.
Fig. 3.
The structure of KCNQ1-CaMapo. (A) The cartoon model of KCNQ1-CaMapo in the side view (Left) and top view (Right). Each subunit of KCNQ1 is colored individually, and the CaM is in pink. The TMD of KCNQ1 is not shown in the top view. (B) Interactions between the VSD of KCNQ1 and CaM. The dashed line shows the hydrogen bond between KCNQ1 and CaM. (C) The VSD structure of KCNQ1-CaMapo with S1 omitted for clarity. Side chains of gating charge residues and residues forming the CTC are shown as sticks. (D) A large solvent-accessible cavity formed in the extracellular side of VSD. The dashed line shows the distance between Cα atoms of Thr153 in S2 and Ile227 in S4 (in Å). (E) The pore domain of KCNQ1-CaMapo. The dashed line shows diagonal atom-to-atom distances between two Ser residues. (F) Ser349 and Leu353 form two constriction layers in the closed activation gate of KCNQ1-CaMapo. The dashed lines show diagonal atom-to-atom distances between two Ser and Leu residues (in Å).
Fig. 4.
Fig. 4.
The ML277 binding mode in KCNQ1. (A) The overall structure of KCNQ1-CaMML277. KCNQ1, CaM, and ML277 are colored in cyan, pink, and magenta, respectively. (B) The binding site of ML277 in KCNQ1. Side chains of residues in KCNQ1 involved in the hydrophobic interactions with ML277 are shown as sticks. The dashed line indicates the hydrogen bond between ML277 and Phe335. (C) The binding pocket of ML277 in KCNQ1. KCNQ1 is rendered as a surface model, and ML277 is shown as spheres. (D) Left, representative currents of WT KCNQ1 and the F335A mutant before (black) and after (blue) adding 1 µM ML277. Currents were recorded at +40 mV for 4 s and then back to −40 mV to induce the tail currents. Right, averaged results of 1 µM ML277-induced current increase on WT KCNQ1 and its mutations. L262A showed no current (n.c.). n ≥ 4. The P values are 0.00017 for W248A, 0.0011 for L251A, 0.00013 for V255A, 0.30 for L266A, 0.048 for L271A, 0.0016 for F335A, and 0.00091 for F339A.
Fig. 5.
Fig. 5.
ML277-induced conformational changes of KCNQ1. (A) Structural comparison of KCNQ1-CaMapo (wheat) and KCNQ1-CaMML277 (cyan) in the side view (Left) and top view (Right). (B) ML277 induces an upward movement of the S4-S5 linker. Arrow indicates the distance between the N-terminal residue Trp248 in the S4-S5 linkers in two structures. (C) The VSD in KCNQ1-CaMML277 with S1 omitted for clarity. Side chains of gating charge residues and residues forming the CTC are shown as sticks. (D) Structural differences of VSDs in KCNQ1-CaMapo (wheat) and KCNQ1-CaMML277 (cyan) in the top view. The dashed lines show the distances between Cα atoms of Thr153 in S2 and Ile227 in S4 in two structures. (E) Structural differences of PDs in KCNQ1-CaMapo and KCNQ1-CaMML277 in the side view. For clarity, only two opposing subunits are shown. Red arrows indicate the outward bending of S6 C-terminal halves upon ML277 binding. (F) Structural differences of PDs in KCNQ1-CaMapo and KCNQ1-CaMML277 in the bottom view. (G) Structural differences of the activation gates in KCNQ1-CaMapo and KCNQ1-CaMML277 in the side view. The dashed lines show diagonal atom-to-atom distances between constriction-forming residues (in Å). The gate in KCNQ1-CaMML277 opens up.
Fig. 6.
Fig. 6.
The binding modes of ML277 and PIP2 in KCNQ1. (A) The overall structure of KCNQ1-CaMML277-PIP2-A and a zoomed-in view of the PIP2 binding site. KCNQ1, CaM, ML277, and PIP2 are colored in blue, pink, magenta, and yellow, respectively. Side chains of positively charged residues involved in the PIP2 recognition are shown as sticks. (B) The overall structure of KCNQ1-CaMML277-PIP2-B and a zoomed-in view of the PIP2 binding site. KCNQ1, CaM, ML277, and PIP2 are colored in green, pink, magenta, and yellow, respectively. Side chains of positively charged residues involved in the PIP2 recognition are shown as sticks. (C) Activation currents of WT KCNQ1 and the R181A mutant. Currents were recorded from –120 mV to +60 mV in 20 mV increments for 4 s and then back to −40 mV to induce the tail currents. Currents recorded at –20 mV were shown in blue to indicate right-shifted voltage-dependent activation of R181A. (D) Normalized G–V relations of WT KCNQ1 channel (V50 = −28.4 ± 1.1 mV, n = 10), R116A (V50 = −20.3 ± 1.2 mV, n = 3), R181A (V50 = −17.8 ± 2.0 mV, n = 3), K183A (V50 = −19.1 ± 0.7 mV, n = 5), K196A (V50 = −21.7 ± 3.2 mV, n = 3), R249A (V50 = −9.3 ± 1.6 mV, n = 5). Data points were fitted with a Boltzmann equation. (E) Averaged results of V50 for WT KCNQ1 and its mutants. The P values are 0.0028 for R116A, 0.0018 for R181A, 0.000071 for K183A, 0.037 for K196A, and 0.0000094 for R249A.
Fig. 7.
Fig. 7.
Structural comparisons of KCNQ1-CaMML277-PIP2-A and KCNQ1-CaMML277-PIP2-B. (A) Different structure arrangements of CTD and CaM in KCNQ1-CaMML277-PIP2-A and KCNQ1-CaMML277-PIP2-B. S6, S6-HA linker, HA, HB, and HC helices of KCNQ1 are colored in marine, red, cyan, green, and yellow, respectively. The N-lobe and C-lobe of CaM are shown in wheat and pink, respectively. (B) Structural comparison of one KCNQ1 subunit in KCNQ1-CaMML277-PIP2-A (blue) and KCNQ1-CaMML277-PIP2-B (green) in two side views. The S6-HA linker ‘‘KHFN’’ motif that undergoes structural rearrangement from a loop to a helix is colored in red. (C) Structural comparison of the HA, HB, and HC helices in KCNQ1-CaMML277-PIP2-A (blue) and KCNQ1-CaMML277-PIP2-B (green) in the top view with TMD and HA/HB from the other three subunits omitted for clarity. The N-terminal residue Val538 of HC rotates by ∼97° from KCNQ1-CaMML277-PIP2-A to KCNQ1-CaMML277-PIP2-B. (D) The binding of PIP2 induces a 1–2 Å movement of the S2-S3 linker in KCNQ1-CaMML277-PIP2-B (green) in comparison with that in KCNQ1-CaMML277-PIP2-A (blue). The PIP2 in KCNQ1-CaMML277-PIP2-A is not shown for clarity. (E) Interactions between S6 and HB-HC linker. The dashed lines indicate the salt bridge Arg360-Asp537 and the hydrogen bonds Gln359-Tyr536 and His363-Lys534.

Similar articles

Cited by

References

    1. Wang Q., et al. , Positional cloning of a novel potassium channel gene: KVLQT1 mutations cause cardiac arrhythmias. Nat. Genet. 12, 17–23 (1996). - PubMed
    1. Sanguinetti M. C., et al. , Coassembly of K(V)LQT1 and minK (IsK) proteins to form cardiac I(Ks) potassium channel. Nature 384, 80–83 (1996). - PubMed
    1. Barhanin J., et al. , K(V)LQT1 and lsK (minK) proteins associate to form the I(Ks) cardiac potassium current. Nature 384, 78–80 (1996). - PubMed
    1. Schwartz P. J., Crotti L., Insolia R., Long-QT syndrome: From genetics to management. Circ. Arrhythm. Electrophysiol. 5, 868–877 (2012). - PMC - PubMed
    1. Bohnen M. S., et al. , Molecular pathophysiology of congenital long QT syndrome. Physiol. Rev. 97, 89–134 (2017). - PMC - PubMed

Publication types

Substances

LinkOut - more resources