. 2023 Feb 10;80(3):61.
doi: 10.1007/s00018-023-04708-9.

Co-dependent regulation of p-BRAF and potassium channel KCNMA1 levels drives glioma progression

Affiliations

Co-dependent regulation of p-BRAF and potassium channel KCNMA1 levels drives glioma progression

Shanshan Xie et al. Cell Mol Life Sci. .

Abstract

BRAF mutations have been found in gliomas which exhibit abnormal electrophysiological activities, implying their potential links with the ion channel functions. In this study, we identified the Drosophila potassium channel, Slowpoke (Slo), the ortholog of human KCNMA1, as a critical factor involved in dRafGOF glioma progression. Slo was upregulated in dRafGOF glioma. Knockdown of slo led to decreases in dRafGOF levels, glioma cell proliferation, and tumor-related phenotypes. Overexpression of slo in glial cells elevated dRaf expression and promoted cell proliferation. Similar mutual regulations of p-BRAF and KCNMA1 levels were then recapitulated in human glioma cells with the BRAF mutation. Elevated p-BRAF and KCNMA1 were also observed in HEK293T cells upon the treatment of 20 mM KCl, which causes membrane depolarization. Knockdown KCNMA1 in these cells led to a further decrease in cell viability. Based on these results, we conclude that the levels of p-BRAF and KCNMA1 are co-dependent and mutually regulated. We propose that, in depolarized glioma cells with BRAF mutations, high KCNMA1 levels act to repolarize membrane potential and facilitate cell growth. Our study provides a new strategy to antagonize the progression of gliomas as induced by BRAF mutations.

Keywords: BRAF; Glioma; KCNMA1; Potassium channel.


Conflict of interest statement

The authors have no relevant financial or non-financial interests to disclose.

Figures
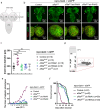
Fig. 1
Fig. 1
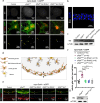
Lack of Slo inhibits Drosophila RafGOF glioma growth and rescues the glioma phenotype. a Schematic diagram of the Drosophila larval central nervous system including brain lobes (arrowhead) and ventral nerve cord (VNC). The brain lobe contains the central brain (CB) and optic lobe (OL) regions. Measured diameters of larval brain lobes are indicated by two-dotted lines. b Confocal images of the third-instar larval brains of the control, dRafGOF glioma, and dRafGOF glioma with slo-RNAi treatments (anti-Repo, red and eGFP, green). The enlarged brain lobes (arrow) of dRafGOF gliomas were rescued by either of the two slo-RNAi as driven by repo-Gal4. c Statistical analysis of the diameter of the third-instar larval brain lobes of the control, dRafGOF glioma, dRafGOF glioma with slo-RNAi treatments, and dRafGOF glioma with sloKO. The data are plotted as mean ± SD. ***P < 0.001. ns, not significant. d Schematic presentation of Drosophila epileptic phenotype induced by heat shock. e Frequencies of epileptic behaviors of adult flies induced by various heat shock time at 37C. n = 20. f Lifespan of the adult flies of the control, dRafGOF glioma, and two dRafGOF glioma with slo-RNAi treatments
Fig. 2
Fig. 2
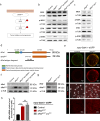
Membrane-bound protein Slo is highly expressed in dRafGOF glioma and associated with cell proliferation. a Confocal images of the third-instar larval brains of the control, dRafGOF glioma, and dRafGOF glioma with slo-RNAi treatments (anti-Slo, white; anti-Repo, red and eGFP, green). Arrowheads point to the Slo positive punctate signals. Increased numbers of Slo positive punctate signals were found in dRafGOF gliomas and such signals were decreased with slo-RNAi treatments. b Confocal images of larval salivary gland labeled by anti-Slo (white) and DAPI (blue). c Western blot results showing protein levels of Slo as elevated in dRafGOF gliomas as compared to controls and that such elevated protein levels were prevented by slo-RNAi treatment. α-tubulin (α-TUB) was used as internal reference. d Cross section diagram of three glial cell types in third-instar larval brains. Perineural and sub-perineural glial cells function as the brain blood barrier (BBB, between two arrows). e Confocal images of the BBB in third-instar larval brains lobes of the control, dRafGOF glioma, dRafGOF glioma with slo-RNAi treatments and dRafGOF glioma with sloKO (anti-Repo, red; eGFP, green; anti-PH3, white). The distances between two arrows indicate the thickness of the BBB. The arrowheads show the mitotic glia cells double labeled by anti-Repo (red) and anti-PH3 (white). f Statistical analysis of the mitotic glia cells for each half brain lobe of the control, dRafGOF glioma, dRafGOF glioma with slo-RNAi treatments and dRafGOF glioma with sloKO. The data are plotted as mean ± SD. ****P < 0.0001. g Western blot results showing protein levels of Slo in dRafGOF glioma and dRafGOF glioma with sloKO. α-tubulin (α-TUB) was used as internal reference
Fig. 3
Fig. 3
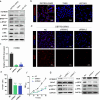
Slo and dRafGOF levels regulate MAPK pathway in dRafGOF glioma. a Diagram of potential tumorigenesis of BRAF mutation. b Western blot analysis of the control, dRafGOF gliomas, and dRafGOF gliomas with slo-RNAi treatments, showing the levels of proteins in the BRAF/MAPK pathway. Total levels of MEK and ERK remained unchanged, but p-MEK and p-ERK levels had increased significantly in dRafGOF gliomas. The elevated p-MEK and p-ERK were suppressed by slo-RNAi treatments. c Western blot analysis of dRafGOF gliomas and dRafGOF glioma with sloKO also showed the same phenomenon in the BRAF/MAPK pathway. d Schematic presentations of the full-length dRaf (dRaf), truncated gain of function dRaf (dRafGOF), and dRaf fragment used for antigen. e Confocal images of the labeled third-instar larval brain lobes of the control and dRafGOF glioma (eGFP, green, anti-dRaf, red and anti-Repo, white). f Western blot analysis of dRaf and dRafGOF levels of the control, dRafGOF glioma and dRafGOF glioma with slo-RNAi treatments. Full-length dRaf levels did not change while dRafGOF levels decreased upon slo-RNAi treatments. g Western blot analysis of dRaf and dRafGOF levels of dRafGOF glioma and dRafGOF glioma with sloKO. h Quantitative RT-PCR showing that total dRaf and dRafGOF mRNA levels in glioma is up-regulated compared with control, and had remained unchanged with or without sloKO. rp49 as internal reference. ****P < 0.0001, ns, not significant. α-tubulin (α-TUB) was used as internal reference for all Western blot analyses
Fig. 4
Fig. 4
The expression of KCNMA1 was raised in glioma patient with BRAFV600E. a Immunohistochemistry (IHC) estimation of KCNMA1 protein levels. Sample P1 exhibited obvious KCNMA1 protein expression (dark brown) in five pediatric glioma samples. b Western blot result showing KCNMA1 and p-MEK levels of the five glioma samples. GAPDH serves as internal reference
Fig. 5
Fig. 5
KCNMA1 suppression inhibits the proliferation and MAPK pathway in BRAFV600E glioma cells. a Western blot analyses of three glioblastoma cell lines (DBTRG-05MG, T98G and U87-MG) showing that only in DBTRG-05MG (BRAFV600E) the expression of KCNMA1 was detected with p-BRAF levels, as well as p-MEK and p-ERK, elevated. b Confocal images of cells from three glioblastoma cell lines with only DBTRG-05MG (BRAFV600E) showing anti-KCNMA1 staining (red and DAPI blue). c Quantitative RT-PCR results indicating the efficiency of KCNMA1 RNAi knockdown. The data are plotted as mean ± SD. ***P < 0.001. d Estimation of cell proliferation of DBTRG-05MG cells with anti-Ki67 staining (red and DAPI, blue). The numbers of Ki67 positive cells had decreased significantly in the presence of KCNMA1 shRNAs. e Proliferation was suppressed by KCNMA1 shRNAs. The data are plotted as mean ± SD. ****P < 0.0001. f A CCK-8 assay was used to examine the proliferation rate of DBTRG-05MG cells. The absorbance at 450 nm was measured at 0, 24, 48, 72 and 96 h (****P < 0.0001). g Western blot analysis of DBTRG-05MG cells showed that the expression of KCNMA1 was decreased and p-BRAF levels, as well as p-MEK and p-ERK, were also downregulated in the presence of KCNMA1 shRNAs. GAPDH served as internal reference in all Western blot works
Fig. 6
Fig. 6
Cromolyn and Dabrafenib treatments in DBTRG-05MG cells. a Examination of the cell viability of DBTRG-05MG cells with or without cromolyn treatment (125 μg/ml) by CCK-8 assay at 48 h (****P < 0.0001). b Western blot analysis of DBTRG-05MG cells with cromolyn treatment (125 μg/ml) showing levels of KCNMA1 as visibly downregulated together with a slight decrease of BRAFV600E, p-MEK and p-ERK. c Dabrafenib (1 nM) inhibited the proliferation rates of DBTRG-05MG cells when CCK-8 assay was used to measure the absorbance at 0, 24, 48 and 72 h (*P < 0.05. *** P < 0.001. **** P < 0.0001). d Western blot analysis of DBTRG-05MG cell with Dabrafenib (1 nM) treatment showing that the only p-MEK levels were suppressed while p-BRAF and KCNMA1 levels remained unchanged. GAPDH served as internal reference for all Western blots
Fig. 7
Fig. 7
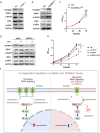
The mechanisms of co-dependency of p-BRAF and KCNMA1. a Western blot analysis of HEK293T cell showing moderate levels of KCNMA1 and p-BRAF, and other BRAF/MAPK pathway components. shRNA1 transfections suppressed not only KCNMA1 but also p-BRAF and p-MEK. b Western blot analysis indicating that KCNMA1 overexpression (KCNMA1OE) in HEK293T cells leads to not only increased KCNMA1 expression, but also higher levels of BRAF, p-BRAF and p-MEK. c The proliferation rates of HEK293T cells with KCNMA1 overexpression (KCNMA1OE) were examined with CCK-8 assay (***P < 0.001). d In the presence of 20 mM KCl in the culture medium, levels of KCNMA1, p-BRAF and p-MEK were raised slightly. The effects of 20 mM KCl were completely blocked in the presence of KCNMA1 shRNA1. e Summary of HEK293T cells proliferation rates of control, shRNA1 treated, and subsequent treatments with or without 20 mM KCl with CCK-8 assay (ns, not significant. ****P < 0.0001). f Diagram depicts the proposed mechanism of the co-dependent regulation of p-BRAF and KCNMA1 levels. In gliomas, the oncogenic BRAF mutations lead to membrane depolarization and elevated KCNMA1 expression. Raised KCNMA1 repolarizes the membrane potential and sustains p-BRAF levels. This then promotes tumor cell proliferation (left). When KCNMA1 is knocked down, insufficient amount of KCNMA1 is then available to repolarize the membrane potential. Thus, cell growth is inhibited and p-BRAFV600E is degraded (right)

Similar articles

Cited by

References

    1. Wan PT, et al. Mechanism of activation of the RAF-ERK signaling pathway by oncogenic mutations of B-RAF. Cell. 2004;116(6):855–867. doi: 10.1016/s0092-8674(04)00215-6. - DOI - PubMed
    1. Davies H, et al. Mutations of the BRAF gene in human cancer. Nature. 2002;417(6892):949–954. doi: 10.1038/nature00766. - DOI - PubMed
    1. Roskoski R., Jr RAF protein-serine/threonine kinases: structure and regulation. Biochem Biophys Res Commun. 2010;399(3):313–317. doi: 10.1016/j.bbrc.2010.07.092. - DOI - PubMed
    1. De Luca A, et al. The RAS/RAF/MEK/ERK and the PI3K/AKT signalling pathways: role in cancer pathogenesis and implications for therapeutic approaches. Expert Opin Ther Targets. 2012;16(Suppl 2):S17–27. doi: 10.1517/14728222.2011.639361. - DOI - PubMed
    1. Schubbert S, Shannon K, Bollag G. Hyperactive Ras in developmental disorders and cancer. Nat Rev Cancer. 2007;7(4):295–308. doi: 10.1038/nrc2109. - DOI - PubMed

MeSH terms

Substances

LinkOut - more resources