. 2023 Apr;146(2):97-112.
doi: 10.1007/s10633-023-09922-1. Epub 2023 Feb 10.

Multifocal electroretinography increases following experimental glaucoma in nonhuman primates with retinal ganglion cell axotomy

Affiliations

Multifocal electroretinography increases following experimental glaucoma in nonhuman primates with retinal ganglion cell axotomy

T Michael Nork et al. Doc Ophthalmol. 2023 Apr.

Abstract

Purpose: To determine whether short-latency changes in multifocal electroretinography (mfERG) observed in experimental glaucoma (EG) are secondary solely to retinal ganglion cell (RGC) loss or whether there is a separate contribution from elevated intraocular pressure (IOP).

Methods: Prior to operative procedures, a series of baseline mfERGs were recorded from six rhesus macaques using a 241-element unstretched stimulus. Animals then underwent hemiretinal endodiathermy axotomy (HEA) by placing burns along the inferior 180° of the optic nerve margin in the right eye (OD). mfERG recordings were obtained in each animal at regular intervals following for 3-4 months to allow stabilization of the HEA effects. Laser trabecular meshwork destruction (LTD) to elevate IOP was then performed; first-order kernel (K1) waveform root-mean-square (RMS) amplitudes for the short-latency segment of the mfERG wave (9-35 ms) were computed for two 7-hexagon groupings-the first located within the superior (non-axotomized) macula and the second within the inferior (axotomized) macula. Immunohistochemistry for glial fibrillary acidic protein (GFAP) was done.

Results: By 3 months post HEA, there was marked thinning of the inferior nerve fiber layer as measured by optical coherence tomography. Compared with baseline, no statistically significant changes in 9-35 ms K1 RMS amplitudes were evident in either the axotomized or non-axotomized portions of the macula. Following LTD, mean IOP in HEA eyes rose to 46 ± 9 compared with 20 ± 2 mmHg (SD) in the fellow control eyes. In the HEA + EG eyes, statistically significant increases in K1 RMS amplitude were present in both the axotomized inferior and non-axotomized superior portions of the OD retinas. No changes in K1 RMS amplitude were found in the fellow control eyes from baseline to HEA epoch, but there was a smaller increase from baseline to HEA + EG. Upregulation of GFAP in the Müller cells was evident in both non-axotomized and axotomized retina in eyes with elevated IOP.

Conclusions: The RMS amplitudes of the short-latency mfERG K1 waveforms are not altered following axotomy but undergo marked increases following elevated IOP. This suggests that the increase in mfERG amplitude was not solely a result of RGC loss and may reflect photoreceptor and bipolar cell dysfunction and/or changes in Müller cells.

Keywords: Axotomy; Experimental glaucoma; Multifocal electroretinography; Supranormality.


Conflict of interest statement

Disclosure of potential conflicts of interest

All authors certify that they have no affiliations with or involvement in any organization or entity with any financial interest (such as honoraria; educational grants; participation in speakers’ bureaus; membership, employment, consultancies, stock ownership, or other equity interest; and expert testimony or patent-licensing arrangements), or non-financial interest (such as personal or professional relationships, affiliations, knowledge or beliefs) in the subject matter or materials discussed in this manuscript.

Figures

Figure 1:
Figure 1:
Baseline representation of a 241-element mfERG response trace array with the location of the optic nerve superimposed (animal Rh4). The two 7-hexagon element groupings averaged for this study are shown. The superior (green) hexagon grouping is in the non-axotomized portion of the retina, and the inferior (red) hexagon grouping is in the part of the retina affected by the axotomy.
Figure 2:
Figure 2:
Fundus photography images of the right eye of animal Rh3 immediately following HEA (A), 140 days after HEA and just prior to LTD (B and C) and following 137 days of elevated IOP and just prior to euthanasia (D). Coagulative necrosis is evident along the inferior border of the optic nerve at the location of the endodiathermy spots in Frame A. 140 days after endodiathermy, the nerve fiber layer can be seen superiorly but has disappeared inferiorly (Frame B). The fluorescein angiogram done at the same time as the color photo in Frame B shows good flow in the veins indicating that the retinal veins were not affected by HEA. Frame D shows a decrease in the superior nerve fibers when compared with Frame B.
Figure 3:
Figure 3:
Circumpapillary circle RNFL OCT scans of animal Rh2 at Baseline, post HEA and post HEA+EG showing the effect of the experimental interventions on RNFL thickness. Also known as a TSNIT (temporal, superior, nasal, inferior, temporal) scan, the green circle indicates the scanned circumference, the results of which are shown in the right panels. At Baseline, there is a thick (i.e., normal) RNFL both superiorly and inferiorly (arrows). The inferior RNFL is greatly reduced 84 days following HEA, although the superior RNFL remains intact (arrow). The superior RNFL is also reduced 223 days following induction of experimental glaucoma (HEA+EG).
Figure 4:
Figure 4:
Mean 0 to 120 ms mfERG response waveforms for all 6 animals for the superior and inferior 7-hexagon groupings from the 3 experimental epochs (Baseline, post HEA and post HEA+EG). Both the inferior (axotomized) and superior (non-axotomized) traces of the right eyes show little change in N1-P1 from Baseline to HEA epoch but there is an absolute increase in both N1 and P1 going from HEA to HEA+EG epoch (left two frames). The fellow control left eyes (right two frames) also have similar N1-P1 traces from baseline to the HEA epochs, but a small increase may be present in the HEA+EG epoch. The whiskers indicate standard errors.
Figure 5:
Figure 5:
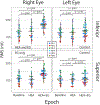
Beeswarm plots of K1 RMS amplitudes for the 9 to 35 ms mfERG interval of the 7-hexagon groupings shown in Figure 1. The data are grouped by experimental epoch. Each of the mfERG response-data recordings from all the animals are shown. Individual animals are indicated by the colors shown in the figure legend. Although there is considerable test-retest and inter-animal variability, the epoch means are not significantly affected by HEA (upper and lower left frames, Table 2). There is, however, a significant supranormal response following induction of experimental glaucoma (EG) in both the superior (non-axotomized) and inferior (axotomized) portions of the retina in the experimental right eye. The fellow control left eye (right upper and lower frames) shows similar responses in all 3 epochs. However, GLM revealed a small increase going from Baseline to HEA+EG in the control eyes. RStudio Team (2020). RStudio: Integrated Development for R. RStudio, PBC, Boston, MA URL http://www.rstudio.com/.
Figure 6:
Figure 6:
The same data as in Figure 5 plotted as trendlines of the means of 9 to 35 ms mfERG K1 RMS amplitude for each animal showing changes from Baseline to the HEA and HEA+EG epochs. There is inter-animal variability in the mfERG responses.
Figure 7:
Figure 7:
Average 9–35 ms N1-P1 K1 RMS amplitudes for all 6 animals at various intervals for the inferior 7-hexagon grouping of the experimental right eyes. The “0 Week” time point is the first mfERG testing session at the start of each of the three epochs. Linear regressions are indicated by the solid lines with the dotted lines showing 95% confidence limits. There is no statistically significant difference between the Baseline (black) and HEA (green) averages, but there is a significant increase for the HEA+EG (red) averages. The regression slopes are not significantly different from zero, indicating stability over time.
Figure 8:
Figure 8:
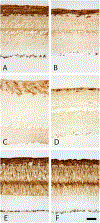
GFAP immunohistochemistry. The left frames (A, C and E) are from superior (non-axotomized) retinas corresponding to the green hexagons shown in Figure 1 and the right frames (B, D and F) are from inferior (axotomized) retinas corresponding to the red hexagons shown in Figure 1. The images are all oriented such that the RNFL is at the top and the photoreceptor layer is at the bottom. The top two frames (A and B) are from the fellow control left eye of Rh3 (see Figure 2). Rh3 was sacrificed 140 days after HEA and 137 days after induction of EG. Note that there is strong GFAP staining (dark brown) that is mostly limited to the inner retinal layers where the retinal astrocytes are located (A, B). The staining pattern is like that seen in the right (experimental) eye of a cynomolgus macaque that had undergone HEA alone as part of another study (C, D). (This animal was sacrificed 4 months after HEA.) Although the inner layers are much thinner in the HEA inferior retina (D), the GFAP activity remains confined to the layer of the astrocytes. By contrast, there is a marked upregulation of GFAP staining corresponding to the Müller glia in the experimentally glaucomatous right eye of Rh3 in both the superior (non-axotomized) (E) and inferior (axotomized) (F) retina. Bar = 50 μm.

Similar articles

Cited by

References

    1. Kendell KR, Quigley HA, Kerrigan LA, Pease ME, Quigley EN. Primary open-angle glaucoma is not associated with photoreceptor loss. Invest Ophthalmol Vis Sci. 1995;36(1):200–5. Epub 1995/01/01. - PubMed
    1. Nork TM, Ver Hoeve JN, Poulsen GL, Nickells RW, Davis MD, Weber AJ, et al. Swelling and loss of photoreceptors in chronic human and experimental glaucomas. Arch Ophthalmol. 2000;118(2):235–45. Epub 2000/02/17. doi: 10.1001/archopht.118.2.235. - DOI - PubMed
    1. Pelzel HR, Schlamp CL, Poulsen GL, Ver Hoeve JA, Nork TM, Nickells RW. Decrease of cone opsin mRNA in experimental ocular hypertension. Mol Vis. 2006;12:1272–82. Epub 20061026. - PubMed
    1. Harwerth RS, Smith EL 3rd, DeSantis L. Experimental glaucoma: perimetric field defects and intraocular pressure. J Glaucoma. 1997;6(6):390–401. Epub 1998/01/04. - PubMed
    1. Harwerth RS, Carter-Dawson L, Shen F, Smith EL 3rd, Crawford ML. Ganglion cell losses underlying visual field defects from experimental glaucoma. Invest Ophthalmol Vis Sci. 1999;40(10):2242–50. Epub 1999/09/07. - PubMed

Publication types