Rod photoreceptor activation and deactivation in early-stage diabetic eye disease
- PMID: 36763216
- PMCID: PMC12335271
- DOI: 10.1007/s10633-023-09925-y
Rod photoreceptor activation and deactivation in early-stage diabetic eye disease
Abstract
Purpose: To infer rod phototransduction activation and deactivation characteristics in diabetics who have mild or no clinically-apparent retinopathy.
Methods: Fifteen non-diabetic controls, 15 diabetics with no clinically-apparent diabetic retinopathy (NDR), and 15 diabetics with mild non-proliferative diabetic retinopathy (MDR) participated. Dark-adapted flash electroretinograms (3.2 to 4.4 log scot td-s) were recorded to assess rod activation. The a-waves were fit with a Gaussian model to derive Rmp3 (maximum photoreceptor response amplitude) and S (phototransduction sensitivity). Rod deactivation was assessed with a paired flash paradigm, in which a-waves were measured for two flashes separated by inter-stimulus intervals (ISIs) of 0.125 to 16 s. The ISI needed for the a-wave amplitude of the second flash to recover to 50% of the first flash (t50) was determined. The effect of stimulus retinal illuminance on activation and deactivation was evaluated in a subset of control subjects.
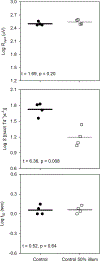
Results: Analysis of variance indicated that both diabetic groups had significant log S reductions compared to controls (p < 0.001). Mean S was reduced by approximately 49% and 78% for the NDR and MDR groups, respectively. In contrast, log Rmp3 and log t50 did not differ significantly among the groups (both p > 0.08). Reducing stimulus retinal illuminance significantly reduced S, but did not significantly affect Rmax or t50.
Conclusions: Only phototransduction sensitivity was abnormal in this sample of diabetic subjects. The normal deactivation kinetics suggests that circulating rod current is normal. These findings begin to constrain possible explanations for abnormal rod function in early diabetic retinal disease.
Keywords: Diabetic retinopathy; Electroretinogram; Photoreceptors; Rod function.
© 2023. The Author(s), under exclusive licence to Springer-Verlag GmbH Germany, part of Springer Nature.
Conflict of interest statement
Figures


Similar articles
-
Blood pressure control for diabetic retinopathy.Cochrane Database Syst Rev. 2015 Jan 31;1:CD006127. doi: 10.1002/14651858.CD006127.pub2. Cochrane Database Syst Rev. 2015. Update in: Cochrane Database Syst Rev. 2023 Mar 28;3:CD006127. doi: 10.1002/14651858.CD006127.pub3. PMID: 25637717 Free PMC article. Updated.
-
Fenofibrate for diabetic retinopathy.Cochrane Database Syst Rev. 2023 Jun 13;6(6):CD013318. doi: 10.1002/14651858.CD013318.pub2. Cochrane Database Syst Rev. 2023. PMID: 37310870 Free PMC article.
-
Electrophysiological measures of dysfunction in early-stage diabetic retinopathy: No correlation between cone phototransduction and oscillatory potential abnormalities.Doc Ophthalmol. 2020 Feb;140(1):31-42. doi: 10.1007/s10633-019-09718-2. Epub 2019 Sep 11. Doc Ophthalmol. 2020. PMID: 31512016 Free PMC article.
-
Laser photocoagulation for proliferative diabetic retinopathy.Cochrane Database Syst Rev. 2014 Nov 24;2014(11):CD011234. doi: 10.1002/14651858.CD011234.pub2. Cochrane Database Syst Rev. 2014. PMID: 25420029 Free PMC article.
-
Systematic review on urine albumin testing for early detection of diabetic complications.Health Technol Assess. 2005 Aug;9(30):iii-vi, xiii-163. doi: 10.3310/hta9300. Health Technol Assess. 2005. PMID: 16095545
Cited by
-
Increasing Energetic Demands on Photoreceptors in Diabetes Corrects Retinal Lipid Dysmetabolism and Reduces Subsequent Microvascular Damage.Am J Pathol. 2023 Dec;193(12):2144-2155. doi: 10.1016/j.ajpath.2023.09.004. Epub 2023 Sep 21. Am J Pathol. 2023. PMID: 37741454 Free PMC article.
-
A Simplified Model of Activation and Deactivation of Human Rod Phototransduction-An Electroretinographic Study.Invest Ophthalmol Vis Sci. 2023 Sep 1;64(12):36. doi: 10.1167/iovs.64.12.36. Invest Ophthalmol Vis Sci. 2023. PMID: 37738060 Free PMC article.
-
Clinical Evidence of a Photoreceptor Origin in Diabetic Retinal Disease.Ophthalmol Sci. 2024 Aug 2;5(1):100591. doi: 10.1016/j.xops.2024.100591. eCollection 2025 Jan-Feb. Ophthalmol Sci. 2024. PMID: 39328824 Free PMC article. Review.
References
-
- Lieth E, Gardner TW, Barber AJ, Antonetti DA, Penn State Retina Research G (2000) Retinal neurodegeneration: early pathology in diabetes. Clin Exp Ophthalmol 28 (1):3–8 - PubMed
-
- Sohn EH, van Dijk HW, Jiao C, Kok PH, Jeong W, Demirkaya N, Garmager A, Wit F, Kucukevcilioglu M, van Velthoven ME, DeVries JH, Mullins RF, Kuehn MH, Schlingemann RO, Sonka M, Verbraak FD, Abramoff MD (2016) Retinal neurodegeneration may precede microvascular changes characteristic of diabetic retinopathy in diabetes mellitus. Proc Natl Acad Sci U S A 113 (19):E2655–2664. doi: 10.1073/pnas.1522014113 - DOI - PMC - PubMed
MeSH terms
Grants and funding
LinkOut - more resources
Full Text Sources
Medical

