. 2023 Feb;14(2):319-334.
doi: 10.1007/s13300-022-01345-6. Epub 2023 Feb 3.

Efficacy and Safety of Ertugliflozin Added to Metformin: A Pooled Population from Asia with Type 2 Diabetes and Overweight or Obesity

Affiliations

Efficacy and Safety of Ertugliflozin Added to Metformin: A Pooled Population from Asia with Type 2 Diabetes and Overweight or Obesity

Linong Ji et al. Diabetes Ther. 2023 Feb.

Abstract

Introduction: The efficacy and safety of ertugliflozin have not been well characterized in Asian populations with type 2 diabetes (T2D) and overweight or obesity as defined by the Chinese Diabetes Society [body mass index (BMI) ≥ 24 kg/m2].

Methods: These post hoc analyses of pooled data from two randomized, double-blind, 26-week studies assessed the efficacy and safety of ertugliflozin (5 mg or 15 mg) compared with placebo in participants from Asia with T2D and baseline BMI ≥ 24 kg/m2, with inadequate glycemic control on metformin. Longitudinal analyses were used to calculate least squares (LS) mean [95% confidence interval (CI)] change from baseline in glycemic indices and body weight. The proportions of participants achieving efficacy targets and experiencing adverse events (AEs) were assessed.

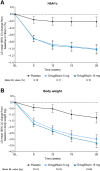
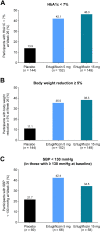
Results: The 445 participants had a mean age of 55.5 years, T2D duration 6.6 years, glycated hemoglobin (HbA1c) 8.1%, and BMI 27.6 kg/m2. At week 26, placebo-adjusted LS mean (95% CI) changes from baseline for ertugliflozin 5 mg and 15 mg, respectively, were - 0.78% (- 0.95% to - 0.61%) and - 0.80% (- 0.98% to - 0.63%) for HbA1c, and - 1.74 kg (- 2.29 kg to - 1.19 kg) and - 2.04 kg (- 2.60 kg to - 1.48 kg) for body weight. A greater proportion of participants receiving ertugliflozin 5 mg and 15 mg versus placebo, respectively, achieved HbA1c < 7.0% (42.1% and 46.3% vs. 13.9%), body weight reduction ≥ 5% (35.5% and 38.3% vs. 11.1%), and systolic blood pressure < 130 mmHg (42.4% and 34.5% vs. 21.7%). The proportion of participants with AEs was 52.6% (ertugliflozin 5 mg), 52.3% (ertugliflozin 15 mg), and 55.6% (placebo).

Conclusions: In participants from Asia with T2D inadequately controlled by metformin monotherapy, and BMI ≥24 kg/m2, ertugliflozin (5 mg or 15 mg) resulted in greater glycemic and body weight reductions compared with placebo and was generally well tolerated.

Trial registration: Clinicaltrials.gov identifiers NCT02033889, NCT02630706.

Keywords: Asia; Ertugliflozin; Obese; Overweight; Type 2 diabetes.


Figures

Fig. 1
Fig. 1
Change from BL in A HbA1c, B FPG, C body weight, and D SBP at week 26 in the population from Asia with T2D and BMI ≥ 24 kg/m2. All randomized participants who took ≥ 1 dose of study medication and with ≥ 1 assessment after BL. Data obtained after the initiation of glycemic rescue therapy were excluded. Sample size shown is for LS mean change. For full BL data see Table 1. To convert FPG mg/dL to mmol/L, divide by 18.0182. aLS mean difference (95% CI) versus placebo. BL baseline, BMI body mass index, CI confidence interval, FPG fasting plasma glucose, HbA1c glycated hemoglobin, LS least squares, SBP systolic blood pressure, T2D type 2 diabetes
Fig. 2
Fig. 2
Change from BL in A HbA1c and B body weight through 26 weeks in the population from Asia with T2D and BMI ≥ 24 kg/m2. All randomized participants who took ≥ 1 dose of study medication and with ≥ 1 assessment after BL. Data obtained after the initiation of glycemic rescue therapy were excluded. For full BL data see Table 1. BL baseline, BMI body mass index, CI confidence interval, HbA1c glycated hemoglobin, LS least squares, T2D type 2 diabetes
Fig. 3
Fig. 3
Change from BL at week 26 in A HbA1c, B absolute body weight, C percentage change in body weight, and D SBP: subgroup analyses according to baseline BMI (≥ 24 kg/m2 and < 28 kg/m2, and ≥ 28 kg/m2) in the population from Asia with T2D. All randomized participants who took ≥ 1 dose of study medication and with ≥ 1 assessment after BL (and additionally at BL for the percent body weight analysis). Data obtained after the initiation of glycemic rescue therapy were excluded. Sample sizes (for LS mean changes) for subgroup with BMI ≥ 24 kg/m2 and < 28 kg/m2, n = 80 (placebo), n = 91 (ertugliflozin 5 mg), and n = 91 (ertugliflozin 15 mg); and subgroup with BMI ≥ 28 kg/m2, n = 59 (placebo), n = 59 (ertugliflozin 5 mg), and n = 55 (ertugliflozin 15 mg). At BL, in the placebo, ertugliflozin 5 mg, and ertugliflozin 15 mg groups, respectively, mean (SD) HbA1c was 8.19 (0.95)%, 8.01 (0.85)%, and 8.04 (0.97)% in the subgroup with BMI ≥ 24 kg/m2 and < 28 kg/m2 and 8.17 (0.84)%, 8.27 (0.96)%, and 8.19 (0.88)% in the subgroup with BMI ≥ 28 kg/m2. Similarly, respectively, mean (SD) body weight was 70.04 (8.79) kg, 70.05 (6.93) kg, and 71.29 (7.44) kg in the subgroup with BMI ≥ 24 kg/m2 and < 28 kg/m2, and 82.17 (10.36) kg, 82.24 (10.81) kg, and 81.01 (9.44) kg in the subgroup with BMI ≥ 28 kg/m2; and mean (SD) SBP was 128.29 (12.62) mmHg, 126.19 (12.42) mmHg, and 127.50 (12.00) mmHg in the subgroup with BMI ≥ 24 kg/m2 and < 28 kg/m2, and 133.17 (14.73) mmHg, 130.31 (13.13) mmHg, and 128.52 (11.70) mmHg in the subgroup with BMI ≥ 28 kg/m2. aLS mean difference (95% CI) versus placebo. BL baseline, BMI body mass index, CI confidence interval, HbA1c glycated hemoglobin, LS least squares, SBP systolic blood pressure, SD standard deviation, T2D type 2 diabetes
Fig. 4
Fig. 4
Proportion of participants with A HbA1c < 7%, B body weight reduction ≥ 5%, and C SBP < 130 mmHg (in those with baseline measurement ≥ 130 mmHg) at week 26 in the population from Asia with T2D and BMI ≥ 24 kg/m2. Observed data, with missing data counted as nonresponders. All randomized participants who took ≥ 1 dose of study medication and with ≥ 1 measurement at or after baseline. Data obtained after the initiation of glycemic rescue therapy were excluded. BMI body mass index, HbA1c glycated hemoglobin, SBP systolic blood pressure, T2D type 2 diabetes
Fig. 5
Fig. 5
Change from BL in A triglycerides, B total cholesterol, C LDL-C, and D HDL-C at week 26 in the population from Asia with T2D and BMI ≥ 24 kg/m2. All randomized participants who took ≥ 1 dose of study medication and with ≥ 1 assessment after BL. Data obtained after the initiation of glycemic rescue therapy were excluded. Sample size shown is for LS mean change. For full BL data see Table 1. aLS mean difference (95% CI) versus placebo. BL baseline, BMI body mass index, CI confidence interval, HDL-C high-density lipoprotein cholesterol, LDL-C low-density lipoprotein cholesterol, LS least squares, T2D type 2 diabetes

References

    1. Safiri S, Karamzad N, Kaufman JS, et al. Prevalence, deaths and disability-adjusted-life-years (DALYs) due to type 2 diabetes and its attributable risk factors in 204 countries and territories, 1990–2019: results from the Global Burden of Disease Study 2019. Front Endocrinol (Lausanne) 2022;13:838027. doi: 10.3389/fendo.2022.838027. - DOI - PMC - PubMed
    1. Chan JC, Malik V, Jia W, et al. Diabetes in Asia: epidemiology, risk factors, and pathophysiology. JAMA. 2009;301:2129–2140. doi: 10.1001/jama.2009.726. - DOI - PubMed
    1. Hills AP, Arena R, Khunti K, et al. Epidemiology and determinants of type 2 diabetes in south Asia. Lancet Diabetes Endocrinol. 2018;6:966–978. doi: 10.1016/S2213-8587(18)30204-3. - DOI - PubMed
    1. Ruan Y, Yan QH, Xu JY, et al. Epidemiology of diabetes in adults aged 35 and older from Shanghai, China. Biomed Environ Sci. 2016;29:408–416. - PubMed
    1. Li Y, Teng D, Shi X, et al. Prevalence of diabetes recorded in mainland China using 2018 diagnostic criteria from the American Diabetes Association: national cross sectional study. BMJ. 2020;369:m997. doi: 10.1136/bmj.m997. - DOI - PMC - PubMed

Associated data

LinkOut - more resources