Association of Commercial-to-Medicare Relative Prices With Health System Financial Performance
- PMID: 36763368
- PMCID: PMC9918880
- DOI: 10.1001/jamahealthforum.2022.5444
Association of Commercial-to-Medicare Relative Prices With Health System Financial Performance
Abstract
Importance: Various studies have documented the rise in commercial insurance prices during the past 2 decades; however, estimates on the association of rising costs with health systems' financial health are lacking. This study calculated 2 measures from standardized Audited Financial Statements (AFSs)-operating margins and days of unrestricted cash on hand-to explore the associations.
Objective: To estimate the association between health systems' financial condition and the ratio of commercial to Medicare relative prices.
Design, setting, and participants: This cross-sectional analysis combined standardized 2018 AFSs from a large sample of US health systems with publicly available relative price data to assess the association between their financial outcomes and commercial-to-Medicare relative inpatient prices. The 2018 AFSs were collected and standardized from a convenience sample of multihospital health systems and single hospitals that were included in round 4 of the RAND Hospital Price Transparency Study. Cross-sectional, multivariate regression models were estimated, controlling for payer mix and other system characteristics, and models were weighted by health systems' 2018 adjusted admissions. The analyses were conducted July 2021 through November 2022.
Exposures: The commercial-to-Medicare relative price for inpatient services (2018-2020 pooled average), which represents the average amount paid by commercial plans as a percentage of what Medicare would have paid to the same health system for the same services.
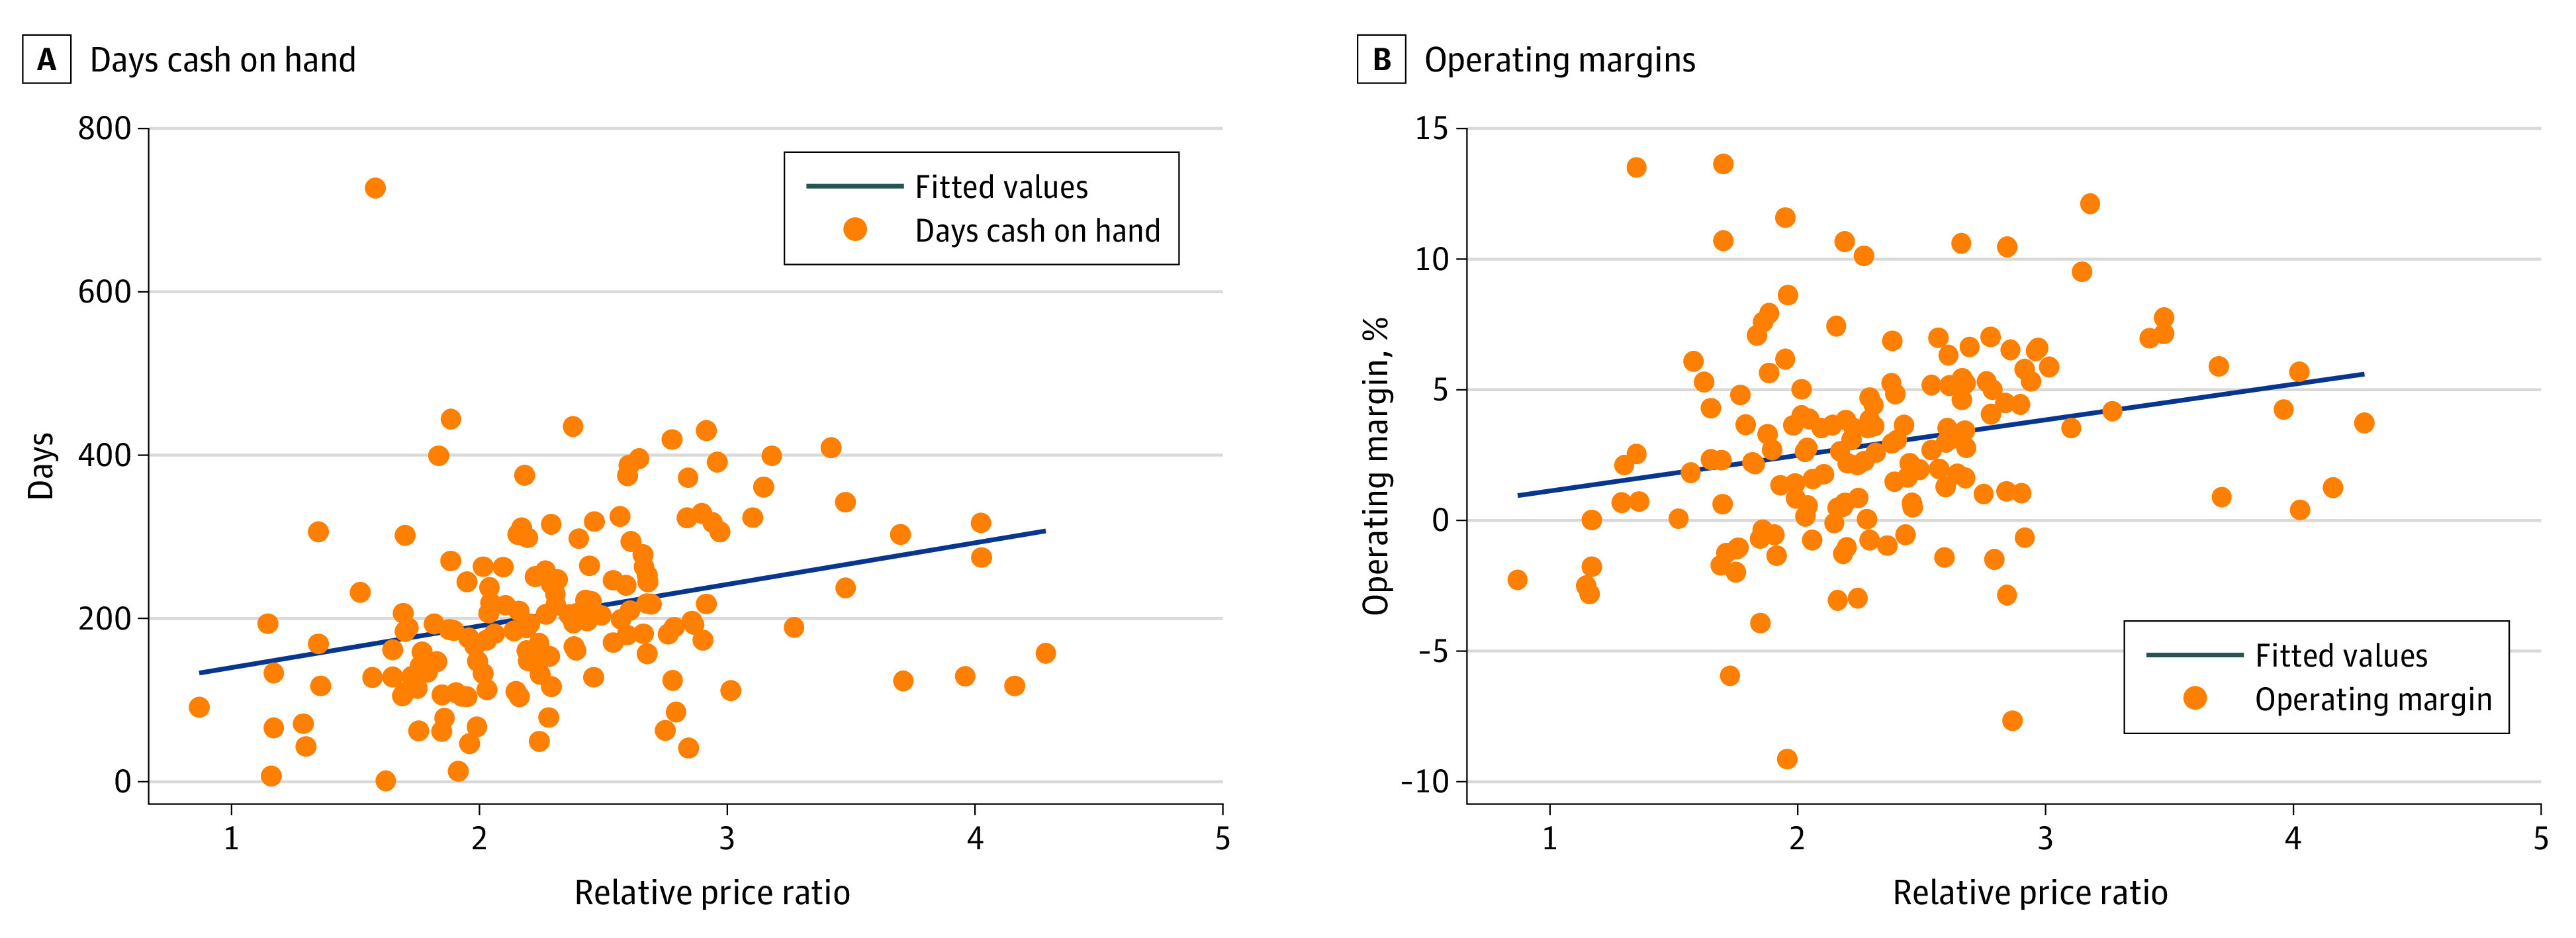
Main outcomes and measures: Operating margins and days cash on hand, which capture complementary aspects of financial performance (profitability and liquidity).
Results: The study sample included 156 health systems in the US, representing diverse geography, size, and ownership type. Mean (SD) days cash on hand were 180.1 (113.3) and operating margins were 3.3% (3.6%) in 2018. Overall, a 1-unit increase in the commercial-to-Medicare relative price ratio was associated with a 21.3% (95% CI, 21.3% to 21.4%; P < .001) increase in days cash on hand and a 2.7 (95% CI, 2.7 to 2.7; P < .001) percentage point increase in average operating margins. Higher Medicaid payer mix share was associated with fewer days cash on hand (-3.3%; 95% CI, -3.3% to -3.3%; P < .001) and lower operating margins (-0.081; 95% CI, -0.082 to -0.081; P < .001).
Conclusions and relevance: This cross-sectional study of health system financial data found that higher commercial-to-Medicare relative prices and a lower Medicaid payer share were associated with higher profits and more days cash on hand. These findings provide evidence against the claim that relatively higher commercial prices are primarily used to offset losses from public payers rather than to increase profits and liquidity.
Conflict of interest statement
Figures
References
-
- Whaley CM, Briscombe B, Kerber R, O’Neill B, Kofner A. Prices Paid to Hospitals by Private Health Plans: Findings from Round 4 of an Employer-Led Transparency Initiative. RAND Corporation; 2022. Accessed October 5, 2022. https://www.rand.org/pubs/research_reports/RRA1144-1.html - PMC - PubMed
-
- Frakt A. Hospitals Are Wrong About Shifting Costs to Private Insurers. New York Times, March 23, 2015. Accessed December 6, 2022. https://www.nytimes.com/2015/03/24/upshot/why-hospitals-are-wrong-about-...
-
- The North Carolina State Health Plan and the National Academy for State Health Policy . Hospitals Profit During COVID-19. Accessed October 5, 2022. https://www.shpnc.org/media/2905/download?attachment
Publication types
MeSH terms
LinkOut - more resources
Full Text Sources
Medical
Miscellaneous