. 2023 Apr 6;223(4):iyad019.
doi: 10.1093/genetics/iyad019.

Heterotrimeric G proteins regulate planarian regeneration and behavior

Affiliations

Heterotrimeric G proteins regulate planarian regeneration and behavior

Jennifer E Jenkins et al. Genetics. .

Abstract

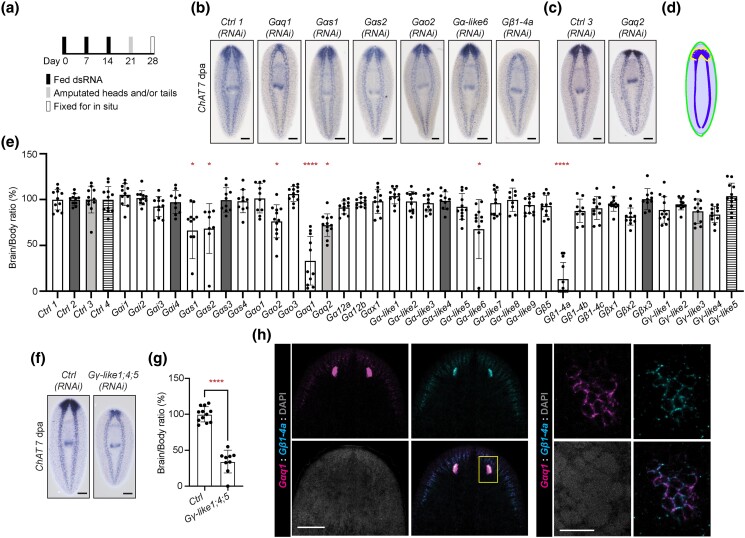
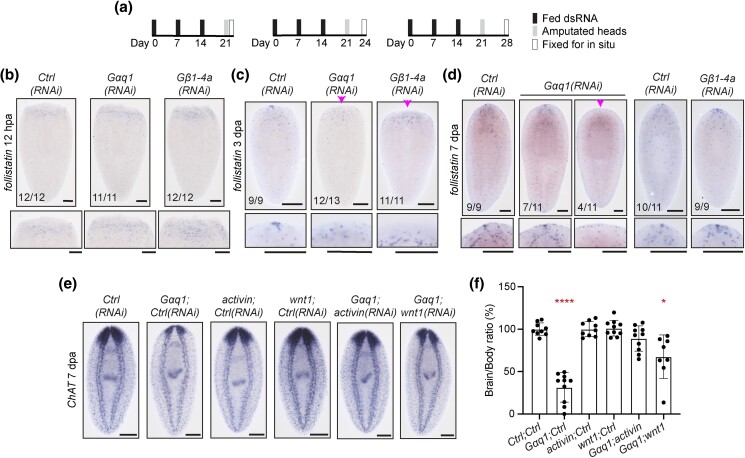
G protein-coupled receptors play broad roles in development and stem cell biology, but few roles for G protein-coupled receptor signaling in complex tissue regeneration have been uncovered. Planarian flatworms robustly regenerate all tissues and provide a model with which to explore potential functions for G protein-coupled receptor signaling in somatic regeneration and pluripotent stem cell biology. As a first step toward exploring G protein-coupled receptor function in planarians, we investigated downstream signal transducers that work with G protein-coupled receptors, called heterotrimeric G proteins. Here, we characterized the complete heterotrimeric G protein complement in Schmidtea mediterranea for the first time and found that 7 heterotrimeric G protein subunits promote regeneration. We further characterized 2 subunits critical for regeneration, Gαq1 and Gβ1-4a, finding that they promote the late phase of anterior polarity reestablishment, likely through anterior pole-produced Follistatin. Incidentally, we also found that 5 G protein subunits modulate planarian behavior. We further identified a putative serotonin receptor, gcr052, that we propose works with Gαs2 and Gβx2 in planarian locomotion, demonstrating the utility of our strategy for identifying relevant G protein-coupled receptors. Our work provides foundational insight into roles of heterotrimeric G proteins in planarian biology and serves as a useful springboard toward broadening our understanding of G protein-coupled receptor signaling in adult tissue regeneration.

Keywords: Schmidtea; GPCR; behavior; flatworm; heterotrimeric G protein; neurobiology; planarian; regeneration; signaling.


Conflict of interest statement

Conflicts of interest None declared.

Figures

Fig. 1.
Fig. 1.
Planarians possess diverse heterotrimeric G proteins. a) Graphical summary of a typical heterotrimeric G protein complex associated with a GPCR (top in the lipid bilayer). The heterotrimer is composed of Gα (bottom left), Gβ (bottom middle), and Gγ (bottom right) subunits that are activated upon ligand binding to the receptor. b) Table depicting S. mediterranea homologs for heterotrimeric G protein subunits. Representative images of G protein subunit expression patterns categorized by the most visually enriched tissue type into broad (c), neural (d), and intestinal (e) patterns. Scale bars = 200 μm. The anterior of the animals is oriented toward the top of the page in all figures.
Fig. 2.
Fig. 2.
Planarian heterotrimeric G proteins and GCR052 promote animal movement. a) RNAi paradigms used during initial regeneration screens (top) and follow-up, longer-term experiments (bottom). Data from b–c resulted from the top paradigm, and data from d–e and i–j resulted from the bottom paradigm. b) Flip assay used to document paralysis in Gas1(RNAi) animals. The graph includes flipping data for 20 animals per RNAi condition. c) Bar graph showing times taken for animals to flip over to a correct ventral-down posture (excluding 5 nonflipping Gas1(RNAi) animals), displayed as mean and standard deviation. Differences were analyzed with unpaired t-test with Welch's correction. **** = P value ≤ 0.0001. d) Image stills from videos capturing locomotion displayed by regenerating control, Gas2(RNAi), and Gβx2(RNAi) animals 10 dpa. e) Results from quantification of average velocity over a 40-s timespan in regenerating control, Gas2(RNAi), and Gβx2(RNAi) animals, displayed as mean and standard deviation. f) Images of Gas2 and Gβx2 zoomed colorimetric ISH showing the clusters of cells at the anterior tip of the animals, indicated with arrowheads. g) Gas2 and Gβx2 dFISH images of the head region. Arrowhead indicates an example of a cell enriched with both transcripts. The box indicates the region of interest where the anterior clusters are found. h) Graphical scheme showing the method used to identify candidate GPCRs for G protein subunits with documented phenotypes. i) Image stills from videos capturing locomotion displayed by regenerating gcr052(RNAi) animals. j) Results from quantification of average velocity over a 40-s timespan in intact control and gcr052(RNAi) animals, displayed as mean and standard deviation. Data displayed in i–j are from the same experiment as shown in d–e. Differences in average velocities were analyzed with Brown–Forsythe and Welch ANOVA with multiple comparisons. ****= P value ≤ 0.0001. k) Images showing the expression pattern of gcr052 through colorimetric ISH. l) gcr052 dFISH images with Gas2 or Gβx2 in the head region. The box indicates the region of interest where the anterior clusters are found. Arrowheads indicate an example of a cell enriched with both transcripts. Scale bars in d and i = 2 mm. Scale bars in f and d = 200 μm. Scale bars in g and l=100 μm.
Fig. 3.
Fig. 3.
Specific planarian heterotrimeric G protein genes promote brain regeneration. a) RNAi paradigm used for initial regeneration screens. b and c) Representative images showing animals treated with RNAi targeting genes that reduced brain regeneration along with corresponding controls. d) Visual schematic displaying our method for brain regeneration quantification. From ChAT ISH images, the area of the brain and body for each animal are used to calculate brain/body ratios (Roberts-Galbraith et al. 2016). e) Bar graph of data from quantification of brain/body ratios after RNAi, displaying mean and standard deviation. Bars are color coded to match samples to controls from the same experiment. Differences were analyzed using Brown–Forsythe and Welch ANOVA. * = P value ≤ 0.05. **** = P value ≤ 0.0001. f) Representative images showing brain regeneration in control and combinatorial Gγ-like1, Gγ-like4, and Gγ-like5 (RNAi) animals. g) Bar graph of quantified brain/body ratios in Gγ-like combinatorial RNAi, displayed as mean and standard deviation. Differences were analyzed using unpaired t-test. **** = P value ≤ 0.0001. h) Gαq1 and Gβ1-4a dFISH images focusing on the head. The box indicates the region shown in the next, zoomed image of the eyespot, validating coexpression. Scales in b, c, and f and the head region image in h = 200 μm. Scale in the eyespot image of h = 20 μm.
Fig. 4.
Fig. 4.
Gαq1 and Gβ1-4a are not required for stem cell maintenance. Representative images of (a) Smedwi-1, (b) prog-1, and (c) AGAT-1 ISH in regenerating animals after RNAi targeting Gαq1 and Gβ1-4a. d) Relative transcript abundance of stem cell markers, measured by RT-qPCR. Differences were analyzed with one-way ANOVA with multiple comparisons. Error bars represent standard error. * = P value ≤ 0.05. *** = P value ≤ 0.0005. e) Representative images of proliferative cell detection (anti-H3P) at the anterior region of intact, 6-h regenerating and 48-h regenerating RNAi animals. f) Results from quantification of H3P+ cells detected in the anterior region of the animals at each timepoint, displayed as mean and standard deviation. Differences were analyzed with Brown–Forsythe and Welch ANOVA with multiple comparisons. ** = P value ≤ 0.01. Scale bars = 200 μm.
Fig. 5.
Fig. 5.
Gαq1 and Gβ1-4a support the late phase of anterior and posterior pole regeneration. a) Graphic summary depicting phases of polarity reestablishment after head and tail amputation, as summarized in (Owlarn and Bartscherer 2016). b) RNAi paradigms for 18 hpa (top), 3 dpa (middle), and 7 dpa (bottom). The following images are zoomed to focus on the regenerating head or tail blastemas for each stage. Representative images of anterior notum, and posterior wnt1 or wnt11-2 expression at (c) 18 hpa, (d) 3 dpa, and (e) 7 dpa of heads (pointing upward) and/or tails (pointing downward). Brackets denote nonmedial expression domains. Arrowheads indicate multiple expression domains. Scale bars = 200 μm.
Fig. 6.
Fig. 6.
Gαq1 supports head regeneration through production of follistatin  + anterior pole cells. a) RNAi paradigms used for data presented at 12 hpa (left), 3 dpa (middle), and 7 dpa (right). Representative images of follistatin expression at (b) 12 hpa, (c) 3 dpa, and (d) 7 dpa in Gαq1(RNAi) and Gβ1-4a(RNAi) animals. Arrowheads indicate absent anterior pole expression domain. Insets show close-up images of the animals above. e) Representative images showing ChAT expression from rescue experiments 7 dpa. f) Bar graph showing results from quantification of brain/body ratios in rescue experiments, displayed as mean and standard deviation. Differences were analyzed using Brown–Forsythe and Welch ANOVA with multiple comparisons. * = P value ≤ 0.05 and **** = P value ≤ 0.0001. Scale bars = 200 μm.
Fig. 7.
Fig. 7.
Planarian heterotrimeric G proteins play diverse roles in regeneration, physiology, and behavior. Graphical summary of roles described in this work for heterotrimeric G proteins in S. mediterranea.

Similar articles

Cited by

References

    1. Agata K, Soejima Y, Kato K, Kobayashi C, Umesono Y, Watanabe K. Structure of the planarian central nervous system (CNS) revealed by neuronal cell markers. Zoolog Sci. 1998;15(3):433–440. doi:10.2108/zsj.15.433. - DOI - PubMed
    1. Alvarado AS, Newmark PA, Robb SMC, Juste R. The Schmidtea mediterranea database as a molecular resource for studying platyhelminthes, stem cells and regeneration. Development. 2002;129(24):5659–5665. doi:10.1242/dev.00167. - DOI - PubMed
    1. Anantharaman V, Abhiman S, de Souza RF, Aravind L. Comparative genomics uncovers novel structural and functional features of the heterotrimeric GTPase signaling system. Gene. 2011;475(2):63–78. doi:10.1016/j.gene.2010.12.001. - DOI - PMC - PubMed
    1. Baguna J, Salo E, Auladell C. Regeneration and pattern formation in planarians. III. that neoblasts are totipotent stem cells and the cells. Development. 1989;107(1):77–86. doi:10.1242/dev.107.1.77. - DOI
    1. Bates CA, Meyer RL. Heterotrimeric G protein activation rapidly inhibits outgrowth of optic axons from adult and embryonic mouse, and goldfish retinal explants. Brain Res. 1996;714(1-2):65–75. doi:10.1016/0006-8993(95)01468-3. - DOI - PubMed

Publication types

Substances