. 2023 Apr 15;44(6):2509-2522.
doi: 10.1002/hbm.26227. Epub 2023 Feb 10.

Combining arterial blood contrast with BOLD increases fMRI intracortical contrast

Affiliations

Combining arterial blood contrast with BOLD increases fMRI intracortical contrast

Nikos Priovoulos et al. Hum Brain Mapp. .

Abstract

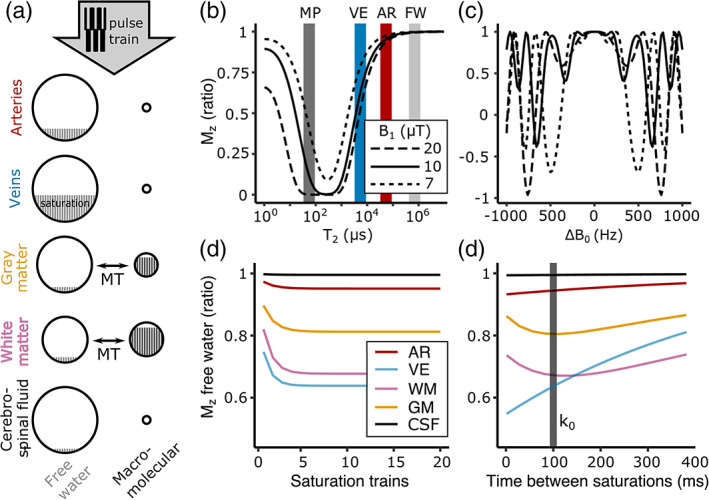
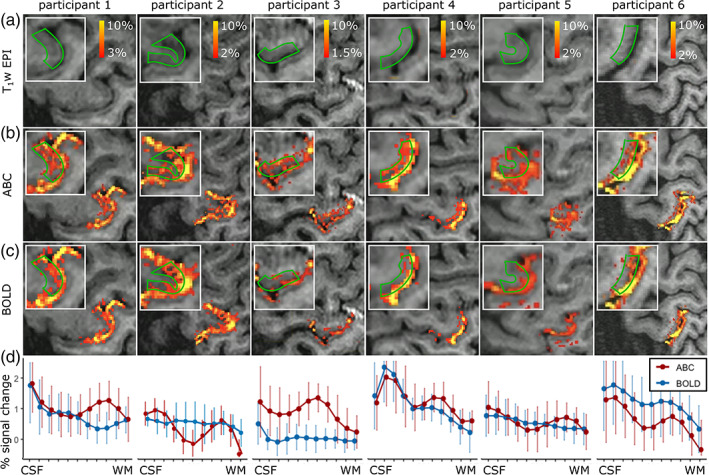
BOLD fMRI is widely applied in human neuroscience but is limited in its spatial specificity due to a cortical-depth-dependent venous bias. This reduces its localization specificity with respect to neuronal responses, a disadvantage for neuroscientific research. Here, we modified a submillimeter BOLD protocol to selectively reduce venous and tissue signal and increase cerebral blood volume weighting through a pulsed saturation scheme (dubbed Arterial Blood Contrast) at 7 T. Adding Arterial Blood Contrast on top of the existing BOLD contrast modulated the intracortical contrast. Isolating the Arterial Blood Contrast showed a response free of pial-surface bias. The results suggest that Arterial Blood Contrast can modulate the typical fMRI spatial specificity, with important applications in in-vivo neuroscience.

Keywords: 3D-EPI; arterial blood contrast; cerebral blood volume; layer-dependent fMRI; magnetization prepared fMRI; ultrahigh field MRI.


Conflict of interest statement

The authors declare no conflict of interest.

Figures

FIGURE 1
FIGURE 1
(a) Five signal compartments were considered. Arteries, veins, and cerebrospinal fluid were modeled as perfect liquids (i.e., minimal macromolecular pool) but with distinct T 2 values. Gray and white matter were assumed to have a sizeable macromolecular pool which, following saturation (gray bands), exchanges magnetization with the free water pool. (b) Simulated effects of a single pulse‐train at different amplitudes (duration: 6 ms) on the longitudinal magnetization M z, assuming on‐resonance. AR, arterial blood (red); FW, free water pool (light gray); MP, macromolecular pool (dark gray); VE, venous blood (blue). With a single 10 μΤ pulse, the MP (T 2 = 70 μs) is 92.5% saturated, and the VE compartment (T 2 = 7 ms; Yacoub et al., 2001) loses 37% of its signal, while the AR (T 2 = 67.5 ms) and FW (T 2 = 900 ms) compartments experience minimal signal attenuation. (c) Effect of a single pulse‐train on M z across offset frequencies for free water. Close to resonance no saturation occurs. (d) Effect of successive pulse‐trains on the free water signal‐reduction buildup. After <5 trains signal reduction is maximized. The signal is plotted for the time we intended to sample the center of k‐space (k 0 = 100 ms). (e) Simulated free‐water M z decay from t = 0 after the pulse‐train until its repetition (t = 381 ms). A biexponential behavior is observed in WM and GM due to the coupled macromolecular pool. The center of k‐space was sampled at the point of maximum AR/GM saturation difference (gray band at 100 ms; GM = 20% signal suppression, WM saturation = 33%, VE = 42%, AR = 6.5%, and FW = minimal).
FIGURE 2
FIGURE 2
(a) Overview of ABC, BOLD, and T 1w anatomical‐reference using the same segmented 3D‐EPI. (b) BOLD, ABC, and MTR = ABC/BOLD at the handknob (primary motor cortex). (c) Two counterbalanced runs of a finger‐flexing task were recorded, where participants were instructed to flex their right index finger without touching their palm or to rest while fixating on a cross.
FIGURE 3
FIGURE 3
(a) A 12 μT pulse‐train interleaved with cross‐relaxation periods enhances tissue‐specific saturation from a single pulse‐train repetition. (b) The center‐slice‐out ordering scheme brought close to the first k 0 at the maximum gray‐matter saturation point (ABC) and the second k 0 close to the longitudinal equilibrium (BOLD), as shown through coupled‐compartment simulations.
FIGURE 4
FIGURE 4
Axial slices at the level of M1 from one participant with venous and arterial visualization. (a) MP2RAGE INV2 image. (b) BOLD. (c) ABC. (d) Magnetization transfer ratio (MTR). The arteries can be seen as hyperintensities in INV2 (red arrows) and the veins as hypointensities in BOLD (blue arrows). In MTR, the veins, but not the arteries, are preferentially suppressed, confirming that the T 2‐specific saturation train minimally affects the arterial signal.
FIGURE 5
FIGURE 5
fMRI signal change in the left handknob during right index finger flexing (unsmoothed and masked for M1). Each column represents a participant. (a) Anatomical reference, (b) ABC, and (c) BOLD signal change. The white box highlights the M1. The green lines outline the cortex. (d) Mean cortical depth sampling within the M1 (red = ABC, blue = BOLD). The cortical depth profiles show increased signal change close to WM for ABC.
FIGURE 6
FIGURE 6
Reproducibility of the fMRI percent signal change in the left handknob during right index finger flexing. (a, b) Participants 1 and 2. M1 slices with unsmoothed percent signal change overlaid and cortical depth profiles for ABC and BOLD. The white box highlights the M1. Note that the participants showed a similar response pattern in both days, with the deep GM activation stripe in ABC being particularly obvious in participant 1.
FIGURE 7
FIGURE 7
(a–c) Mean timecourse (gray‐band = stimulus) within‐group for superficial (a), middle (b) and deep GM (c) (red = ABC, blue = BOLD). (d) Mean z‐stat cortical depth values within the M1 within‐group. (e) Mean number of active voxels within‐group (only voxels p < .05 included) for superficial, middle, and deep GM. ABC shows similar sensitivity to BOLD. (f) Mean z‐stat values within the venous ROI. ABC shows reduced venous sensitivity.
FIGURE 8
FIGURE 8
fMRI signal change in the left handknob during right index finger flexing (unsmoothed and masked for M1/S1) in one individual along successive slices (rows). (a) ABC. (b) BOLD (thresholded at 5%). (c) Isolated ABC signal change (thresholded at 1%). (d) Overlay between isolated ABC (green) and BOLD (blue). The box highlights the M1/S1. Note the M1/S1 separation in the functional response of isolated ABC compared to BOLD.
FIGURE 9
FIGURE 9
(a–c) fMRI signal change in the left handknob during right index hand flexing (unsmoothed and masked for M1/S1) for all participants (columns). (a) ABC. (b) BOLD (thresholded at 5%). (c) Isolated ABC signal change (thresholded at 1%). Distinct S1/M1 gray‐matter responses can be detected with isolated‐ABC compared to BOLD. (d) Cortical depth analysis. The isolated‐ABC shows reduced pial‐surface bias. (e) Mean timecourse (gray‐band = stimulus). (f) Comparison of z‐stat distribution of significant voxels (p < .05) in M1 (red = time‐matched ABC, blue = time‐matched BOLD, and green = isolated‐ABC).

Similar articles

Cited by

References

    1. Avants, B. B. , Tustison, N. J. , Song, G. , Cook, P. A. , Klein, A. , & Gee, J. C. (2011). A reproducible evaluation of ANTs similarity metric performance in brain image registration. NeuroImage, 54, 2033–2044. - PMC - PubMed
    1. Bottomley, P. A. , & Edelstein, W. A. (1981). Power deposition in whole‐body NMR imaging. Medical Physics, 8, 510–512. - PubMed
    1. Boxerman, J. L. , Bandettini, P. A. , Kwong, K. K. , Baker, J. R. , Davis, T. L. , Rosen, B. R. , & Weisskoff, R. M. (1995). The intravascular contribution to fMRI signal change: Monte Carlo modeling and diffusion‐weighted studies in vivo. Magnetic Resonance in Medicine, 34, 4–10. - PubMed
    1. Caan, M. W. A. , Bazin, P. L. , Marques, J. P. , de Hollander, G. , Dumoulin, S. O. , & van der Zwaag, W. (2019). MP2RAGEME: T1, T2 (*), and QSM mapping in one sequence at 7 Tesla. Human Brain Mapping, 40, 1786–1798. - PMC - PubMed
    1. Cai, K. , Haris, M. , Singh, A. , Li, L. Z. , & Reddy, R. (2013). Blood oxygen level dependent magnetization transfer (BOLDMT) effect. Advances in Experimental Medicine and Biology, 765, 31–37. - PMC - PubMed

Publication types

MeSH terms