. 2023 Feb 10;9(6):eade5393.
doi: 10.1126/sciadv.ade5393. Epub 2023 Feb 10.

Na, K-ATPase α1 cooperates with its endogenous ligand to reprogram immune microenvironment of lung carcinoma and promotes immune escape

Affiliations

Na, K-ATPase α1 cooperates with its endogenous ligand to reprogram immune microenvironment of lung carcinoma and promotes immune escape

Kaiyong Yang et al. Sci Adv. .

Abstract

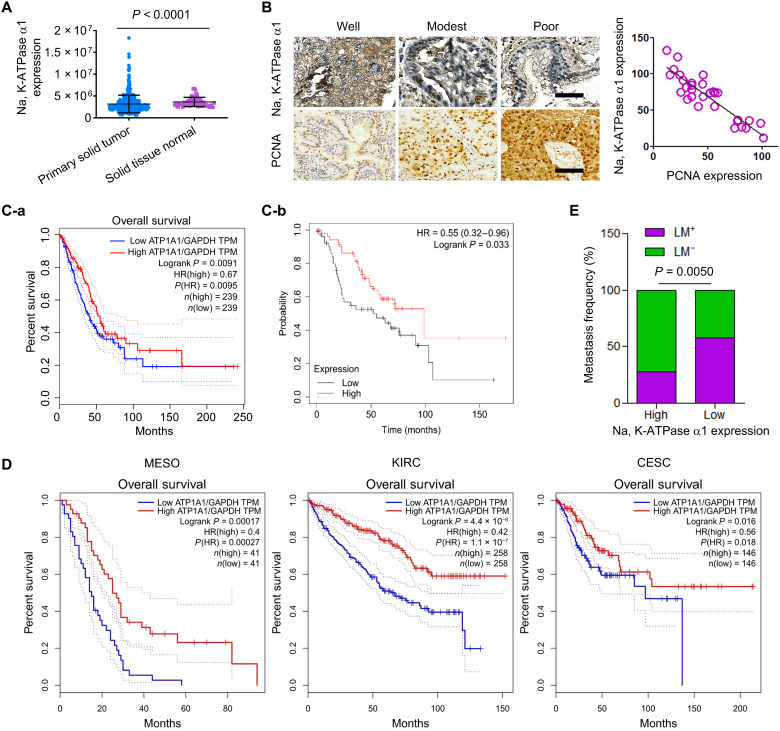
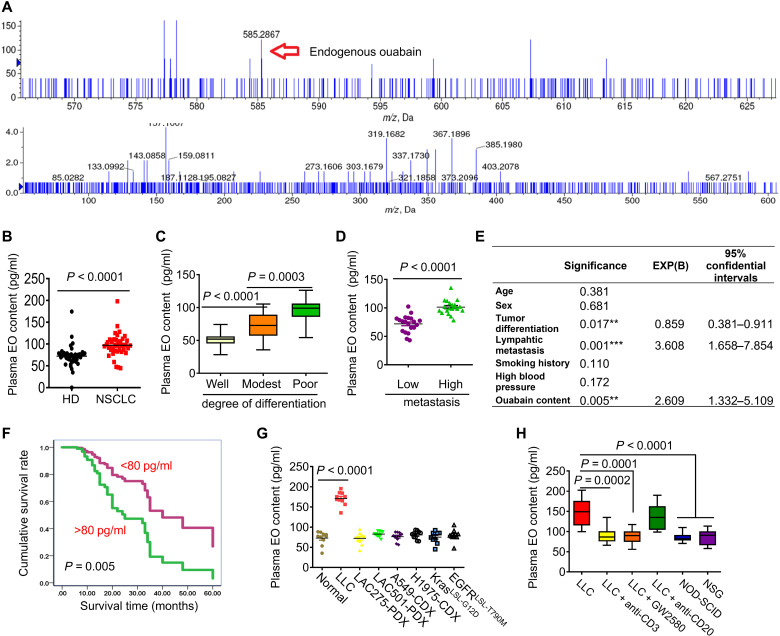
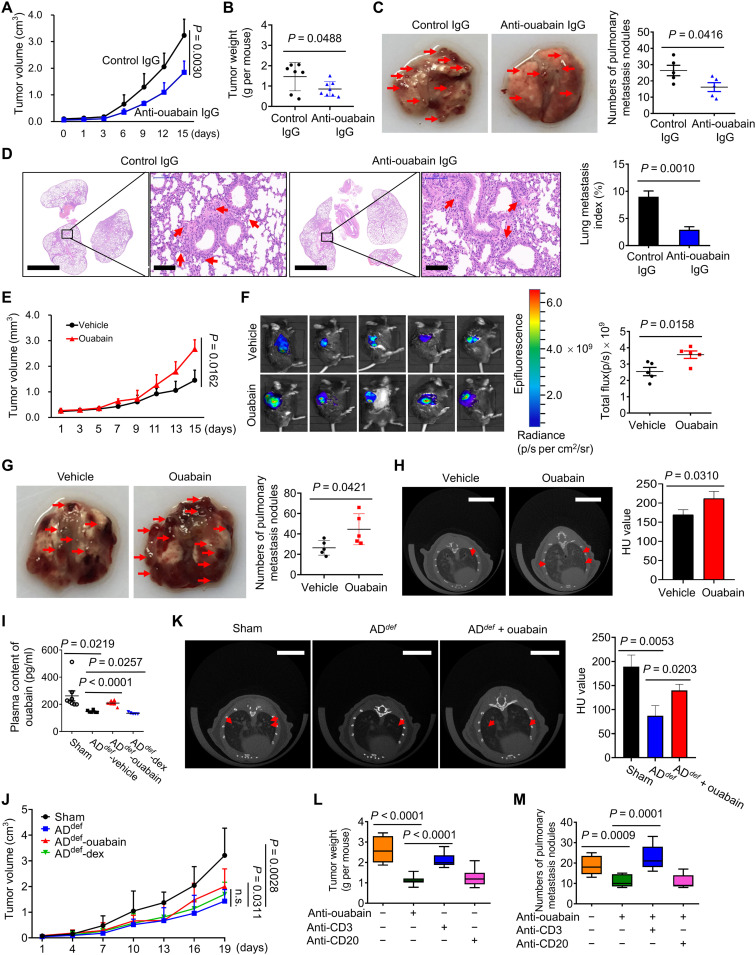
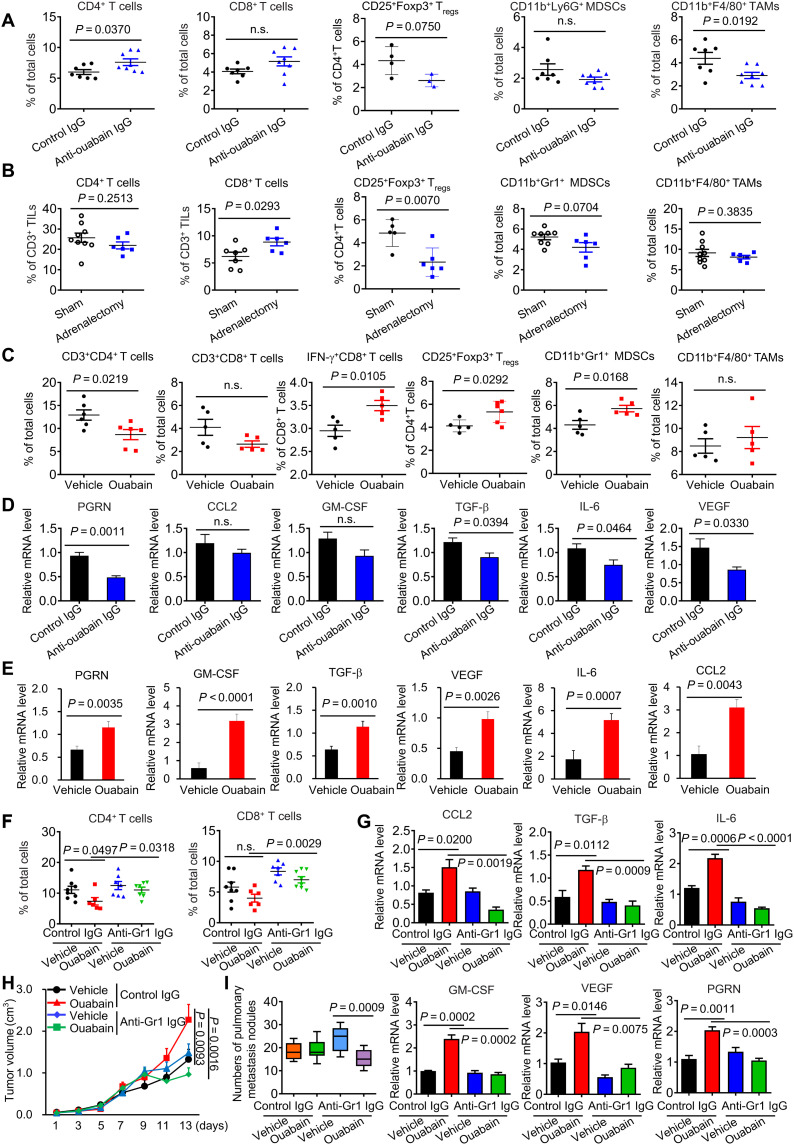
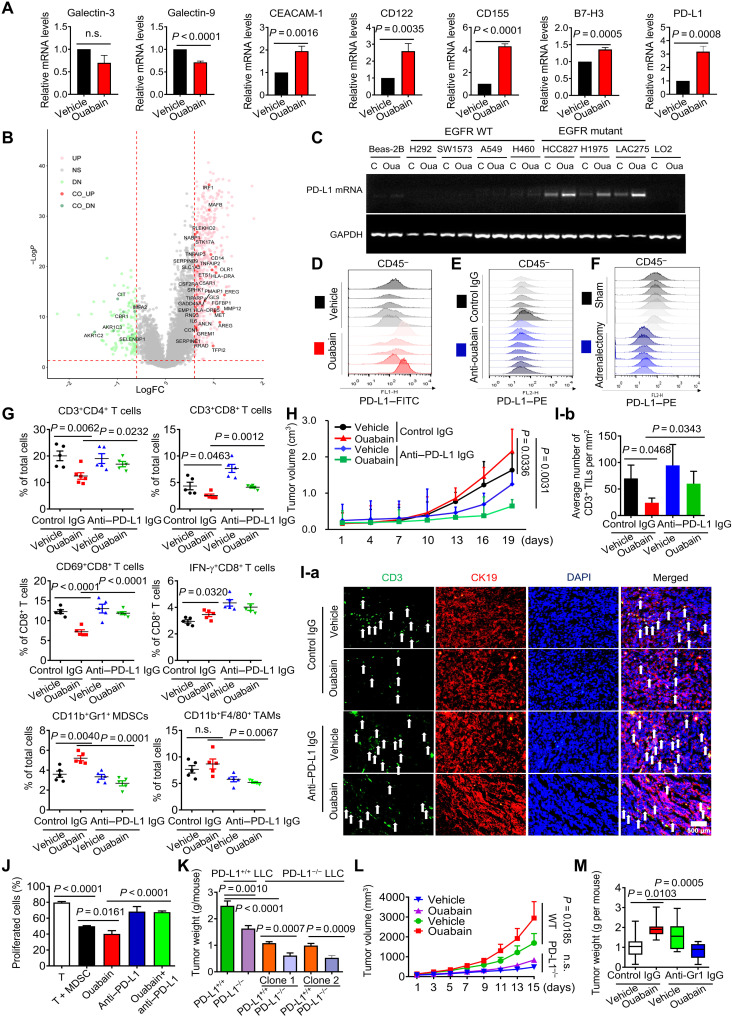
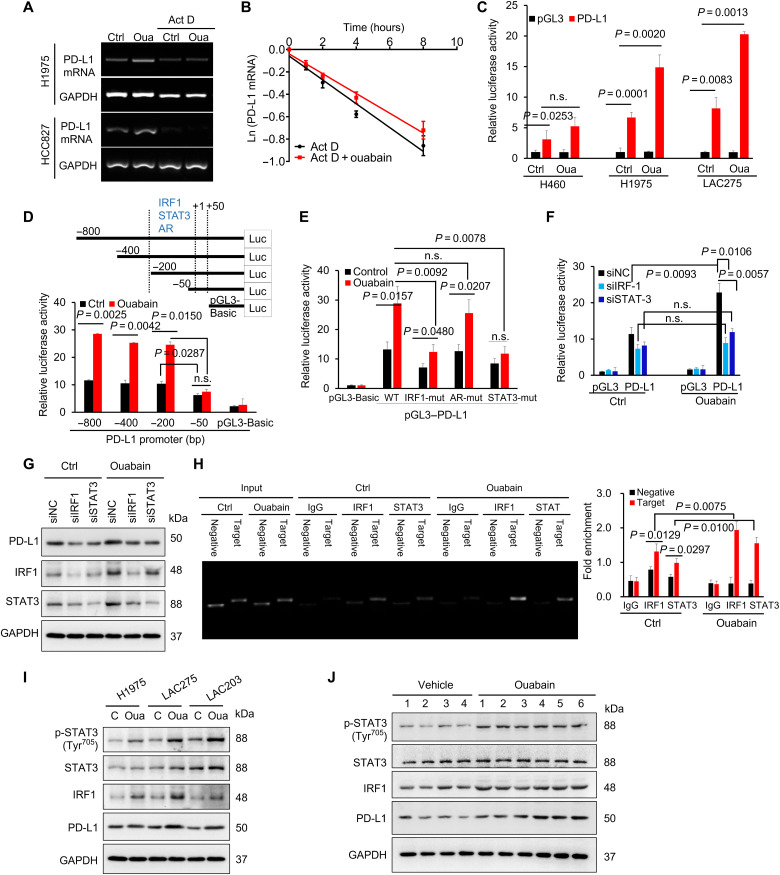
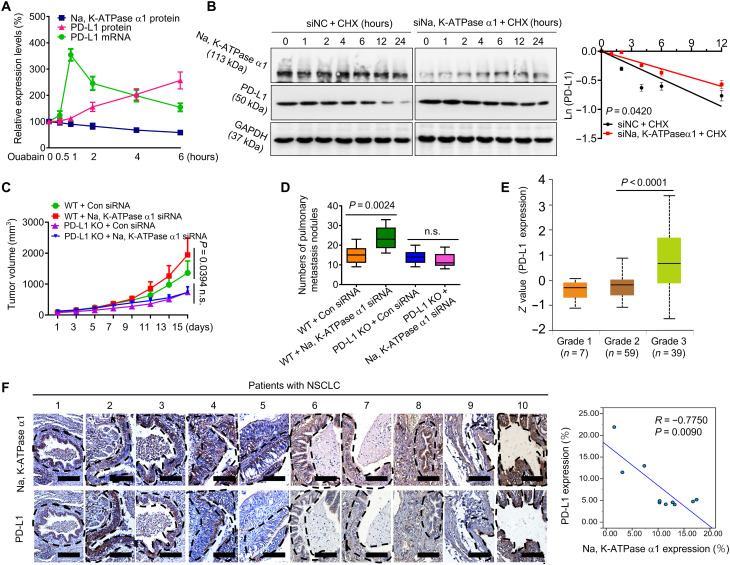
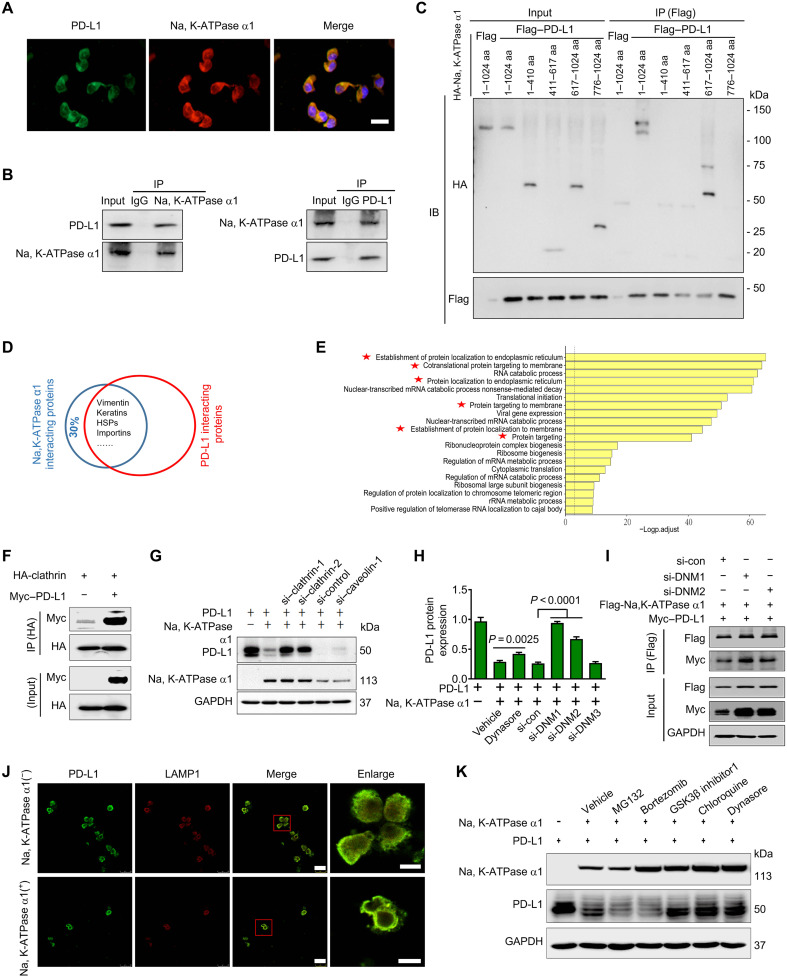
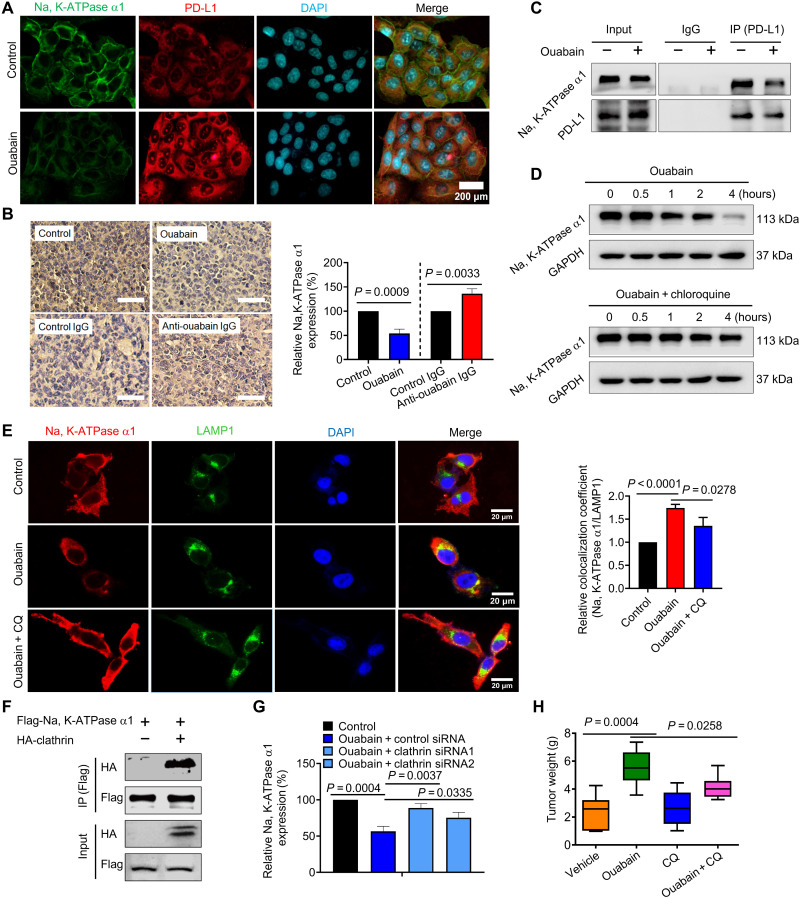
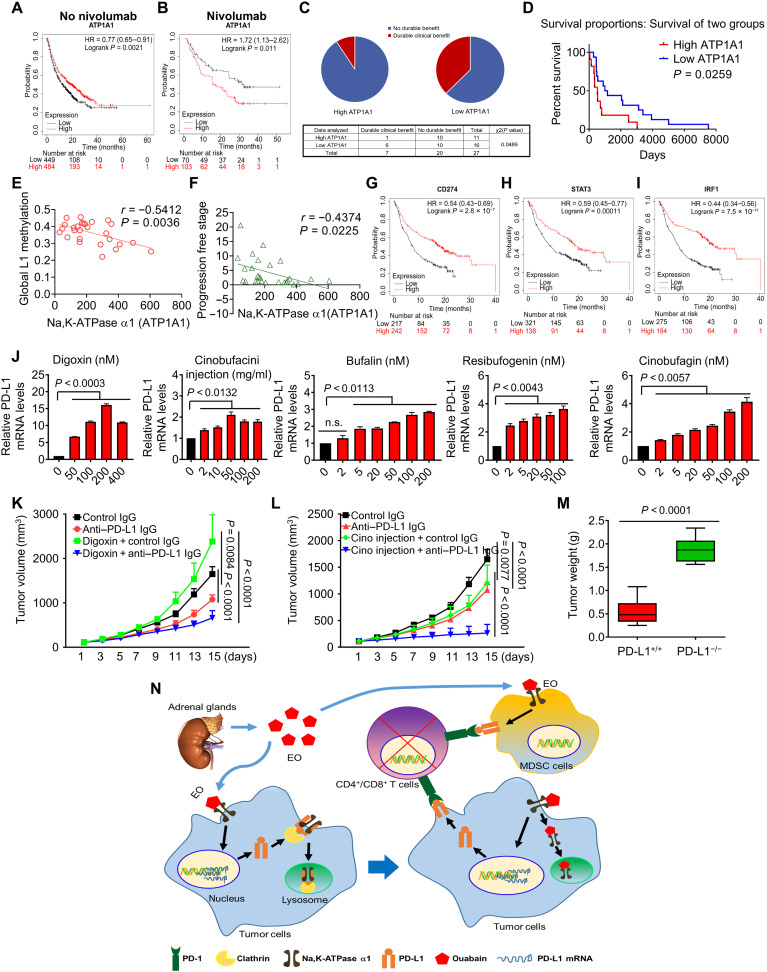
Dysregulated endocrine hormones (EHs) contribute to tumorigenesis, but how EHs affect the tumor immune microenvironment (TIM) and the immunotherapy of non-small cell lung cancer (NSCLC) is still unclear. Here, endogenous ouabain (EO), an adrenergic hormone, is elevated in patients with NSCLC and closely related to tumor pathological stage, metastasis, and survival. EO promotes the suppression of TIM in vivo by modulating the expression of immune checkpoint proteins, in which programmed cell death protein ligand 1 (PD-L1) plays a major role. EO increases PD-L1 transcription; however, the EO receptor Na- and K-dependent adenosine triphosphatase (Na, K-ATPase) α1 interacts with PD-L1 to trigger the endocytic degradation of PD-L1. This seemingly contradictory result led us to discover the mechanism whereby EO cooperates with Na, K-ATPase α1 to finely control PD-L1 expression and dampen tumoral immunity. In conclusion, the Na, K-ATPase α1/EO signaling facilitates immune escape in lung cancer, and manipulation of this signaling shows great promise in improving immunotherapy for lung adenocarcinoma.


Figures

Fig. 1.
Fig. 1.. Low expression of the Na, K-ATPase α1 in NSCLC correlates with poor prognosis.
(A) Analysis of Na, K-ATPase α1 expression in normal lung tissue or solid tumor of lung adenocarcinoma using DriverDBv3 database [DriverDBV3 (cmu.edu.tw)]. n (tumor) = 489 and n (normal) = 56. (B) Protein expressions of Na, K-ATPase α1 and proliferating cell nuclear antigen (PCNA) in tumor tissues of patients with NSCLC with different degrees of differentiation (left), as examined by immunohistochemical analysis. The correlation between Na, K-ATPase α1 and PCNA expression in tumor tissues of patients with NSCLC (n = 30). (C-a) Analysis of the association between Na, K-ATPase α1 and overall survival (OS) in patients with NSCLC in The Cancer Genome Atlas (TCGA) database. n (high) = 239 and n (low) = 239. GAPDH, glyceraldehyde-3-phosphate dehydrogenase. TPM, Transcripts Per Kilobase of exon model per Million mapped reads. (C-b) Analysis of the association between Na, K-ATPase α1 and OS in patients with advanced NSCLC in the Kaplan-Meier plotter database. n (high) = 53 and n (low) = 52. (D) Analysis of the association between Na, K-ATPase α1 and OS in patients with mesothelioma (MESO) [n (high) = 41 and n (low) = 41], kidney renal clear cell carcinoma (KIRC) [n (high) = 258 and n (low) = 258], and cervical adenocarcinoma (CESC) [n (high) = 146 and n (low) = 146] in TCGA database. (E) Lymphatic metastasis (LM) frequency in patients with NSCLC with different expression levels of Na, K-ATPase α1.
Fig. 2.
Fig. 2.. Serum EO is elevated in clinical lung adenocarcinoma and LLC mice.
(A) Top: Representative HPLC-MS/MS chromatogram and multiple reaction monitoring (MRM) chromatogram (bottom) of EO in plasma of patients with NSCLC. m/z, mass/charge ratio. (B) Quantitative analysis of EO in the plasma of healthy donors (n = 48) and patients with NSCLC (n = 41) by HPLC-MS/MS. (C) Comparison of plasma EO content in patients with NSCLC with different degrees of differentiation (n = 72). (D) Comparison of plasma EO content in patients with NSCLC with different metastasis frequencies (n = 40). (E) Cox regressive analysis of the risk factors influencing the survival of patients with NSCLC. **P<0.01, ***P<0.001. (F) Comparison of the survival of patients with NSCLC with different plasma EO content (n=80). (G) Measurement of plasma EO in various lung adenocarcinoma mice models (n=10). (H) Measurement of plasma EO in NOD-SCID or NSG immunodeficient mice inoculated with LLC cells, or in T cells-depleted mice using anti-CD3 neutralizing Ab, or in B cells-depleted mice using anti-CD20 neutralizing Ab, or in macrophages-depleted mice using GW2580 (n=10).
Fig. 3.
Fig. 3.. EO promotes lung cancer development in vivo.
(A) Effect of anti-ouabain IgG treatment in vivo on tumor growth (A) and weight (B) (n = 7 to 8). (C) Representative photos of pulmonary metastasis nodules and the metastatic nodules were indicated in red arrows. The numbers of pulmonary metastasis nodules were counted and plotted in right (n = 5). (D) Microscopic metastatic lesions in lungs of mice treated with either control IgG or anti-ouabain IgG, as examined by hematoxylin and eosin staining and quantified by using Image-Pro Plus Software in right (n = 5). Scale bars, 2000 μm; magnified scale bars, 100 μm. (E) Effect of ouabain treatment on LLC tumor growth (n = 5). (F) Representative fluorescence images of the in vivo tumor growth of mice injected with a red fluorescent protein (RFP)–labeled LLC cells, the quantitative analysis was performed in right (n = 5). (G) Representative photos of pulmonary metastasis nodules in control or ouabain-treated groups. The numbers of metastatic nodules were counted and plotted in right (n = 5). (H) Representative microcomputed tomography imaging of mice lung from the vehicle or anti-ouabain treatment group 30 days after inoculation with LLC cells, and the quantitative analysis is shown in right (n = 5). Scale bars, 5 mm. HU, Hounsfiled Unit. (I) The adrenal glands were surgically removed from C57BL/6 mice to produce AGdef mice. The tumor-bearing AGdef mice were challenged with ouabain or dexamethasone to detect the content of ouabain in plasma (n = 5 to 8). (J) The tumor-bearing AGdef mice were challenged with ouabain or dexamethasone to observe their effects on tumor growth (n = 5 to 8). (K) Representative microcomputed tomography imaging of LLC tumor-bearing AGdef mice lung after treatment with ouabain, and the quantification result is shown in right (n = 5 to 8). Scale bars, 5 mm. (L) Effects of T cells or B cells depletion on anti–ouabain-induced tumor growth inhibition and tumor metastasis suppression (M) (n = 9). n.s., not significant.
Fig. 4.
Fig. 4.. EO promotes the formation of tumor immunosuppressive microenvironment.
(A) Percentage of CD4+ T cells, CD8+ T cells, CD4+CD25+Foxp3+ regulatory T cells (Tregs), CD11b+Ly6G+ MDSCs, and CD11b+F4/80+ macrophages in the tumor tissues of the anti–ouabain-treated group, as measured by flow cytometry (n = 3 to 8). (B) Percentage of CD4+ T cells, CD8+ T cells, CD4+CD25+Foxp3+ Tregs, CD11b+Ly6G+ MDSCs, and CD11b+F4/80+ macrophages in the tumor tissues of sham or bilateral adrenalectomy-treated group, as measured by flow cytometry (n = 6 to 8). (C) Percentage of CD3+CD4+ T cells, CD3+CD8+ T cells, IFN-γ+CD8+ T cells, CD4+CD25+Foxp3+ Tregs, CD11b+Ly6G+ MDSCs, and CD11b+F4/80+ macrophages in the tumor tissues of the ouabain-treated group (n = 5 to 6). (D) The quantitative polymerase chain reaction (qPCR) analysis of PGRN, GM-CSF, VEGF, TGF-β, CCL2, and IL-6 mRNA expressions in the tumor tissues of the anti–ouabain-treated group (n = 7 to 8). (E) The qPCR analysis of PGRN, GM-CSF, VEGF, TGF-β, CCL2, and IL-6 expressions in the tumor tissues of the ouabain-treated group (n = 5 to 6). (F) Percentage of CD4+ T cells and CD8+ T cells in the tumor tissues of control IgG, ouabain, anti-Gr1 IgG, or anti-Gr1 IgG + ouabain–treated group (n = 6 to 8). (G) The qPCR analysis of PGRN, GM-CSF, VEGF, TGF-β, CCL2, and IL-6 mRNA expressions in the tumor tissues of control IgG, ouabain, anti-Gr1 IgG, or anti-Gr1 + ouabain–treated groups (n = 6 to 8). Effect of MDSCs depletion by anti-Gr1 IgG on ouabain-induced tumor growth (H) and pulmonary metastasis (I) (n = 6 to 8). TILs, tumor-infiltrating lymphocytes; GM-CSF, granulocyte-macrophage colony-stimulating factor; PGRN, progranulin.
Fig. 5.
Fig. 5.. PD-L1 plays a critical role in EO-mediated tumor immune escape.
(A) LAC275 cells were treated with ouabain at 50 nM for 6 hours, and mRNA expression was measured by qPCR. (B) The genes whose expression was positively or negatively correlated with PD-L1 were shown. LogFC, log fold change. (C) Cells were treated with ouabain at 50 nM for 6 hours, and the PD-L1 mRNA level was detected by semiquantitative PCR analysis. WT, wild type. (D to F) Representative histograms of PD-L1 surface protein expression on each tumor of LLC mice in different treatment groups [(D), n = 5; (E), n = 7 to 8; (F), n = 6 to 8]. FITC, fluorescein isothiocyanate. (G) Percentage of immune cells in the tumor tissues of different treatment groups (n = 5). (H) Effect of ouabain in combination with anti–PD-L1 IgG on LLC tumor growth (n = 5 to 7). (I-a) The immunofluorescent staining for CD3 (green), CK19 (red), and 4′,6-diamidino-2-phenylindole (DAPI) (blue) in the tumor tissues of different treatment groups. Scale bar, 500 μm. White arrows indicate the tumor-infiltrating CD3+ T cells. (I-b) Quantification of CD3+ T cell number per mm2 (n = 3 to 5). (J) Coculture of activated CD3+ T cells with bone marrow–derived cell under treatment with ouabain, anti–PD-L1 IgG, or both. CD3+T cell proliferation was measured by carboxyl fluorescein succinimidyl ester (CFSE) staining. (K) PD-L1+/+ or PD-L1−/− LLC cells of two clones were inoculated into PD-L1+/+ or PD-L1−/− mice to produce tumor-bearing mice, the mice were challenged with ouabain at 0.1 mg/kg tumor weight was measured (n = 9), and the tumor growth was plotted [(L), n = 9]. (M) PD-L1−/−cells were inoculated into PD-L1+/+ mice, and then the mice were challenged with anti-Gr1 IgG at 250 μg per mouse for 7 days and further treated with ouabain for a successive 12 days; the tumors weight was measured (n = 6 to 8).
Fig. 6.
Fig. 6.. Ouabain activated the PD-L1 gene promoter through signal transducer and activator of transcription 3 and interferon regulatory factor 1.
(A) PCR analysis of PD-L1 mRNA expression in lung cancer cells after the treatment of actinomycin D (Act D; 8 μg/ml) or ouabain (50 nM) or both for 4 hours. (B) LAC275 cells were treated with actinomycin D (8 μg/ml) or ouabain + actinomycin D (8 μg/ml) for different times. The mRNA levels were measured with qPCR analysis, and the half-life of PD-L1 mRNA was calculated. (C) LAC275, H460, and H1975 cells were transfected with the human PD-L1 full-length promoter-luciferase construct and were incubated without or with ouabain (50 nM) for 6 hours. the transcriptional activity of PD-L1 was determined by dual-luciferase reporter assay. (D) LAC275 cells were transfected with the deletion mutants of the human PD-L1 promoter, and the luciferase activity of each construct was determined. bp, base pair. (E) The PD-L1 promoter constructs with mutations in specific IRF1, AR, and STAT3 sites were transfected into cells; and the luciferase activity was measured. (F) Effect of interferon regulatory factor 1 (IRF1) and signal transducer and activator of transcription 3 (STAT3) knockdown on PD-L1 luciferase reporter activity. siNC, siRNA negative control. (G) The PD-L1 protein expression in LAC275 cells after IRF1 or STAT3 expression was silenced. (H) Binding of IRF1 and STAT3 into PD-L1 promoter, as examined by ChIP-qPCR assay. (I) Protein expressions levels of STAT3, phosphor (p)–STAT3, IRF1, and PD-L1 in lung cancer cells after treatment with ouabain (50 nM) for 8 hours. (J) Protein expression levels of STAT3, phosphor-STAT3, IRF1, and PD-L1 in tumor tissues from groups treated with vehicle or ouabain (0.1 mg kg−1).
Fig. 7.
Fig. 7.. Na, K-ATPase α1 negatively regulates PD-L1 protein expression in lung adenocarcinoma.
(A) LAC275 cells were treated with ouabain (50 nM) for 0.5, 1, 2, 4, and 6 hours; after treatments, Na, K-ATPase α1 protein, PD-L1 protein, and PD-L1 mRNA expression were examined by Western blot or qPCR analysis, respectively. (B) Left: LAC275 cells were transfected with small interfering RNA (siRNA) against Na, K-ATPase α1 or control siRNA and then treated with cycloheximide (CHX; 20 μg/ml) for different times, the indicated proteins were detected by Western blotting, and the half-life of PD-L1 protein was determined in right. (C) The PD-L1+/+(WT) or PD-L1−/−(KO) (knockout) LLC cells were inoculated into C57/BL6 to produce tumor-bearing mice; after tumor formation, the lentiviral Na, K-ATPase α1 shRNAs or control shRNAs were intratumorally delivered into mice, tumor size was monitored every 2 days, and the pulmonary metastasis of each group was quantified in (D) (n = 9). (E) Analysis of PD-L1 expression in patients with NSCLC with different pathological grades using the University of Alabama at Birmingham cancer data analysis Portal (UALCAN) database. (F) Left: Immunohistochemical analysis of the Na, K-ATPase α1 and PD-L1 protein expression in tumor tissues from patients with NSCLC. Scale bars, 200 mm. Right: Pearson correlation between the PD-L1 and Na, K-ATPase α1 expression in tumor tissue (n = 10).
Fig. 8.
Fig. 8.. Na, K-ATPase α1 interacts with PD-L1 and promotes PD-L1 endocytosis.
(A) The immunofluorescence analysis of the cellular location of Na, K-ATPase α1 and PD-L1 in LAC275 cells. Scale bar, 100 μm. (B) The interaction between endogenous Na, K-ATPase α1 and PD-L1. (C) The interaction between Na, K-ATPase α1 deletion mutant variants and PD-L1 in 293T cells. IB, immunoblot; aa, amino acids. (D) The shared proteins that interact with both Na, K-ATPase α1 and PD-L1 by immunoprecipitation mass spectrometry (IP-MS) analysis. HSP, Heat shock proteins. (E) The gene oncology enrichment analysis of the shared proteins in (D). (F) The interaction between HA-tagged clathrin and Myc-tagged PD-L1 in LAC275 cells. HA, hemagglutinin. (G) LAC275 cells were transfected with siRNAs against clathrin or caveolin-1, further cotransfected with Na, K-ATPase α1 and PD-L1 for 24 hours. Na, K-ATPase α1 and PD-L1 protein expressions were examined. (H) LAC275 cells were transfected with siRNAs against dynamin-1 (si-DNM1), dynamin-2, or dynamin-3, and further cotransfected with Na, K-ATPase α1 and PD-L1 for 24 hours. PD-L1 protein expression was examined. Cells were also treated with dynasore for 1 hour before harvesting. (I) LAC275 cells were transfected with siRNAs against dynamin-1 and dynamin-2, and further cotransfected with Flag-tagged Na, K-ATPase α1 and Myc-tagged PD-L1 for 24 hours, Na, K-ATPase α1/PD-L1 interaction was detected by immunoblotting. (J) The lysosomal colocalization of PD-L1 and LAMP1. LAMP1 was used to stain the lysosome. Scale bars, 25 μm; magnified scale bars, 5 μm. (K) After transfection with PD-L1 and Na, K-ATPase α1 for 24 hours, LAC275 cells were treated with different chemical inhibitors for 1 to 5 hours, and protein expressions of Na, K-ATPase α1 and PD-L1 were examined.
Fig. 9.
Fig. 9.. Ouabain inhibits Na, K-ATPase α1/PD-L1 interaction and promotes lysosomal degradation of Na, K-ATPase α1.
(A) LAC275 cells were treated with ouabain (50 nM) for 6 hours, and the cellular expression and distribution of Na, K-ATPase α1 and PD-L1 were detected by immunofluorescence analysis. (B) LLC mice were challenged with ouabain or anti-ouabain IgG, then immunohistochemical analysis was performed to examine Na, K-ATPase α1 expression in tumor tissues, and the quantification results are shown in right (n = 3 to 5). (C) The interaction between endogenous Na, K-ATPase α1/PD-L1 in LAC275 cells after treatment with ouabain (50 nM). (D) LAC275 cells were treated with ouabain alone or ouabain + CQ at different times, and then Na, K-ATPase α1 protein expression was examined. (E) Left: LAC275 cells were treated with ouabain (50 nM) or ouabain + CQ for 12 hours, and then the lysosomal location of Na, K-ATPase α1 (red) was detected by immunofluorescence. Scale bars, 20 μm. Right: Colocalization coefficient (Na, K-ATPase α1/LAMP1) was analyzed by ImageJ software. (F) The interaction between HA-tagged clathrin and Flag-tagged Na, K-ATPase α1 in LAC275 cells. (G) After transfection with control siRNA or siRNAs against clathrin, LAC275 cells were treated with ouabain at 50 nM for 8 hours, and membrane Na, K-ATPase α1 abundance was detected by flow cytometry analysis. (H) LLC mice were challenged with ouabain (0.1 mg/kg), CQ, or both for a successive 15 days, and after experiments, tumors were removed and weighed (n = 7 to 8).
Fig. 10.
Fig. 10.. Na, K-ATPase α1/EO signaling in the immunotherapy of lung adenocarcinoma.
(A) The survival of patients with cancer with different expression levels of Na, K-ATPase α1, as analyzed by data in the Kaplan-Meier plotter database. (B) The survival of patients with cancer with different expression levels of Na, K-ATPase α1 after nivolumab treatment. Patients with bladder cancer, esophageal adenocarcinoma, glioblastoma, hepatocellular carcinoma, head and neck squamous cell carcinoma, melanoma, NSCLC, small cell lung cancer, and urothelial cancer were included in the analysis (A and B). Clinical benefit (C) and survival (D) of NSCLC patients with the different expression levels of Na, K-ATPase α1 after anti–PD-1/PD-L1 therapy; the data are obtained from GSE135222. Correlation of Na, K-ATPase α1 expression level in patients with NSCLC with global L1 methylation (E) and progression-free stage (F). The survival of patients with different expression levels of PD-L1 (CD274) (G), STAT3 (H), or IRF1 (I) after anti–PD-1 IgG therapy. The patients included are the same as that in (A) and (B). (J) LAC275 cells were treated with different dosages of digoxin, cinobufacini injection, bufalin, cinobufagin, and resibufogenin for 6 hours; PD-L1 mRNA expression was detected by qPCR analysis. LLC mice were challenged with digoxin (K) and cinobufacini injection (L) in combination with anti–PD-L1 IgG for a successive 15 days, and tumor size was monitored every 2 days (n = 7 to 8). (M) PD-L1+/+ and PD-L1−/− LLC cells were inoculated into C57/BL6 mice to produce a tumor-bearing model and then challenged with cinobufacini injection in combination with anti–PD-L1 IgG, and after experiments, tumors were removed and weighed (n = 9). (N) Na, K-ATPase α1/EO signaling promotes tumor immune escape in lung adenocarcinoma by fine-tuning PD-L1 expression.

Similar articles

Cited by

References

    1. G. Morad, B. A. Helmink, P. Sharma, J. A. Wargo, Hallmarks of response, resistance, and toxicity to immune checkpoint blockade. Cell 184, 5309–5337 (2021). - PMC - PubMed
    1. J. M. Pitt, M. Vetizou, R. Daillere, M. P. Roberti, T. Yamazaki, B. Routy, P. Lepage, I. G. Boneca, M. Chamaillard, G. Kroemer, L. Zitvogel, Resistance mechanisms to immune-checkpoint blockade in cancer: Tumor-intrinsic and -extrinsic factors. Immunity 44, 1255–1269 (2016). - PubMed
    1. R. S. Herbst, D. Morgensztern, C. Boshoff, The biology and management of non-small cell lung cancer. Nature 553, 446–454 (2018). - PubMed
    1. M. J. Grant, R. S. Herbst, S. B. Goldberg, Selecting the optimal immunotherapy regimen in driver-negative metastatic NSCLC. Nat. Rev. Clin. Oncol. 18, 625–644 (2021). - PubMed
    1. M. Wu, Q. Huang, Y. Xie, X. Wu, H. Ma, Y. Zhang, Y. Xia, Improvement of the anticancer efficacy of PD-1/PD-L1 blockade via combination therapy and PD-L1 regulation. J. Hematol. Oncol. 15, 24 (2022). - PMC - PubMed