. 2023 Feb 10;19(2):e1010347.
doi: 10.1371/journal.pgen.1010347. eCollection 2023 Feb.

Stepwise recombination suppression around the mating-type locus in an ascomycete fungus with self-fertile spores

Affiliations

Stepwise recombination suppression around the mating-type locus in an ascomycete fungus with self-fertile spores

Nina Vittorelli et al. PLoS Genet. .

Abstract

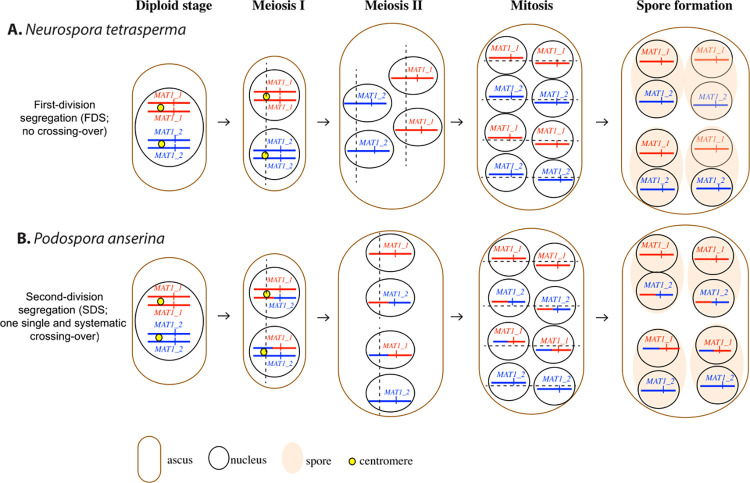
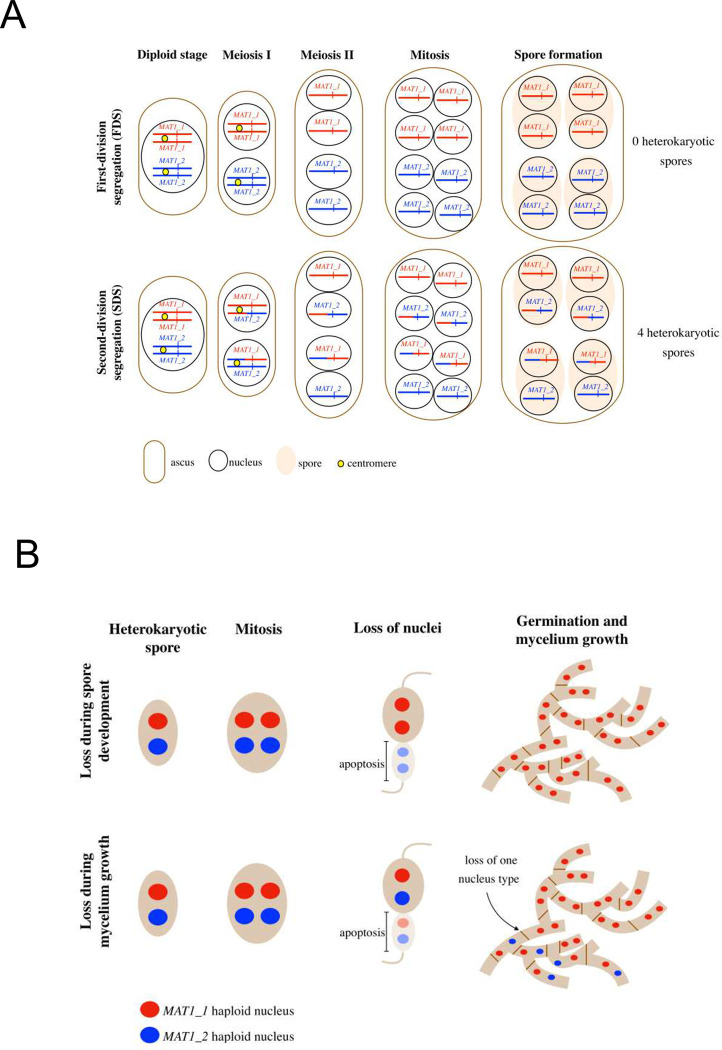
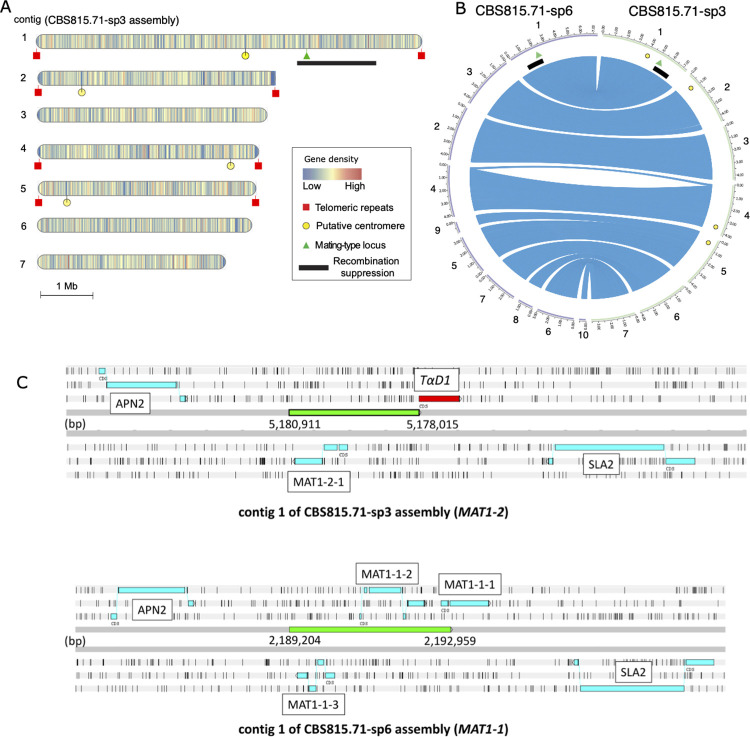
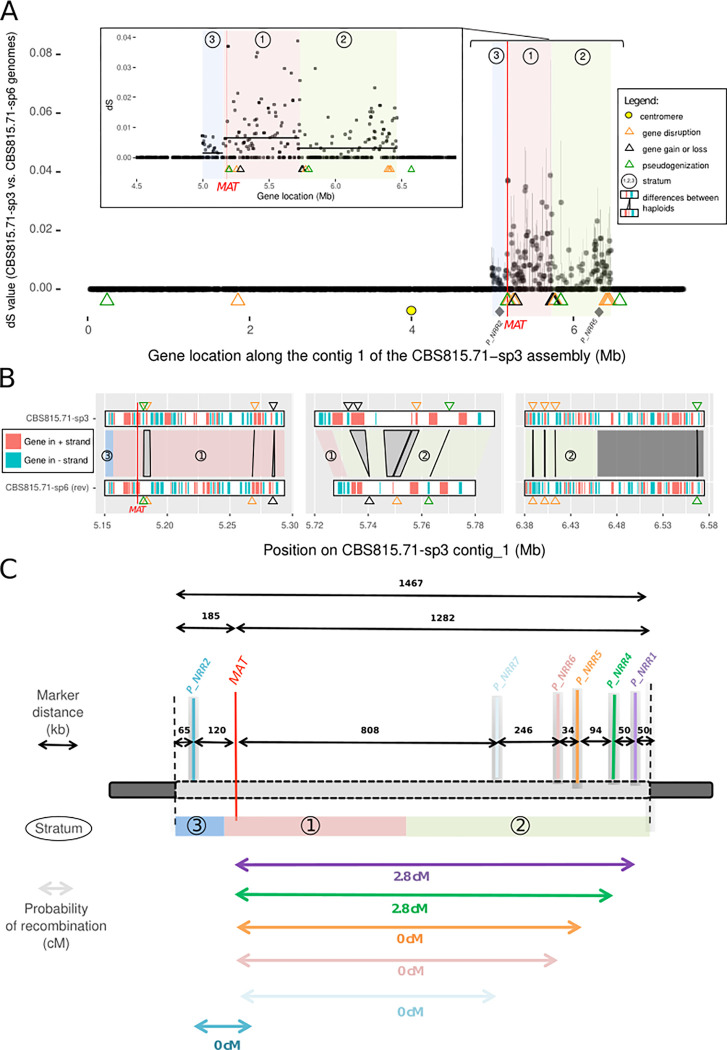
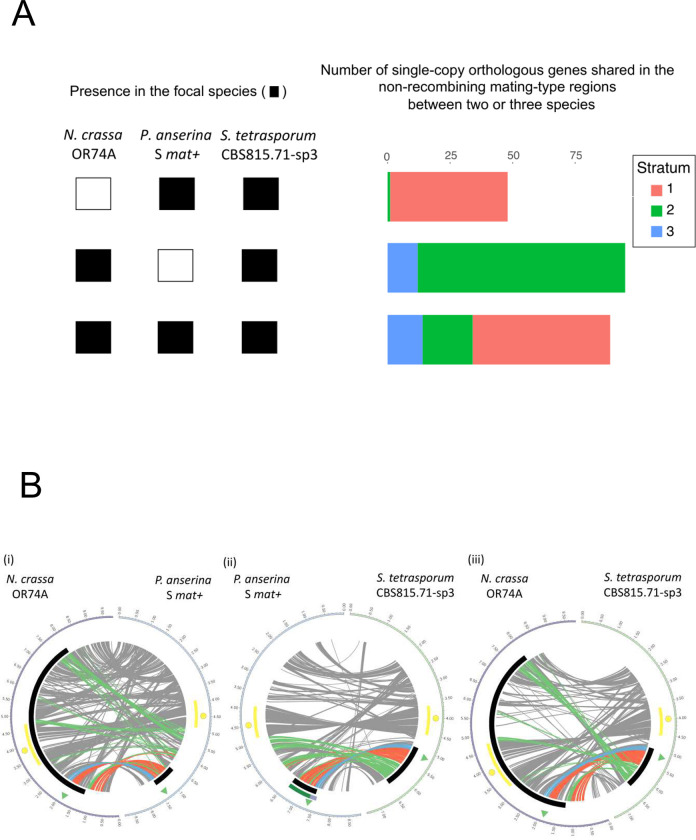
Recombination is often suppressed at sex-determining loci in plants and animals, and at self-incompatibility or mating-type loci in plants and fungi. In fungal ascomycetes, recombination suppression around the mating-type locus is associated with pseudo-homothallism, i.e. the production of self-fertile dikaryotic sexual spores carrying the two opposite mating types. This has been well studied in two species complexes from different families of Sordariales: Podospora anserina and Neurospora tetrasperma. However, it is unclear whether this intriguing association holds in other species. We show here that Schizothecium tetrasporum, a fungus from a third family in the order Sordariales, also produces mostly self-fertile dikaryotic spores carrying the two opposite mating types. This was due to a high frequency of second meiotic division segregation at the mating-type locus, indicating the occurrence of a single and systematic crossing-over event between the mating-type locus and the centromere, as in P. anserina. The mating-type locus has the typical Sordariales organization, plus a MAT1-1-1 pseudogene in the MAT1-2 haplotype. High-quality genome assemblies of opposite mating types and segregation analyses revealed a suppression of recombination in a region of 1.47 Mb around the mating-type locus. We detected three evolutionary strata, indicating a stepwise extension of recombination suppression. The three strata displayed no rearrangement or transposable element accumulation but gene losses and gene disruptions were present, and precisely at the strata margins. Our findings indicate a convergent evolution of self-fertile dikaryotic sexual spores across multiple ascomycete fungi. The particular pattern of meiotic segregation at the mating-type locus was associated with recombination suppression around this locus, that had extended stepwise. This association between pseudo-homothallism and recombination suppression across lineages and the presence of gene disruption at the strata limits are consistent with a recently proposed mechanism of sheltering deleterious alleles to explain stepwise recombination suppression.


Conflict of interest statement

The authors have no competing interests.

Figures

Fig 1
Fig 1. Mating-type segregation and nuclei compaction in spores during ascus development in the pseudo-homothallic fungi Neurospora tetrasperma (A) and Podospora anserina (B) (Sordariales, Ascomycota).
In each panel, five stages are represented from left to right: the diploid cell before meiosis with a nucleus heterozygous at the mating-type locus; the first division of meiosis (meiosis I); the second division of meiosis (meiosis II); the post-meiotic mitoses (PMM); and the spore formation with the compaction of non-sister nuclei in N. tetrasperma and sister nuclei in P. anserina. Only the chromosomes carrying the mating-type locus are represented, with their centromeres. The opposite MAT1-1 and MAT1-2 alleles at the mating-type locus are represented by red and blue vertical bars, respectively. The mating-type locus segregate at meiosis I in N. tetrasperma and at meiosis II in P. anserina. During meiosis II, spindles are parallel in N. tetrasperma and aligned in P. anserina. The standard nomenclature of mating-type alleles is used, with MAT1-2 corresponding to the mat+ and mat_a allele and MAT1-1 to the mat- and mat_A allele in P. anserina and N. tetrasperma, respectively. Centromeres are represented by yellow circles at the diploid and meiosis I stages. Chromosomal arms are colored in red or blue according to the parental origin of the chromosomal fragment. Spindle orientations in meiosis and mitoses are indicated by dotted line. The figure was adapted from Ref (4).
Fig 2
Fig 2. Sexual reproductive structures and ascospores of Schizothecium tetrasporum CBS815.71.
A. Perithecia on Miscanthus [1] and squashed perithecia showing the rosette of asci [2]; bars = 200 μm. B. Enlargements of asci within the rosettes [1] and a five-spore ascus with three dikaryotic ascospores and two monokaryotic ascospores [2]; bars = 20 μm. C. Other abnormal asci observed in CBS815.71: [1] a six-spore ascus with four monokaryotic ascospores (small) and two dikaryotic ones (large); [2] a five-spore ascus with three monokaryotic ascospores (the three small spores in the middle), one dikaryotic (the large ascospore at the bottom) and another, probably trikaryotic, ascospore (arrowhead showing the very large ascospore); bars = 20 μm.
Fig 3
Fig 3. Tested scenarios of segregation of the mating-type locus during meiosis and theoretical ascus composition and hypothetical scenarios for the loss of one mating type in thalli of Schizothecium tetrasporum.
A. Theoretical composition of an ascus according to meiotic segregation pattern at the mating-type locus: if alleles at the mating-type locus (represented as a red or blue vertical bar) segregate during the first meiotic division (FDS, top), two MAT-1-1 spores and two MAT-1-2 spores are formed; conversely, if alleles at the mating-type locus segregate during the second meiotic division (SDS, bottom), four heterokaryotic spores carrying both mating types are formed. Only the chromosomes carrying the mating-type locus are represented, with their centromeres. The MAT-1-1 and MAT1-2 alleles at the mating-type locus are represented by red and blue vertical bars, respectively. Centromeres are represented by yellow circles at the diploid and meiosis I stages. Chromosomal arms are colored in red or blue according to the parental origin of the chromosomal fragment. B. Two hypothetical scenarios for the loss of one mating type despite SDS at the mating-type locus. SDS at the mating-type locus generates a spore carrying two nuclei of opposite mating types, but one nucleus may be lost during spore development (top) when half the nuclei gather in a region of the spore that subsequently undergoes degeneration, or during mycelium growth (bottom).
Fig 4
Fig 4. Genome features and annotation of the mating-type locus in the Schizothecium tetrasporum CBS815.71 strain.
A. Ideograms representing the seven largest contigs of the CBS815.71-sp3 genome assembly. The mating-type locus is indicated with a green triangle, telomeric repeats with red boxes and putative centromeres with yellow circles. Gene density in 10 kb non-overlapping windows is represented by vertical bars on the contigs and the heatmap colors indicate low to high density. The non-recombining region around the mating-type locus is indicated by a black rectangle. B. Genome collinearity between opposite mating types of the Schizothecium tetrasporum CBS815.71 strain. Circular plot showing contigs from the CBS815.71-sp3 genome (green, right) and the CBS815.71-sp6 genome (purple, left). Only the largest contigs (>500 kb) were plotted. Blue links indicate the locations of orthologous genes (Mb). The mating-type locus is indicated with a green triangle. Putative centromeres and the non-recombining region around the mating-type locus identified on the CBS815.71-sp3 genome assembly are indicated by yellow circles and a black rectangle, respectively. C. Organization of the mating-type locus in CBS815.71-sp3 (top, MAT1-2) and CBS815.71-sp6 (bottom, MAT1-1) assemblies viewed in Artemis v18.0.2 [125]. The APN2 and SLA2 genes flanking the mating-type locus are indicated. The green boxes represent the nucleotide sequences differing between the two idiomorphs that were used to design markers for assessing mating type in the progeny. Coordinates of the region differing between MAT1-1 and MAT1-2 are indicated on contig 1 of the CBS815.71-sp3 assembly for MAT1-2 and on contig 1 of the CBS815.71-sp6 assembly for MAT1-1. Contigs 1 of the CBS815.71-sp3 and CBS815.71-sp6 assemblies were assembled on opposite strands but for visualization purpose the same strand of both assemblies is shown on the figure. The MAT1-1-1 pseudogene (TαD1) present in the CBS815.71-sp3 (MAT1-2) genome is boxed in red. The three forward and three reverse frames of the DNA sequence are presented; vertical bars indicate putative STOP codons.
Fig 5
Fig 5. Evidence for recombination suppression around the mating-type locus in the Schizothecium tetrasporum CBS815.71 strain.
A. Synonymous divergence (dS) and its standard deviation along the mating-type chromosome in the S. tetrasporum CBS815.71 strain. dS was calculated per gene, between the orthologs common to the CBS815.71-sp3 and CBS815.71-sp6 assemblies and was plotted, according to the CBS815.71-sp3 assembly gene position (contig 1), along the x-axis. The mating-type locus is indicated with a red vertical line. The putative centromere is indicated with a yellow circle. The P_NRR2 and P_NRR5 markers, which displayed no recombination event with the mating-type locus, are indicated with gray diamonds. The inset shows a zoom on the three strata, with dS values in the region located between 4.5 Mb and 6.5 Mb of the contig 1; black horizontal bars represent the mean dS values of evolutionary strata 1, 2, and 3, respectively. In both plots, evolutionary strata 1, 2, and 3 are indicated by red, green and blue rectangles, respectively, and their numbers in circles. Gene disruption, gene gain or loss and pseudogenization events are indicated by orange, black and green triangles, respectively. B. Zoom in the regions with putative deleterious mutations identified as synteny breaks near strata edges. Links between CBS815.71-sp3 and CBS815.71-sp6 assemblies correspond to gene-disrupting, pseudogenizing or gain/loss events induced by indels, point mutations disrupting the stop codon or extreme sequence divergence. The original figure obtained with pafr is shown in S9 Fig. Symbol and color shading key are the same as in panel A, with differences between haploid genomes shown by black vetical lines and grey rectangles. C. Probability of recombination in centimorgans (cM) between markers and the mating-type locus in the heterokaryotic strain CBS815.71 after one round of experimental selfing measured in 107 offspring. The non-recombining region and the evolutionary strata 1, 2, 3 defined based on dS values in the heterokaryotic strain CBS815.71 are shown with red, green and blue rectangles, respectively and their numbers in circles. Relative locations of the mating-type locus (MAT) and markers tested (P_NRR1, P_NRR2, P_NRR4, P_NRR5, P_NRR6, P_NRR7) are shown with vertical bars. Genomic distances (in kilobases) between markers are indicated above black arrows.
Fig 6
Fig 6. Shared gene content and collinearity between the mating-type chromosomes of Schizothecium tetrasporum, Podospora anserina and Neurospora tetrasperma.
A. Number of single-copy orthologous genes present in the non-recombining region of S. tetrasporum that are also in the non-recombining regions of P. anserina and/or N. tetrasperma, as indicated by the squares at the bottom (a filled square indicates the presence in the non-recombining region of the focal species). B. Collinearity between (i) N. crassa (left) and P. anserina (right); (ii) P. anserina (left) and S. tetrasporum (right); (iii) N. crassa (left) and S. tetrasporum (right). Collinearity is based on single-copy orthologous genes. Centromere is indicated with a yellow circle and the region of well-conserved gene order around the centromere is highlighted with a yellow rectangle. The mating-type locus location is shown with a green triangle and the non-recombining region around the mating-type locus in P. anserina [27] and S. tetrasporum with a black track. Along the recombining mating-type chromosome of N. crassa a black rectangle indicates the orthologous region that is non recombining in multiple N. tetrasperma lineages [30]. Red, green and blue links highlight orthologous genes located in the evolutionary strata 1, 2, and 3 of S. tetrasporum, respectively. Grey links indicate other orthologous genes. On panel (ii), the evolutionary strata identified previously in the P. pseudocomata CBS415.72 strain, that is closely related to the P. anserina S strain, are indicated by purple (for the oldest stratum) and dark green (for the youngest stratum) tracks [31], at left.

Similar articles

Cited by

References

    1. Muller HJ. Some genetic aspects of sex. Am Nat. 1932. Mar 1;66(703):118–38.
    1. Hill WG, Robertson A. The effect of linkage on limits to artificial selection. Genet Res. 1966. Dec;8(3):269–94. - PubMed
    1. Uyenoyama MK. Evolution under tight linkage to mating type. New Phytol. 2005;165(1):63–70. doi: 10.1111/j.1469-8137.2004.01246.x - DOI - PubMed
    1. Hartmann FE, Duhamel M, Carpentier F, Hood ME, Foulongne-Oriol M, Silar P, et al.. Recombination suppression and evolutionary strata around mating-type loci in fungi: documenting patterns and understanding evolutionary and mechanistic causes. New Phytol. 2021;229(5):2470–91. doi: 10.1111/nph.17039 - DOI - PMC - PubMed
    1. Goubet PM, Bergès H, Bellec A, Prat E, Helmstetter N, Mangenot S, et al.. Contrasted patterns of molecular evolution in dominant and recessive self-incompatibility haplotypes in Arabidopsis. PLOS Genet. 2012. Mar 22;8(3):e1002495. doi: 10.1371/journal.pgen.1002495 - DOI - PMC - PubMed

Publication types