Proteome Coverage after Simultaneous Proteo-Metabolome Liquid-Liquid Extraction
- PMID: 36763818
- PMCID: PMC9990123
- DOI: 10.1021/acs.jproteome.2c00758
Proteome Coverage after Simultaneous Proteo-Metabolome Liquid-Liquid Extraction
Abstract
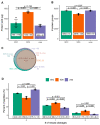
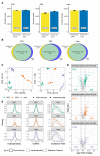
Proteomics and metabolomics are essential in systems biology, and simultaneous proteo-metabolome liquid-liquid extraction (SPM-LLE) allows isolation of the metabolome and proteome from the same sample. Since the proteome is present as a pellet in SPM-LLE, it must be solubilized for quantitative proteomics. Solubilization and proteome extraction are critical factors in the information obtained at the proteome level. In this study, we investigated the performance of two surfactants (sodium deoxycholate (SDC), sodium dodecyl sulfate (SDS)) and urea in terms of proteome coverage and extraction efficiency of an interphase proteome pellet generated by methanol-chloroform based SPM-LLE. We also investigated how the performance differs when the proteome is extracted from the interphase pellet or by direct cell lysis. We quantified 12 lipids covering triglycerides and various phospholipid classes, and 25 polar metabolites covering central energy metabolism in chloroform and methanol extracts. Our study reveals that the proteome coverages between the two surfactants and urea for the SPM-LLE interphase pellet were similar, but the extraction efficiencies differed significantly. While SDS led to enrichment of basic proteins, which were mainly ribosomal and ribonuclear proteins, urea was the most efficient extraction agent for simultaneous proteo-metabolome analysis. The results of our study also show that the performance of surfactants for quantitative proteomics is better when the proteome is extracted through direct cell lysis rather than an interphase pellet. In contrast, the performance of urea for quantitative proteomics was significantly better when the proteome was extracted from an interphase pellet than by direct cell lysis. We demonstrated that urea is superior to surfactants for proteome extraction from SPM-LLE interphase pellets, with a particularly good performance for the extraction of proteins associated with metabolic pathways. Data are available via ProteomeXchange with identifier PXD027338.
Keywords: SP3; bottom-up proteomics; in-solution digest; label free quantification; mass spectrometry; metabolomics; proteomics; sample preparation; simultaneous proteo-metabolomics.
Conflict of interest statement
The authors declare no competing financial interest.
Figures


Similar articles
-
Proteinase K Combining Two-Step Liquid-Liquid Extraction for Plasma Untargeted Liquid Chromatography-Mass Spectrometry-Based Metabolomics To Discover the Potential Mechanism of Colorectal Adenoma.Anal Chem. 2019 Nov 19;91(22):14458-14466. doi: 10.1021/acs.analchem.9b03121. Epub 2019 Oct 30. Anal Chem. 2019. PMID: 31613596
-
Ecological Monitoring and Omics: A Comprehensive Comparison of Workflows for Mass Spectrometry-Based Quantitative Proteomics of Fish (Labeo rohita) Liver Tissue.OMICS. 2022 Sep;26(9):489-503. doi: 10.1089/omi.2022.0086. Epub 2022 Aug 26. OMICS. 2022. PMID: 36036978
-
A systematic evaluation of quenching and extraction procedures for quantitative metabolome profiling of HeLa carcinoma cell under 2D and 3D cell culture conditions.Biotechnol J. 2023 May;18(5):e2200444. doi: 10.1002/biot.202200444. Epub 2023 Feb 24. Biotechnol J. 2023. PMID: 36796787
-
Sample Clean-up Strategies for ESI Mass Spectrometry Applications in Bottom-up Proteomics: Trends from 2012 to 2016.Proteomics. 2017 Oct;17(20). doi: 10.1002/pmic.201700011. Epub 2017 Apr 12. Proteomics. 2017. PMID: 28271630 Review.
-
Systems biology-based analysis of cell-free systems.Curr Opin Biotechnol. 2022 Jun;75:102703. doi: 10.1016/j.copbio.2022.102703. Epub 2022 Mar 2. Curr Opin Biotechnol. 2022. PMID: 35247659 Free PMC article. Review.
Cited by
-
SIMPLEX Enriches Hydrophobic and Lipidated Proteins in Membrane Proteomics Experiments.Proteomics. 2025 Aug;25(16):28-39. doi: 10.1002/pmic.70016. Epub 2025 Aug 8. Proteomics. 2025. PMID: 40776855 Free PMC article.
-
Integrative metabolomics-genomics analysis identifies key networks in a stem cell-based model of schizophrenia.Mol Psychiatry. 2024 Oct;29(10):3128-3140. doi: 10.1038/s41380-024-02568-8. Epub 2024 Apr 29. Mol Psychiatry. 2024. PMID: 38684795 Free PMC article.
-
α-Tocopherol-13'-Carboxychromanol Induces Cell Cycle Arrest and Cell Death by Inhibiting the SREBP1-SCD1 Axis and Causing Imbalance in Lipid Desaturation.Int J Mol Sci. 2023 May 25;24(11):9229. doi: 10.3390/ijms24119229. Int J Mol Sci. 2023. PMID: 37298183 Free PMC article.
-
Silybin A from Silybum marianum reprograms lipid metabolism to induce a cell fate-dependent class switch from triglycerides to phospholipids.Theranostics. 2025 Jan 6;15(5):2006-2034. doi: 10.7150/thno.99562. eCollection 2025. Theranostics. 2025. PMID: 39897559 Free PMC article.
-
Attenuated growth factor signaling during cell death initiation sensitizes membranes towards peroxidation.Nat Commun. 2025 Feb 25;16(1):1774. doi: 10.1038/s41467-025-56711-2. Nat Commun. 2025. PMID: 40000627 Free PMC article.
References
-
- Huang H.; van Dullemen L. F. A.; Akhtar M. Z.; Faro M. L.; Yu Z.; Valli A.; Dona A.; Thezenas M. L.; Charles P. D.; Fischer R.; et al. Proteo-metabolomics reveals compensation between ischemic and non-injured contralateral kidneys after reperfusion. Sci. Rep 2018, 8 (1), 8539.10.1038/s41598-018-26804-8. - DOI - PMC - PubMed
-
- Kiebish M. A.; Cullen J.; Mishra P.; Ali A.; Milliman E.; Rodrigues L. O.; Chen E. Y.; Tolstikov V.; Zhang L.; Panagopoulos K.; et al. Multi-omic serum biomarkers for prognosis of disease progression in prostate cancer. J. Transl Med. 2020, 18 (1), 10.10.1186/s12967-019-02185-y. - DOI - PMC - PubMed
Publication types
MeSH terms
Substances
LinkOut - more resources
Full Text Sources

