. 2023 Apr:140:105702.
doi: 10.1016/j.jmbbm.2023.105702. Epub 2023 Feb 3.

Smooth muscle contribution to vaginal viscoelastic response

Affiliations

Smooth muscle contribution to vaginal viscoelastic response

Gabrielle L Clark-Patterson et al. J Mech Behav Biomed Mater. 2023 Apr.

Abstract

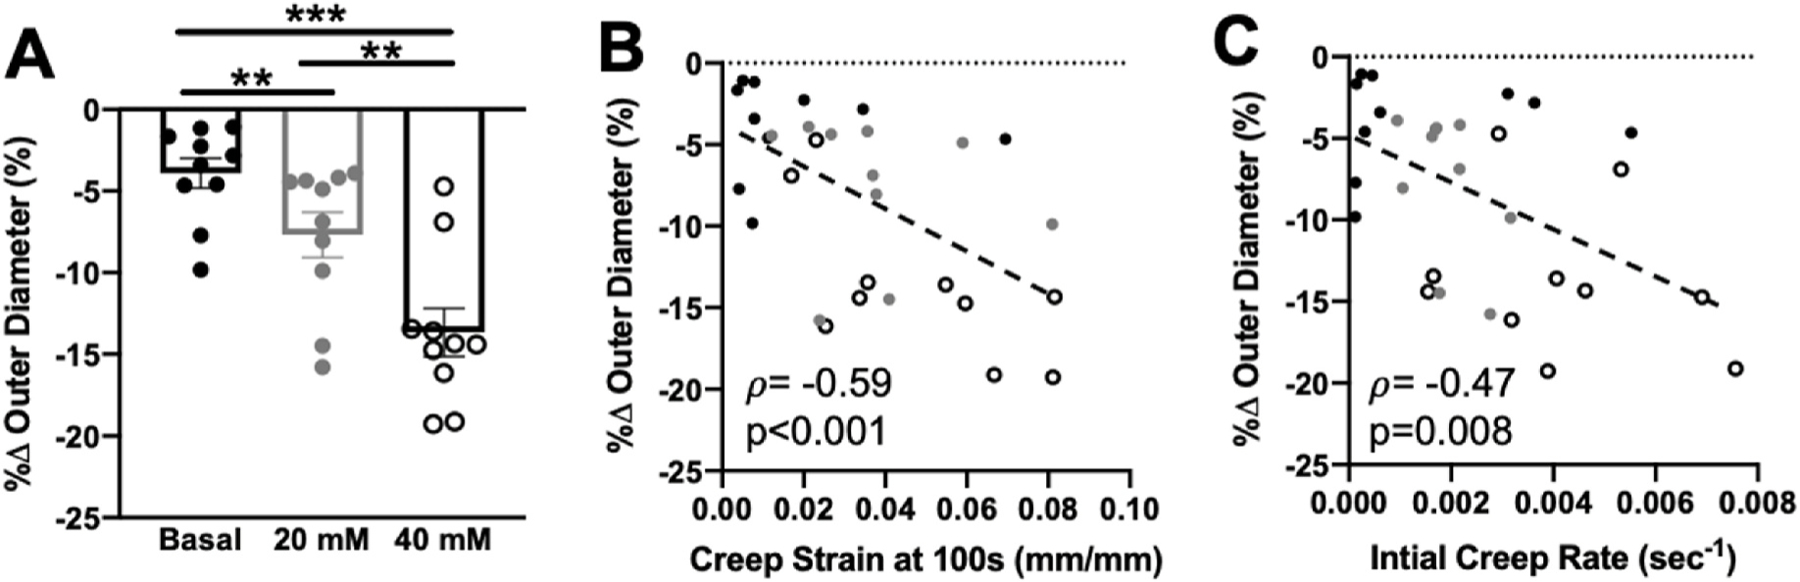
Smooth muscle cells contribute to the mechanical function of various soft tissues, however, their contribution to the viscoelastic response when subjected to multiaxial loading remains unknown. The vagina is a fibromuscular viscoelastic organ that is exposed to prolonged and increased pressures with daily activities and physiologic processes such as vaginal birth. The vagina changes in geometry over time under prolonged pressure, known as creep. Vaginal smooth muscle cells may contribute to creep. This may be critical for the function of vaginal and other soft tissues that experience fluctuations in their biomechanical environment. Therefore, the objective of this study was to develop methods to evaluate the contribution of smooth muscle to vaginal creep under multiaxial loading using extension - inflation tests. The vaginas from wildtype mice (C57BL/6 × 129SvEv; 3-6 months; n = 10) were stimulated with various concentrations of potassium chloride then subjected to the measured in vivo pressure (7 mmHg) for 100 s. In a different cohort of mice (n = 5), the vagina was stimulated with a single concentration of potassium chloride then subjected to 5 and 15 mmHg. A laser micrometer measured vaginal outer diameter in real-time. Immunofluorescence evaluated the expression of alpha-smooth muscle actin and myosin heavy chain in the vaginal muscularis (n = 6). When smooth muscle contraction was activated, vaginal creep behavior increased compared to the relaxed state. However, increased pressure decreased the active creep response. This study demonstrated that extension - inflation protocols can be used to evaluate smooth muscle contribution to the viscoelastic response of tubular soft tissues.

Keywords: Creep; Immunofluorescence; Smooth muscle cells; Vagina; Viscoelastic.


Conflict of interest statement

Declaration of competing interest The authors declare that they have no known competing financial interests or personal relationships that could have appeared to influence the work reported in this paper.

Figures

Fig. 1.
Fig. 1.
A water bath, second bottle, and second pump were added to the Electroforce set-up to permit active testing under 37 °C with carbogen aeration to maintain pH levels. A tube was connected to bottle 2 then through pump 2 to the bottom port on the chamber. Two tubes connected with a “Y” connector allowed fluid to exit the biochamber returning to media to bottle 2 creating a continuous flow loop. Carbogen was bubbled into bottle 2. The blue lines show the flow loop through the biochamber. The black line shows the flow loop through the cannula. Pump 1 flows through the cannula in a feedback loop with the pressure catheter to control pressure applied to the vagina.
Fig. 2.
Fig. 2.
Schematic of active and passive creep experimental methods in response to various KCl concentrations (A). Schematic of pressure-dependent active and passive creep experimental methods (B). At the unloaded length and no pressure, the SMCs were pre-exposed to 40 mM potassium chloride (KCl) for 300 s. The high KCl solution was replaced with fresh media to return to the basal state. Ten cycles of pressurization preconditioned the vagina at the physiologic length followed by a 600-s equilibration period. For the varied KCl protocol, the vagina was randomly stimulated with various concentrations of KCl (4.7, 20, and 40 mM) then subjected to 7 mmHg. For the varied pressure protocol, the vagina was stimulated with 40 mM KCl then randomly subjected to 5 and 15 mmHg. Creep was evaluated for 100 s with a 1000-s recovery period. The randomization is not depicted in this figure. Egtazic acid (EGTA) relaxed the SMCs, then creep testing was repeated in the passive state.
Fig. 3.
Fig. 3.
Representative outer diameter (black) and axial load (grey) response to increasing pressure (A). Representative outer diameter curve over 100 s of creep under a constant 7 mmHg (B). Representative strain (filled; left y-axis) versus time curve for 100 s of creep (C). Peleg’s equation linearly transformed the strain versus time response (open; right y-axis) and a linear regression determined the slope and intercept of the linear line (black line). Outer diameter and creep strain are reported every 6 s for visualization. The linearly transformed curve is reported every 3 s demonstrating data analysis.
Fig. 4.
Fig. 4.
Creep strain versus time curves (A) for the basal response (black filled circle), contracted with 20 (grey filled circle) and 40 (black open circle) mM KCl, and passive (grey open triangle) in wildtype controls (n=10). The creep strain curve shifted upward with smooth muscle contraction compared to the passive state. Linear transformed curve using Peleg’s equation (B). Representative Peleg’s linearized curves and linear regression (dashed line) with the data reported every 3 s as performed for analysis (C). Data are reported as mean ± SEM.
Fig. 5.
Fig. 5.
Percent change in outer diameter (A) for the basal (black filled circle), 20 mM KCl (grey filled circle) and 40 mM KCl (black open circle) contractile response in wildtype control vaginas (n=10). The negative sign denotes a decrease in outer diameter with contraction. Contractility was greater at 40 and 20 mM KCl compared to the basal response. Contractility was greater at 40 mM KCl compared to 20 mM KCl. Percent change in outer diameter versus creep strain at 100 s (B). The percent change in outer diameter significantly negatively correlated with creep strain at 100 s. Percent change in outer diameter versus the initial creep rate (C). The percent change in outer diameter significantly negatively correlated with the initial creep rate. The dashed line represents the best-fit line for the correlation. Data are reported as mean ± SEM. Statistical significance is denoted as **p < 0.01 and ***p < 0.001.
Fig. 6.
Fig. 6.
Creep strain versus time curves (A) at 5 (black filled circle) and 15 (grey filled circle) mmHg when contracted and at 5 (black open circle) and 15 (grey open circle) mmHg when passive in wildtype controls (n=5). The creep strain curve shifted downwards at 15 mmHg with smooth muscle contraction compared to 5 mmHg. The creep strain curve slightly shifted upwards at 15 mmHg without smooth muscle contraction compared to 5 mmHg. Linear transformed curve using Peleg’s equation (B). Representative Peleg’s linearized curves and linear regression (dashed line) with the data reported every 3 s as performed for analysis (C). Data are reported as mean ± SEM.
Fig. 7.
Fig. 7.
Percent change in outer diameter (A) at 5 (black filled circle) and 15 (grey filled circle) mmHg when contracted with 40 mM KCl in wildtype controls (n=5). The negative sign denotes a decrease in outer diameter with contraction. Contractility decreased under 15 mmHg compared to 5 mmHg. The percent change in outer diameter versus creep strain at 100 s (B). The percent change in outer diameter significantly negatively correlated with creep strain at 100 s. Percent change in outer diameter versus the initial creep rate (C). The percent change in outer diameter significantly negatively correlated with the initial creep rate. The dashed line represents the best-fit line for the correlation. Data are reported as mean ± SEM. Statistical significance is denoted as *p < 0.05.
Fig. 8.
Fig. 8.
Representative DAPI (blue; A) image staining for the cellular nuclei, alpha-smooth muscle actin staining (α SMA, red; B), and myosin heavy chain (MHC, green; C). Merged immunofluorescent image (yellowish orange) of the murine vaginal wall (D). The layers of the vaginal wall are denoted as: epithelium (e), subepithelium (s), muscularis (m), and adventitia (a). The white dashed line separates the layers. The arrows identify the blood vessels. The scale is 100 μm.
Fig. 9.
Fig. 9.
Number of cells normalized to the muscularis cross-sectional area versus percent change in outer diameter with contractility (A). Number of cells normalized to the muscularis cross-sectional area versus creep strain at 100 s (B). Number of cells normalized to the muscularis cross-sectional area versus initial creep rate (C). The dashed line represents the best-fit line for the correlation.

References

    1. Akintunde A, Robison KM, Capone D, Desrosiers L, Knoepp LR, Miller KS, 2019. Effects of elastase digestion on the murine vaginal wall biaxial mechanical response. J. Biomech. Eng 141 (2). - PMC - PubMed
    1. Amin M, Le VP, Wagenseil JE, 2012. Mechanical testing of mouse carotid arteries: from newborn to Adult. Jove-Journal of Visualized Experiments (60), 9. - PMC - PubMed
    1. Asundi KR, Rempel DM, 2008. MMP-1, IL-1 beta, and COX-2 mRNA expression is modulated by static load in rabbit flexor tendons. Ann. Biomed. Eng 36 (2), 237–243. - PubMed
    1. Beamish JA, He P, Kottke-Marchant K, Marchant RE, 2010. Molecular regulation of contractile smooth muscle cell phenotype: implications for vascular tissue engineering. Tissue Eng. B Rev 16 (5), 467–491. - PMC - PubMed
    1. Boreham MK, Wai CY, Miller RT, Schaffer JI, Word RA, 2002. Morphometric analysis of smooth muscle in the anterior vaginal wall of women with pelvic organ prolapse. Am. J. Obstet. Gynecol 187 (1), 56–63. - PubMed

Publication types

Substances

LinkOut - more resources