. 2023 Mar 2;30(3):300-311.e11.
doi: 10.1016/j.stem.2023.01.007. Epub 2023 Feb 9.

Epitranscriptomic regulation of cortical neurogenesis via Mettl8-dependent mitochondrial tRNA m3C modification

Affiliations

Epitranscriptomic regulation of cortical neurogenesis via Mettl8-dependent mitochondrial tRNA m3C modification

Feng Zhang et al. Cell Stem Cell. .

Abstract

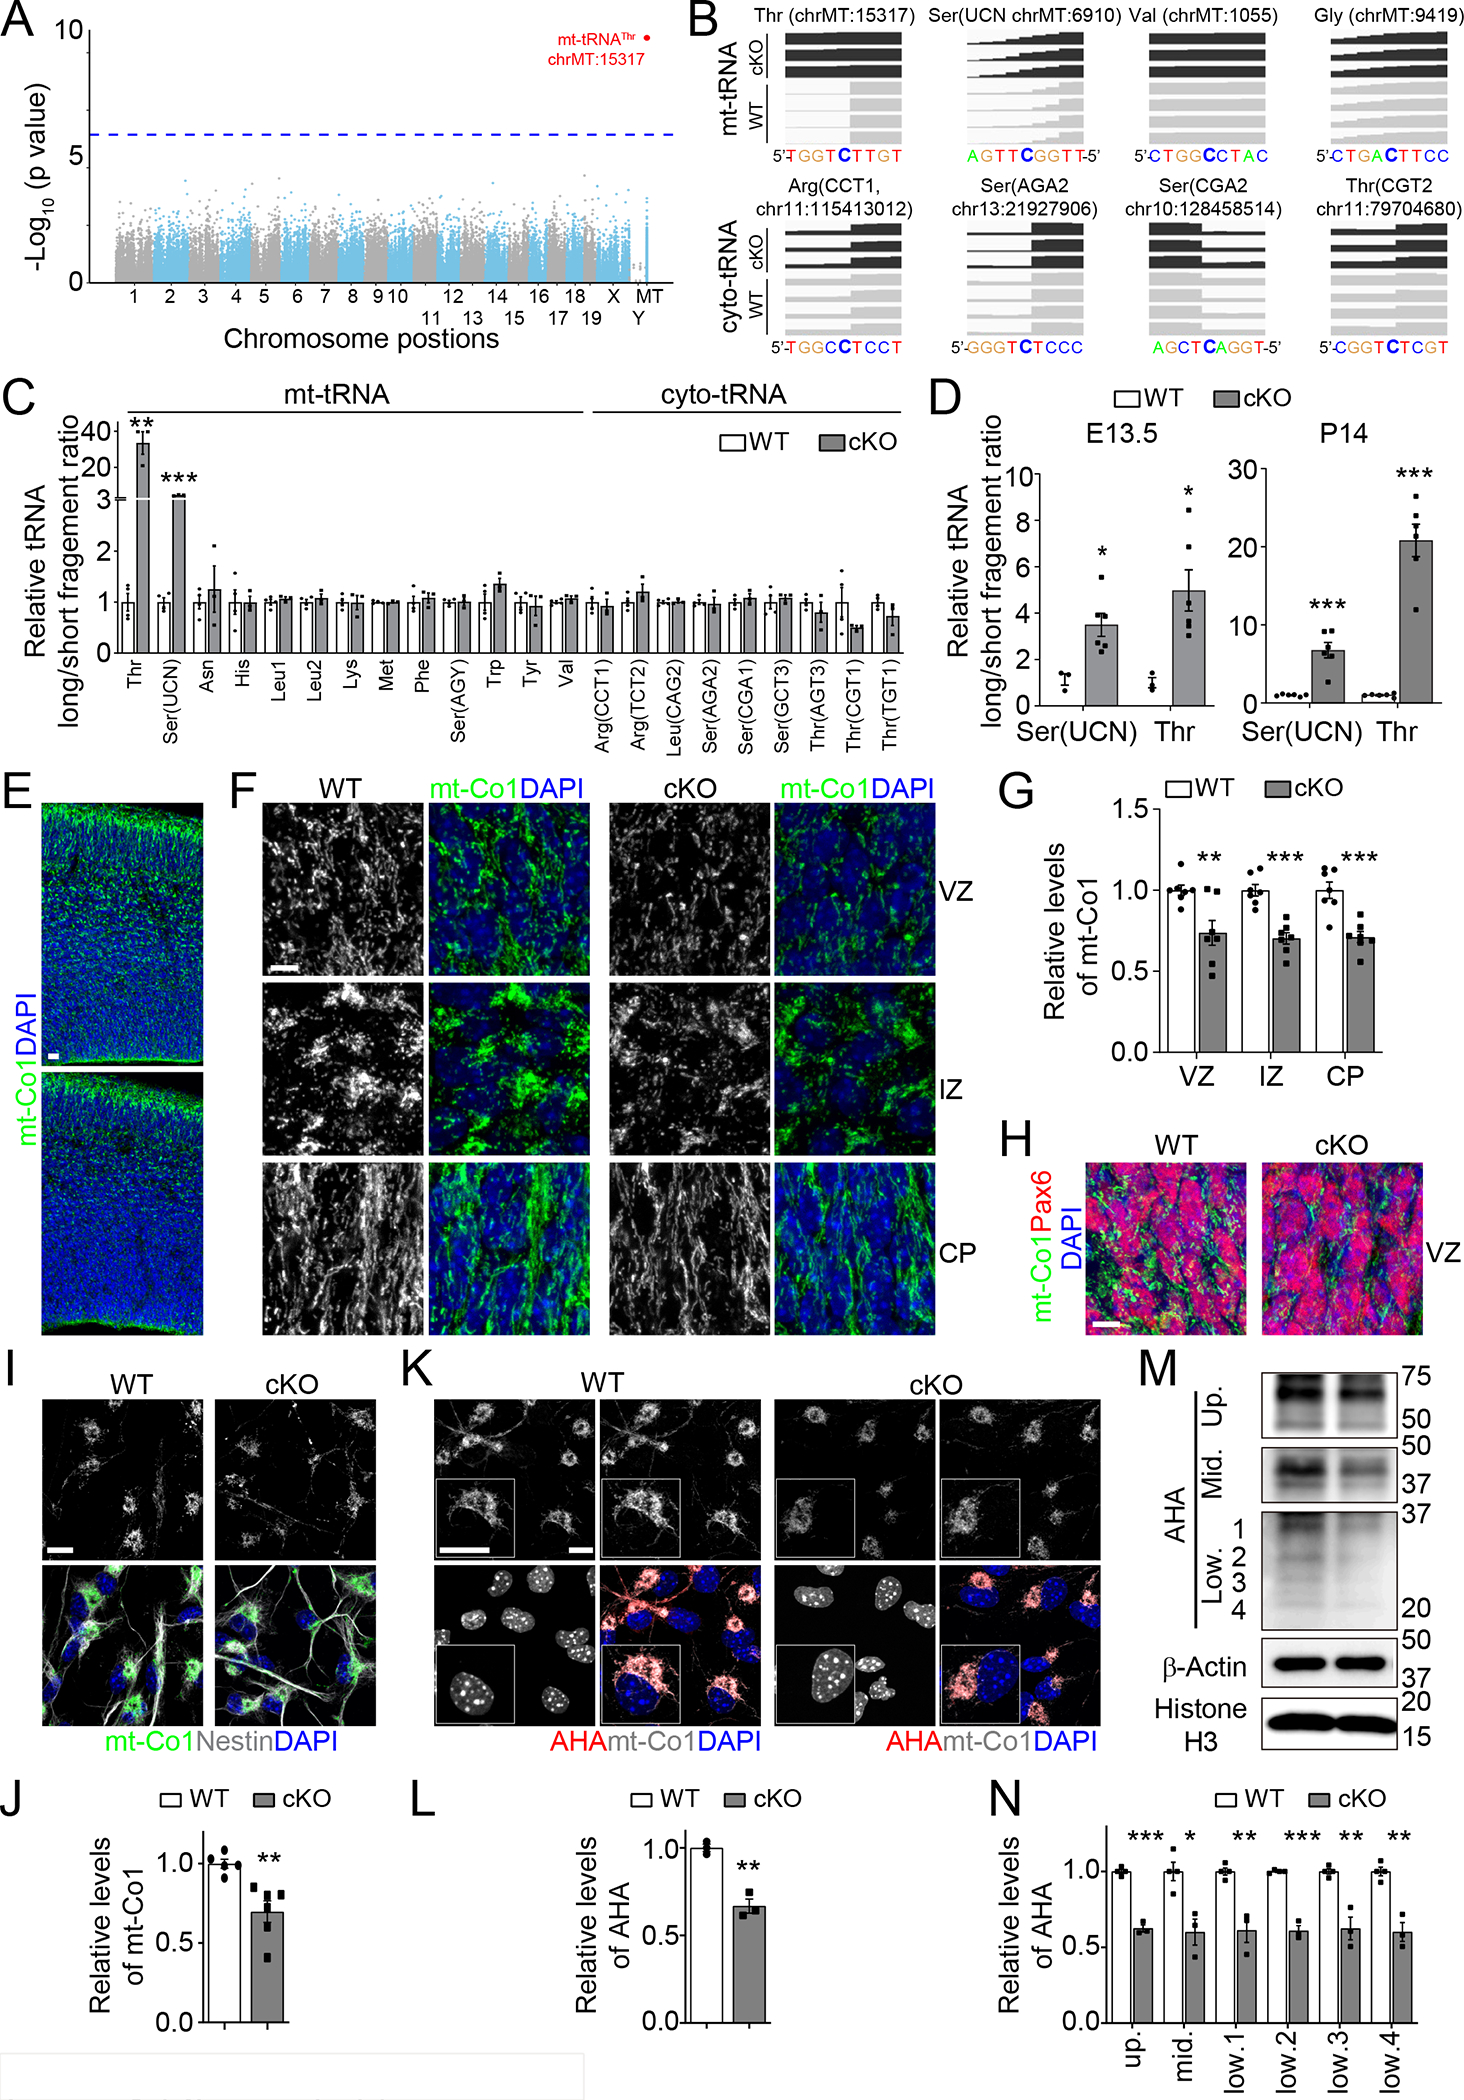
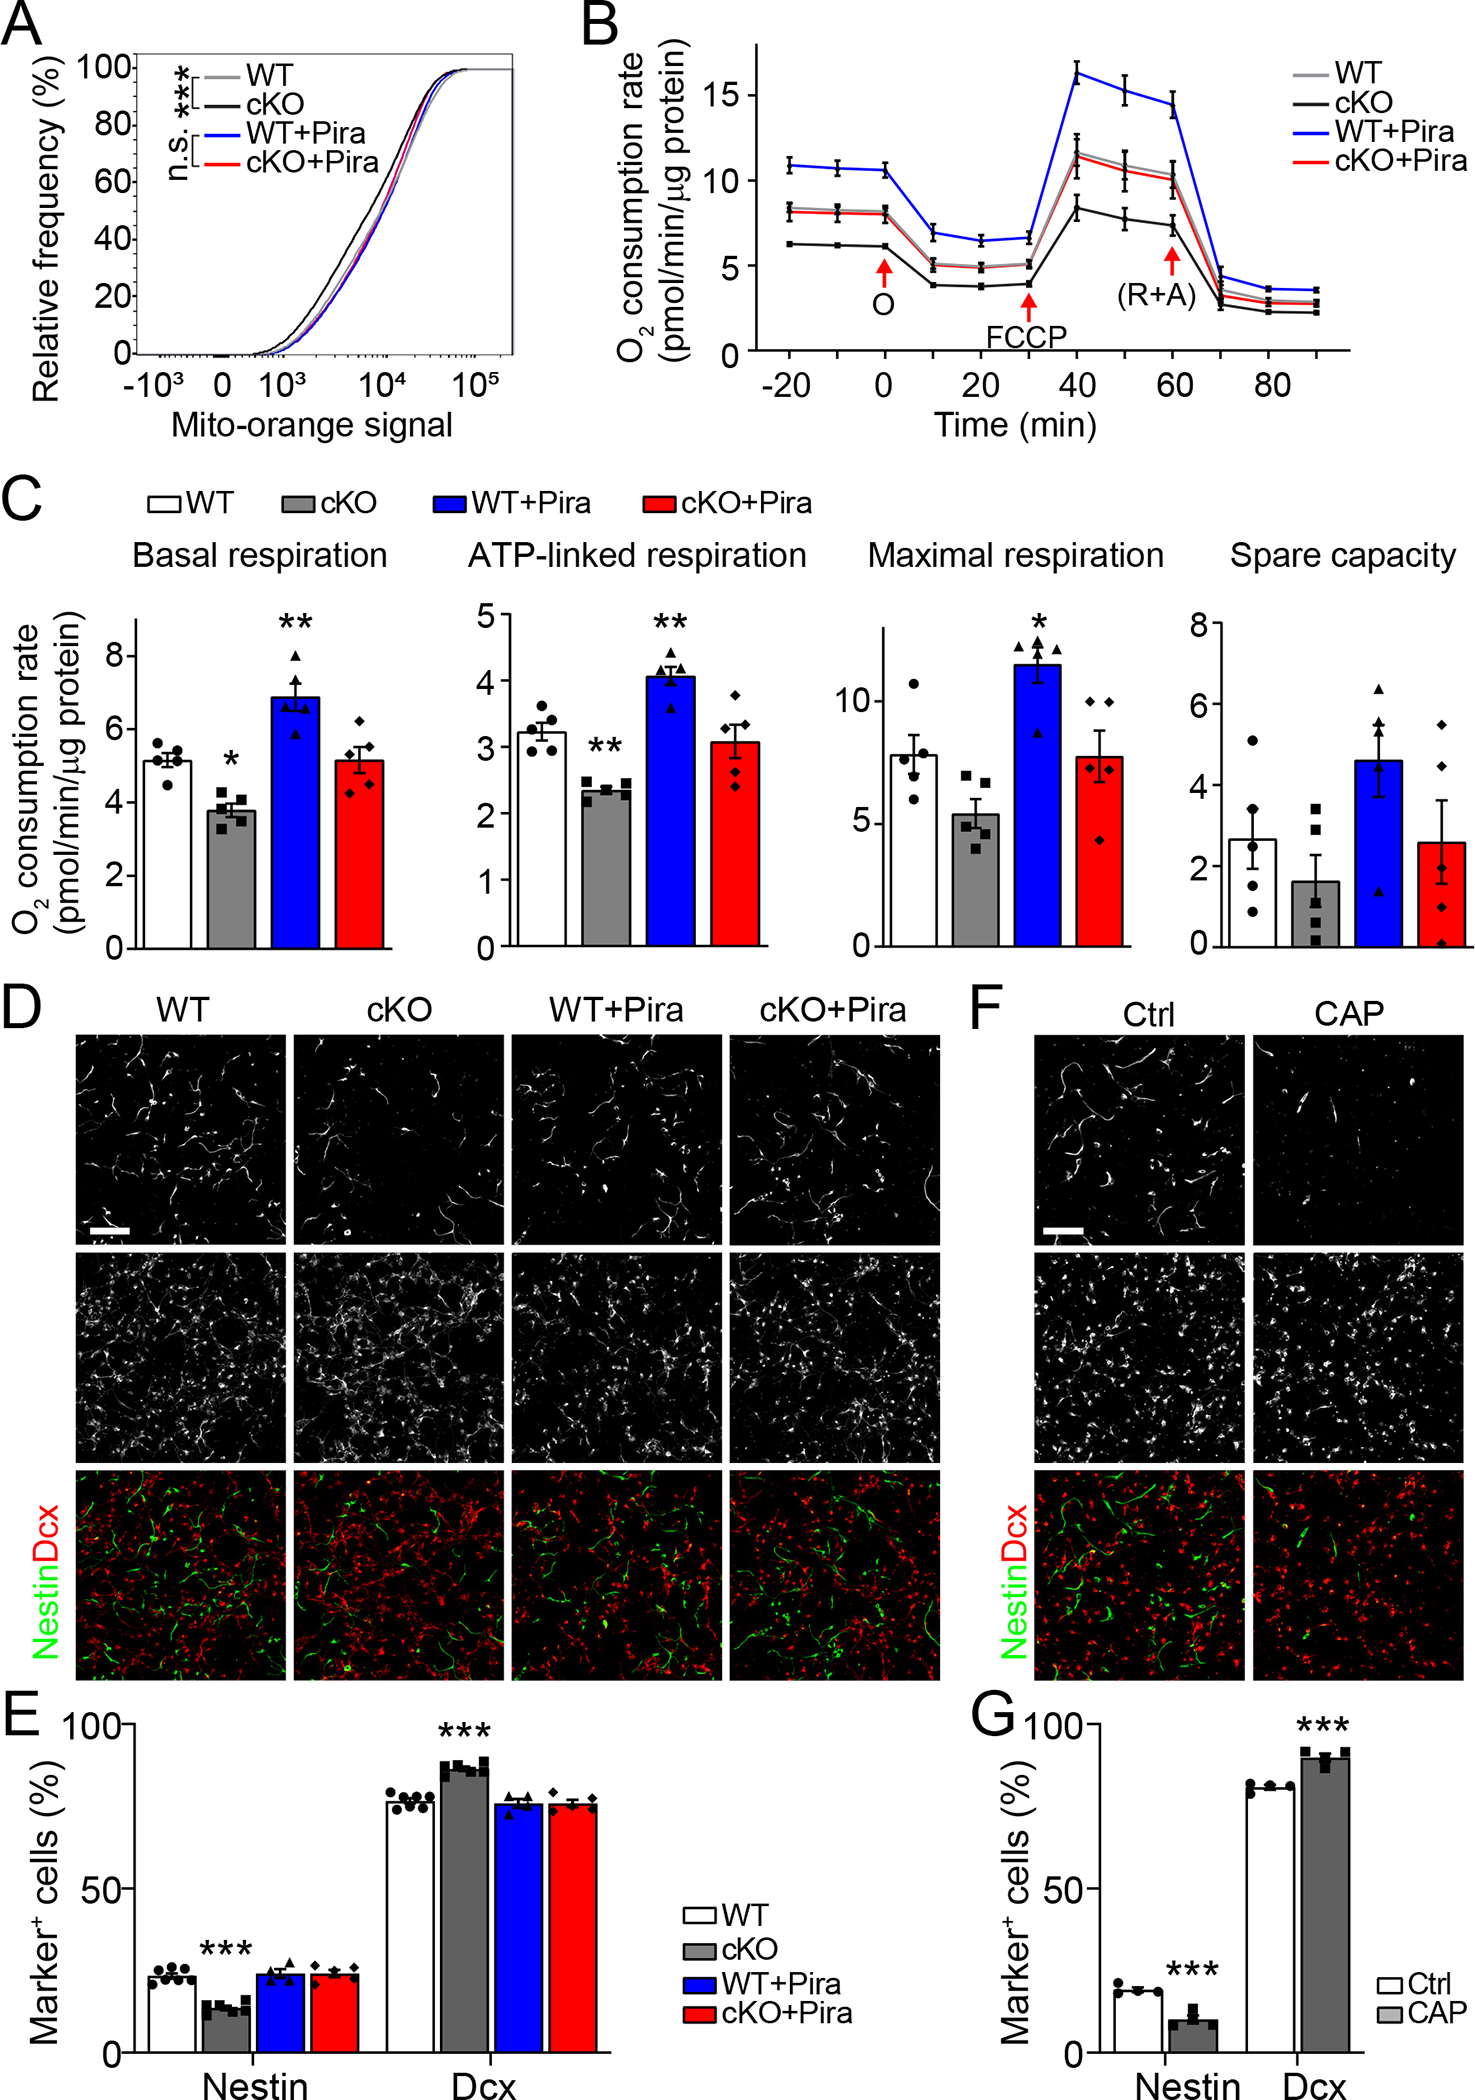
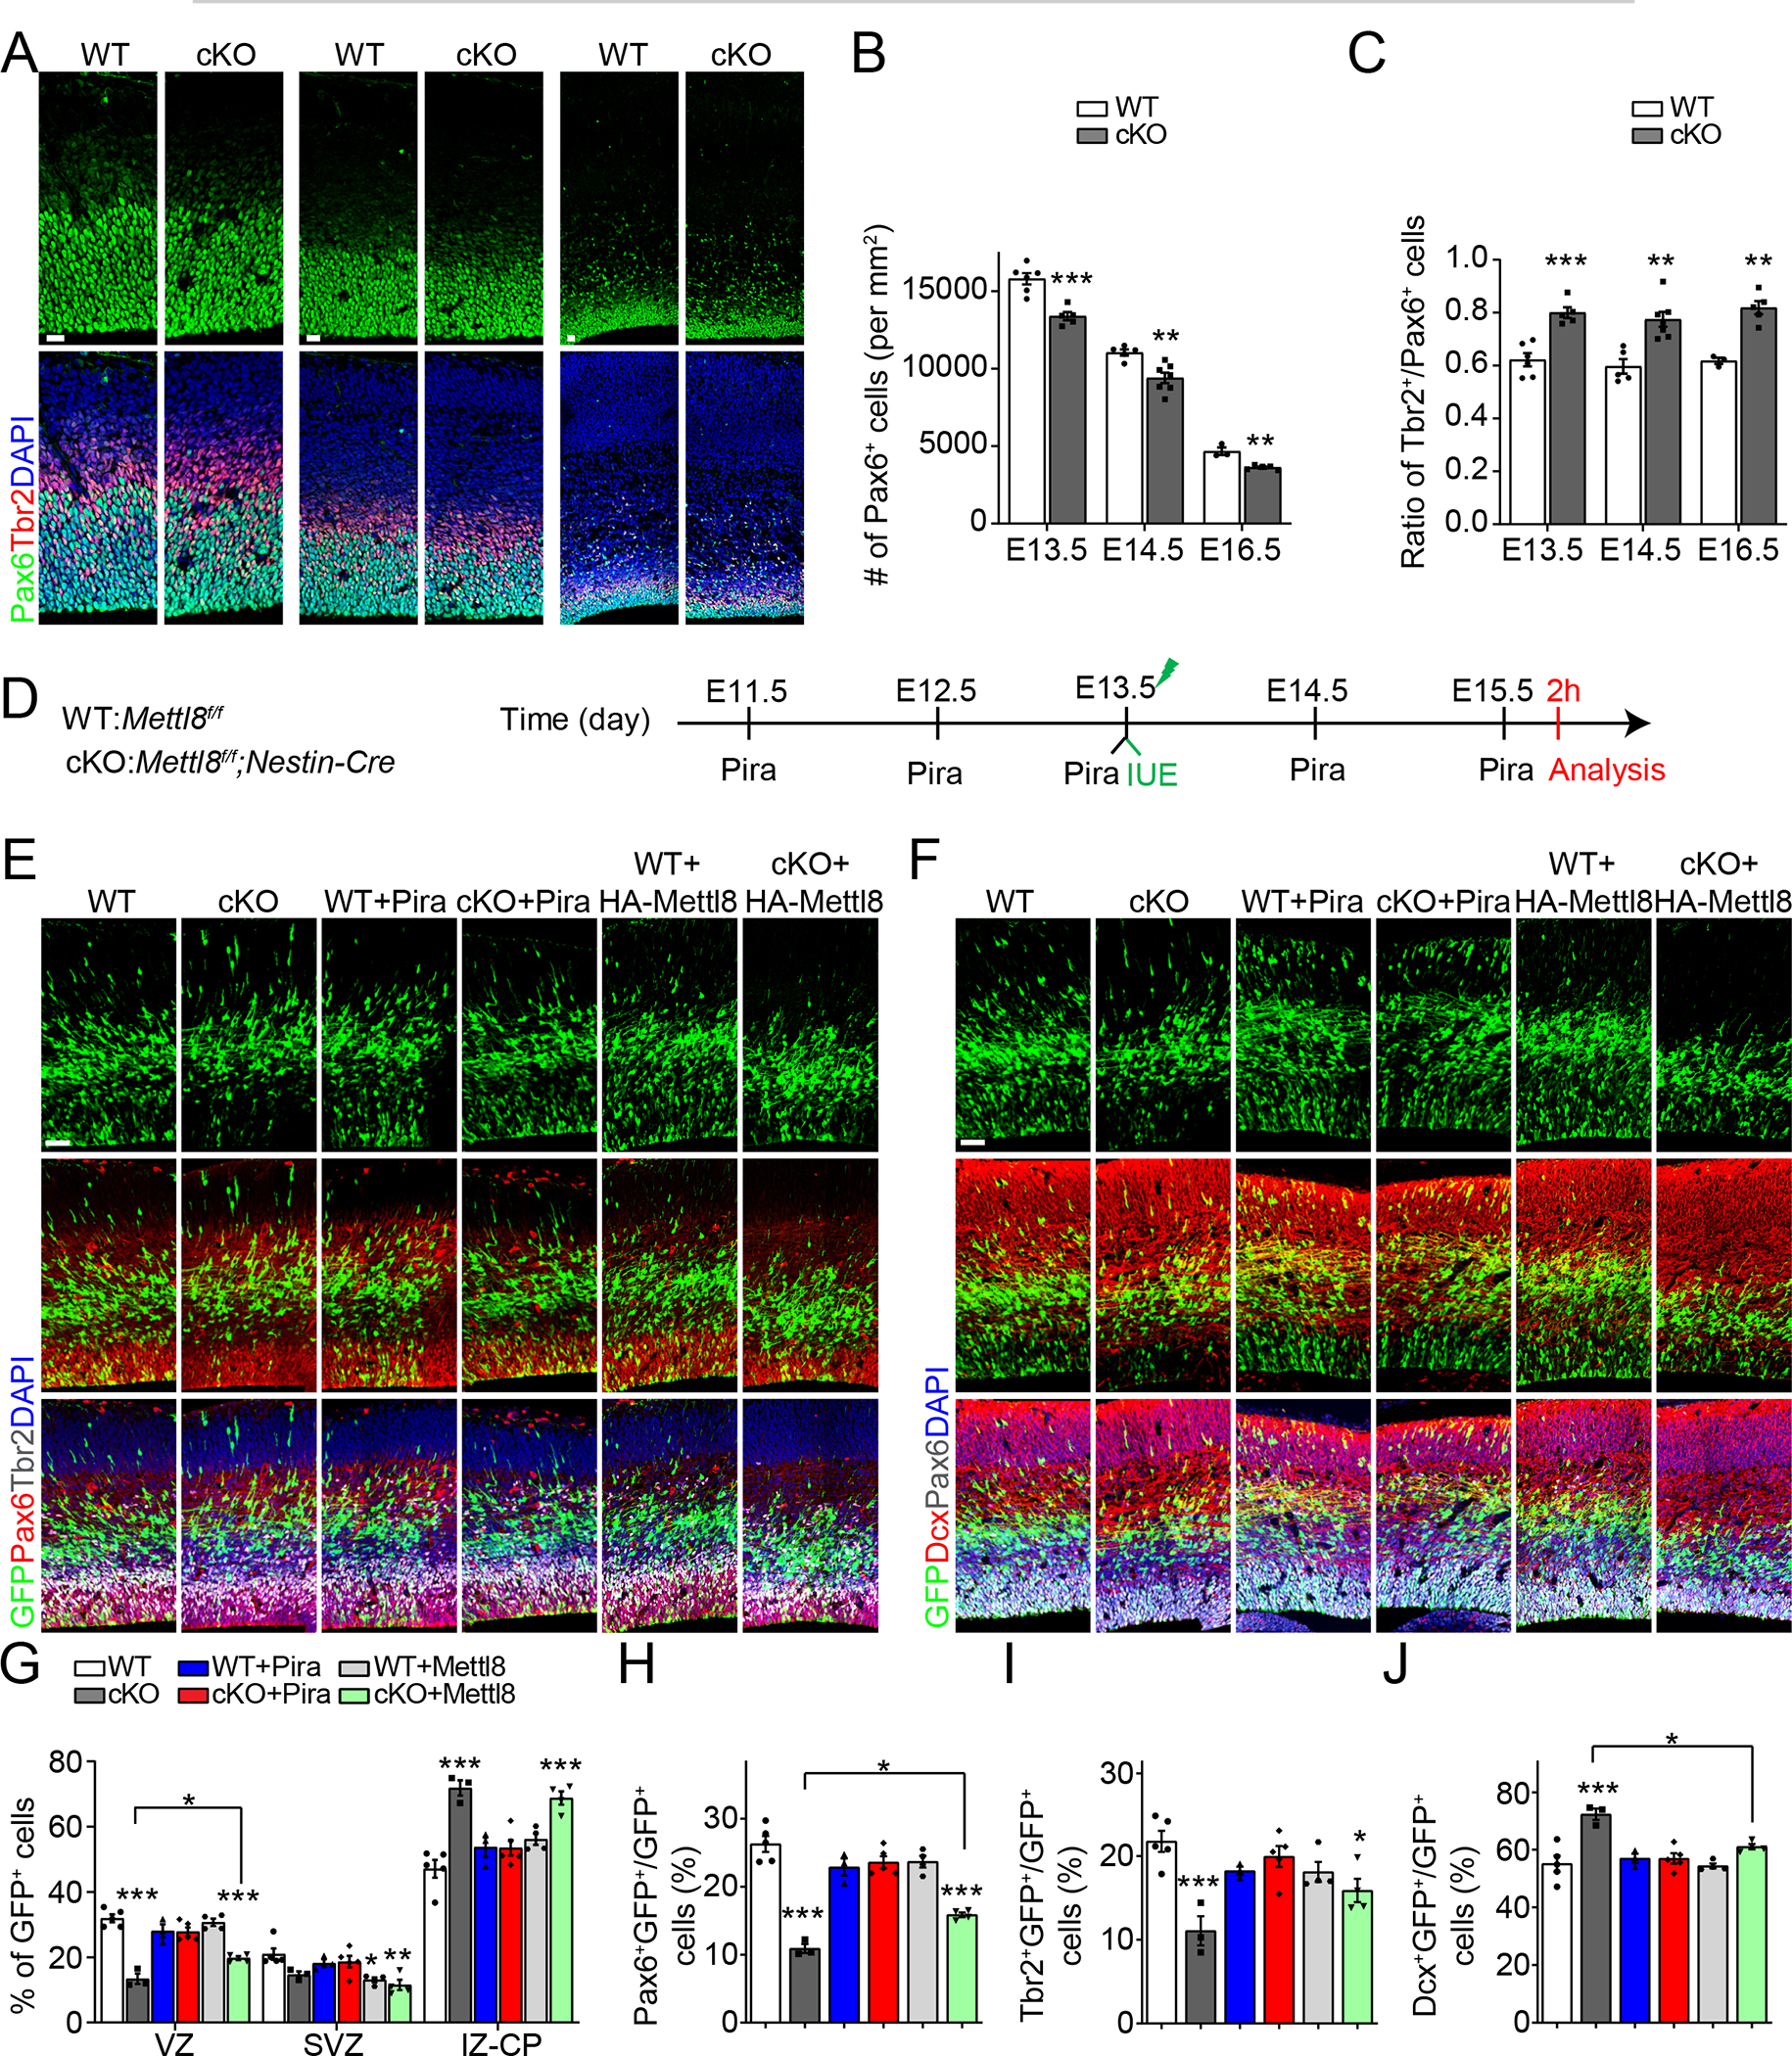
Increasing evidence implicates the critical roles of various epitranscriptomic RNA modifications in different biological processes. Methyltransferase METTL8 installs 3-methylcytosine (m3C) modification of mitochondrial tRNAs in vitro; however, its role in intact biological systems is unknown. Here, we show that Mettl8 is localized in mitochondria and installs m3C specifically on mitochondrial tRNAThr/Ser(UCN) in mouse embryonic cortical neural stem cells. At molecular and cellular levels, Mettl8 deletion in cortical neural stem cells leads to reduced mitochondrial protein translation and attenuated respiration activity. At the functional level, conditional Mettl8 deletion in mice results in impaired embryonic cortical neural stem cell maintenance in vivo, which can be rescued by pharmacologically enhancing mitochondrial functions. Similarly, METTL8 promotes mitochondrial protein expression and neural stem cell maintenance in human forebrain cortical organoids. Together, our study reveals a conserved epitranscriptomic mechanism of Mettl8 and mitochondrial tRNA m3C modification in maintaining embryonic cortical neural stem cells in mice and humans.

Keywords: Mettl8; epitranscriptomics; human forebrain organoids; m(3)C modification; mitochondria activity; mitochondrial tRNA; neural stem cells; neurogenesis.


Conflict of interest statement

Declaration of interests G.-l.M. is on the advisory board of Cell Stem Cell.

Figures

Figure 1.
Figure 1.. Mettl8 installs m3C modification of mt-tRNAThr/Ser(UCN) and regulates mitochondria protein translation in mouse NPCs
(A-B) HAC-seq analysis of NPCs derived from E17.5 WT and cKO cortex. Shown are a Manhattan plot of −Log10(P) of the differential cleavage ratio of analyzed Cytosine sites (n = 3 cKO and 4 WT) at their chromosomal positions with the blue dotted lines indicating the genome-wide significance threshold with the Bonferroni correction (p = 0.05/135582 = 3.69×10⁻⁷) (A) and alignment track of potential m3C modification sites of several mt-tRNAs and cyto-tRNAs. (C) qPCR measurement of the long/short ratio of 13 mt-tRNAs with Cytosine at the 32 position and 9 cyto-tRNAs previously reported to contain m3C modifications. Data were normalized to the value of WT NPCs. Values represent mean ± SEM (n = 4/WT; 3/cKO; **P < 0.01, ***P < 0.001; Student’s t-test). (D) Mettl8-dependent m3C modification of mt-tRNAThr/Ser(UCN) measured by qPCR. Similar as in (C). Values represent mean ± SEM (E13.5 cortex: n = 3/WT, 6/cKO; P14 cortex: n = 6/WT, 6/cKO; *P < 0.05, ***P < 0.001; Student’s t-test). (E-H) Sample confocal images of mt-Co1 immunostaining and DAPI of the E14.5 mouse cortex (E) and enlarged views for VZ, IZ and CP regions (F), and co-immunostaining of mt-Co1 and Pax6 (H). Scale bars, 20 μm (E) and 5 μm (F, H), and quantifications of the relative intensity of mt-Co1 signal of cKO compared to WT cortex (G). Values represent mean ± SEM (n = 7/WT, 7/cKO; **P < 0.01, ***P < 0.001; Student’s t-test). (I-J) Sample immunostaining confocal images (I; Scale bar: 10 μm) and quantification of the relative intensity of mt-Co1 signal of cKO compared to WT NPCs (J). Values represent mean ± SEM (n = 5/WT, 6/cKO; **P < 0.01; Student’s t-test). (K-N) Mettl8 deletion attenuates mitochondria protein translation in NPCs. WT and cKO NPCs were first cultured without Methionine for 1.5 hours, and then treated with cycloheximide (50 μg/mL) for 0.5 hour, followed by Methionine-depleted media containing cycloheximide and AHA (300 μM for K-L and 500 μM for M-N) for 3 hours. Shown are sample confocal images (K; Scale bar, 10 μm) and quantification of the relative intensity of AHA signal in cKO compared to WT NPCs (L). Values represent mean ± SEM (n = 3/WT, 3/cKO; **P < 0.01; Student’s t-test). Also shown are sample Western blot images (M) and quantification of the intensity of different AHA bands (1–4 bands indicating different mitochondria proteins) normalized first with that of β-Actin and then compared with WT samples (N). Values represent mean ± SEM (n = 4/WT, 3/cKO; *P < 0.05, **P < 0.01, ***P < 0.001; Student’s t-test). See also Figures S1, S2 and Tables S1, S2, S3
Figure 2.
Figure 2.. Mettl8 deletion attenuates mitochondria respiration activity and NPC maintenance
(A) Accumulative distributions of Mito-Orange signal levels. WT and cKO NPCs cultured with or without piracetam (Pira; 1 mM), were stained with 50 nM MMP-indicator Mito-Orange before flow cytometry analysis. The percent frequency distribution across every 400 bins of Mito-Orange signal intensity was used for quantification (number of cells analyzed: n = 48,546/WT, 49,548/KO, 50,688/WT+Pira, 53,196/KO+Pira; n.s.: P > 0.05, ***P < 0.001; Kolmogorov–Smirnov test). (B-C) Summary of Seahorse analysis measuring O2 consumption of WT and cKO NPCs with or without piracetam (Pira) treatment (B) and quantification of levels of the basal respiration, ATP-linked respiration, maximal respiration and spare activity (C). Values represent mean ± SEM (n =5/WT, 5/cKO, 5/WT+Pira, 5/cKO+Pira; *P < 0.05; **P < 0.01; One-way ANOVA). O: oligomycin; (R + A): Rotenone + Antimycin A. (D-E) Sample confocal images of immunostaining for Nestin and Dcx in WT and cKO primary NPCs cultured with or without piracetam (1 mM) for 48 hours (D; Scale bar: 100 μm) and quantification (E). Values represent mean ± SEM (n = 7/WT, 6/cKO, 4/WT+Pira, 5/cKO+Pira; ***P < 0.001; One-way ANOVA). (F-G) Pharmacological inhibition of mitochondrial protein translation with CAP (10 μg/mL) for 48 hours leads to similar deficits in primary NPCs as Mettl8 deletion. Similar as in (D-E). Values represent mean ± SEM (n = 4/Ctrl, 4/CAP; ***P < 0.001; One-way ANOVA). See also Figure S2
Figure 3.
Figure 3.. Mettl8 deletion leads to deficits in neural stem cell maintenance in vivo
(A-C) Sample immunostaining confocal images (A; Scale bars: 20 μm) and quantification of the density of Pax6+ neural stem cells (B) and the ratio of Tbr2+ cells over Pax6+ cells (C) in WT and cKO cortex. Values represent mean ± SEM (E13.5: n = 6/WT, 5/cKO; E14.5: n = 5/WT, 7/cKO; E16.5: n = 3/WT, 5/cKO; *P < 0.05, **P < 0.01, ***P < 0.001; Student’s t-test). (D-J) Mettl8 cKO mice exhibit deficits in neural stem cell maintenance with increased neuronal differentiation, which were rescued by piracetam treatment (500 mg/kg body weight). Shown are schematic diagram of experimental design (D), sample immunostaining confocal images (E, F; Scale bars: 50 μm) and quantifications for percentages of GFP+ cells distributed across different layers of the cortex (G) and percentages of different cell types among all GFP+ cells (H-J) in WT and cKO mice. Values represent mean ± SEM (n = 5/WT, 3/cKO, 3/WT+Pira, 5/cKO+Pira, 4/WT+Mettl8, 4/cKO+Mettl8; *P < 0.05, ***P < 0.001; One-way ANOVA). See also Figure S3
Figure 4.
Figure 4.. METTL8 deletion reduces mitochondria protein expression and impairs radial glia neuronal stem cell maintenance in human forebrain organoids
(A-B) Reduced m3C modification on mt-tRNAThr/Ser(UCN) in day 33 (D33) METTL8 KO organoids. Similar as in Figures 1C–D. Individual dots represent data from organoids derived from each iPSC line. Values represent mean ± SEM (n = 4/WT, 3/KO iPSC lines; *P < 0.05; ***P < 0.001; Student’s t-test). (C-D) Sample immunostaining confocal images (C; Scale bar: 10 μm) and quantification of the relative intensity of mt-CO1 signal after normalization with the number of SOX2+ neural stem cells at the VZ regions of WT and KO D33 organoids (D). Individual dots represent data from each rosette of organoids derived from either WT or KO iPSC lines. Values represent mean ± SEM (n = 48 rosettes from 4 WT iPSC lines, 61 rosettes from 3 KO iPSC lines; ***P < 0.001; Student’s t-test). (E-G) Sample immunostaining confocal images (E; Scale bars: 50 μm) for human organoids from each WT and KO iPSC line with or without treatment of piracetam (1 mM; from D34 to D56), injected with GFP-expressing retrovirus at D42 and analyzed 14 days later and quantification of percentages of SOX2+GFP+ neural stem cells (F) and CTIP2+GFP+ neurons (G) among all GFP+ cells in WT and KO organoids at D56. Values represent mean ± SEM (n = 68 sections from 4 WT iPSC lines, 64 sections from 3 KO iPSC lines, 76 sections from 4 WT iPSC lines with Pira treatment, 56 sections from 3 KO iPSC lines with Pira treatment; ***P < 0.001; One-way ANOVA). See also Figure S4

References

    1. Helm M, and Motorin Y (2017). Detecting RNA modifications in the epitranscriptome: predict and validate. Nat Rev Genet 18, 275–291. 10.1038/nrg.2016.169. - DOI - PubMed
    1. Zhao BS, Roundtree IA, and He C (2017). Post-transcriptional gene regulation by mRNA modifications. Nature reviews. Molecular cell biology 18, 31–42. 10.1038/nrm.2016.132. - DOI - PMC - PubMed
    1. Morais P, Adachi H, and Yu YT (2021). The Critical Contribution of Pseudouridine to mRNA COVID-19 Vaccines. Frontiers in cell and developmental biology 9, 789427. 10.3389/fcell.2021.789427. - DOI - PMC - PubMed
    1. Wiener D, and Schwartz S (2021). The epitranscriptome beyond m(6)A. Nat Rev Genet 22, 119–131. 10.1038/s41576-020-00295-8. - DOI - PubMed
    1. Vissers C, Sinha A, Ming GL, and Song H (2020). The epitranscriptome in stem cell biology and neural development. Neurobiology of disease 146, 105139. 10.1016/j.nbd.2020.105139. - DOI - PMC - PubMed

Publication types