. 2023 Apr 19;111(8):1191-1204.e5.
doi: 10.1016/j.neuron.2023.01.010. Epub 2023 Feb 9.

Large-scale differentiation of iPSC-derived motor neurons from ALS and control subjects

Affiliations

Large-scale differentiation of iPSC-derived motor neurons from ALS and control subjects

Michael J Workman et al. Neuron. .

Erratum in

  • Large-scale differentiation of iPSC-derived motor neurons from ALS and control subjects.
    Workman MJ, Lim RG, Wu J, Frank A, Ornelas L, Panther L, Galvez E, Perez D, Meepe I, Lei S, Valencia V, Gomez E, Liu C, Moran R, Pinedo L, Tsitkov S, Ho R, Kaye JA; Answer ALS Consortium; Thompson T, Rothstein JD, Finkbeiner S, Fraenkel E, Sareen D, Thompson LM, Svendsen CN. Workman MJ, et al. Neuron. 2025 Jun 18;113(12):2028. doi: 10.1016/j.neuron.2025.05.022. Epub 2025 May 28. Neuron. 2025. PMID: 40441139 No abstract available.

Abstract

Using induced pluripotent stem cells (iPSCs) to understand the mechanisms of neurological disease holds great promise; however, there is a lack of well-curated lines from a large array of participants. Answer ALS has generated over 1,000 iPSC lines from control and amyotrophic lateral sclerosis (ALS) patients along with clinical and whole-genome sequencing data. The current report summarizes cell marker and gene expression in motor neuron cultures derived from 92 healthy control and 341 ALS participants using a 32-day differentiation protocol. This is the largest set of iPSCs to be differentiated into motor neurons, and characterization suggests that cell composition and sex are significant sources of variability that need to be carefully controlled for in future studies. These data are reported as a resource for the scientific community that will utilize Answer ALS data for disease modeling using a wider array of omics being made available for these samples.

Keywords: ALS; iPSC; motor neurons; sex differences.


Conflict of interest statement

Declaration of interests US patent 10,221,395-B2 has been granted describing a method for reprogramming blood to induced pluripotent stem cells. Apart from this issued patent filing, the authors declare that the research was conducted in the absence of any commercial or financial relationships that could be construed as a potential conflict of interest.

Figures

Figure 1.
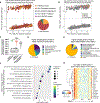
Figure 1.. Differentiation and characterization of human iPSC-derived motor neurons
(A) Schematic overview of sample collection, reprogramming, and differentiation of motor neurons from 433 human subjects. (B) Summary of self-reported genetic mutations in ALS patient cohort. (C) Breakdown of bulk RNA-seq samples used for analysis. Batch technical controls (BTCs) and batch differentiation controls (BDCs) were used to assess technical noise and variation in the differentiation protocol. (D) Representative immunofluorescent images of day 32 iPSC-derived spinal motor neuron cultures from control and ALS patients. Scale bar, 200 μm. (E) Quantification of percent ISL1+ cells of total DAPI-stained cells (**p < 0.01, unpaired two-tailed t test. Box represents interquartile range (IQR), line indicates median, and whiskers denote +/− 1.5*IQR). See also Figure S1.
Figure 2.
Figure 2.. Somatic cell used for iPSC reprogramming detectable in day 32 motor neurons
(A) Breakdown of known somatic cells used for iPSC reprogramming. (B) Volcano plot of differentially expressed genes in day 32 motor neurons differentiated from non-T cell-derived iPSCs versus day 32 motor neurons differentiated from T cell-derived iPSCs (*p < 0.05, DESeq2 Wald test with Bonferonni correction). (C) Normalized expression of the top differentially expressed genes (Box represents interquartile range (IQR), line indicates median, and whiskers denote +/− 1.5*IQR). (D) PCA of day 32 motor neurons using the 4 genes shown in Figure 2C and colored by the type of somatic cell from which the iPSCs were derived. (E) Classification of sample origin using a receiver operating characteristic (ROC) curve based on the PC1 coordinates in Figure 2D (AUC = 0.98, p = 1.21e54, Mann-Whitney U test). (F) Several day 32 motor neuron samples displayed aberrant expression of the pluripotency factor OCT4/POU5F1 at more than 100 times the interquartile range of the dataset (red dashed line). (G) The majority of OCT4 outliers were from samples originally derived from T cells. (H) High OCT4-expressing samples are mainly clustered as outliers in global principal component analysis.
Figure 3.
Figure 3.. Analysis of batch control samples identifies HVGs associated with technical noise and protocol variation
(A) Clustering of samples by principal component analysis (PCA) with data normalization and removal of BTC, BDC, and outlier samples. (B) Projection of BTC and BDC samples along PC1 and PC2 in the global clustering of samples shown in Figure 3A. (C) Spearman correlation between samples (****p < 0.0001, one-way ANOVA with Tukey’s HSD post hoc test). (D) Grouping of HVGs identified in BTCs. (E) In addition to small RNA molecules, HVGs in BDC samples include genes associated with the extracellular matrix, signaling, neurotransmitter receptor expression, and various other genes. (F) Gene ontology (GO) enrichment of HVGs in BDC samples. (G) Heatmap of top 20 HVGs in BDC samples ordered by batch. See also Figure S2.
Figure 4.
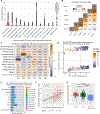
Figure 4.. Correlating RNA-seq data with covariates reveals S100B and sex as leading descriptors of variance in the transcriptomic data
(A) Results of a linear mixed model used to estimate the proportion of variation in each gene attributable to technical and biological variables included in the metadata. (B) Pearson correlation analysis of the staining data. (C) Correlation of principal components to sample covariates (*p < 0.05, **p < 0.01, ***p < 0.001, two-tailed t test with Bonferroni correction). (D) Coloring samples in PCA by the percentage of cells expressing S100B. (E) Top 10 genes in which percent ISL1+ cells explain the most amount of gene variation. (F) Correlation of ISL1 gene expression to ISL1 staining data. (G) C9orf72 gene expression in healthy control, C9orf72 hexanucleotide repeat expansion carriers, and all other ALS subjects (****p < 0.0001, one-way ANOVA with Tukey’s HSD post hoc test. Box represents interquartile range (IQR), line indicates median, and whiskers denote +/− 1.5*IQR). See also Figure S3.
Figure 5.
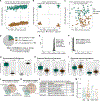
Figure 5.. In vitro and in vivo sex differences in neuronal cultures and tissues
(A) PCA using the top 500 most variable genes separates male and female day 32 motor neuron samples along PC2. (B and C) Male-female differences in human post-mortem (B) brain and (C) spinal cord. (D) Differential gene expression analysis reveals 1,016 genes differentially expressed between male and female samples (p < 0.05, DESeq2 Wald test with Bonferroni correction). (E) Histogram showing the proportion of correctly labeled samples following random shuffling of sex labels in 467 permutations. (F) Histogram of the number of DEGs from 467 reshuffles of the sex class label. (G) X- and Y-linked genes show striking male-female differences in expression. (Box represents interquartile range (IQR), line indicates median, and whiskers denote +/− 1.5*IQR.) (H and I) Many autosomal genes show enrichment specifically in (H) female or in (I) male samples (DESeq2 Wald test with Bonferonni correction). (J and K) Analysis of differentially expressed genes (DEGs) between ALS and control reveals subsets of genes that are (J) downregulated or (K) upregulated specifically in male ALS versus male control. (L) Pathway enrichment of the upregulated DEGs in male ALS samples uncovers pathways related to TNF and NF-κB signaling (Fisher’s exact test with Benjamini-Hochberg false discovery rate [FDR] correction, FDR < 0.1). (M) UNC13A cryptic exon expression shown as percent spliced in (PSI, ψ) in day 32 motor neuron cultures. See also Figures S4 and S5.

References

    1. Giacomelli E, Vahsen BF, Calder EL, Xu Y, Scaber J, Gray E, Dafinca R, Talbot K, and Studer L (2022). Human stem cell models of neurodegeneration: from basic science of amyotrophic lateral sclerosis to clinical translation. Cell Stem Cell 29, 11–35. 10.1016/j.stem.2021.12.008. - DOI - PMC - PubMed
    1. Shi Y, Lin S, Staats KA, Li Y, Chang WH, Hung ST, Hendricks E, Linares GR, Wang Y, Son EY, et al. (2018). Haploinsufficiency leads to neurodegeneration in C9ORF72 ALS/FTD human induced motor neurons. Nat. Med. 24, 313–325. 10.1038/nm.4490. - DOI - PMC - PubMed
    1. Fujimori K, Ishikawa M, Otomo A, Atsuta N, Nakamura R, Akiyama T, Hadano S, Aoki M, Saya H, Sobue G, and Okano H (2018). Modeling sporadic ALS in iPSC-derived motor neurons identifies a potential therapeutic agent. Nat. Med. 24, 1579–1589. 10.1038/s41591-018-0140-5. - DOI - PubMed
    1. Chang EA, Tomov ML, Suhr ST, Luo J, Olmsted ZT, Paluh JL, and Cibelli J (2015). Derivation of ethnically diverse human induced pluripotent stem cell lines. Sci. Rep. 5, 15234. 10.1038/srep15234. - DOI - PMC - PubMed
    1. Baxi EG, Thompson T, Li J, Kaye JA, Lim RG, Wu J, Ramamoorthy D, Lima L, Vaibhav V, Matlock A, et al. (2022). Answer ALS, a large-scale resource for sporadic and familial ALS combining clinical and multi-omics data from induced pluripotent cell lines. Nat. Neurosci. 25, 226–237. 10.1038/s41593-021-01006-0. - DOI - PMC - PubMed

Publication types

MeSH terms