. 2023 May;164(6):921-936.e1.
doi: 10.1053/j.gastro.2023.01.039. Epub 2023 Feb 8.

TET1 and TDG Suppress Inflammatory Response in Intestinal Tumorigenesis: Implications for Colorectal Tumors With the CpG Island Methylator Phenotype

Affiliations

TET1 and TDG Suppress Inflammatory Response in Intestinal Tumorigenesis: Implications for Colorectal Tumors With the CpG Island Methylator Phenotype

Rossella Tricarico et al. Gastroenterology. 2023 May.

Abstract

Background & aims: Aberrant DNA methylation is frequent in colorectal cancer (CRC), but underlying mechanisms and pathologic consequences are poorly understood.

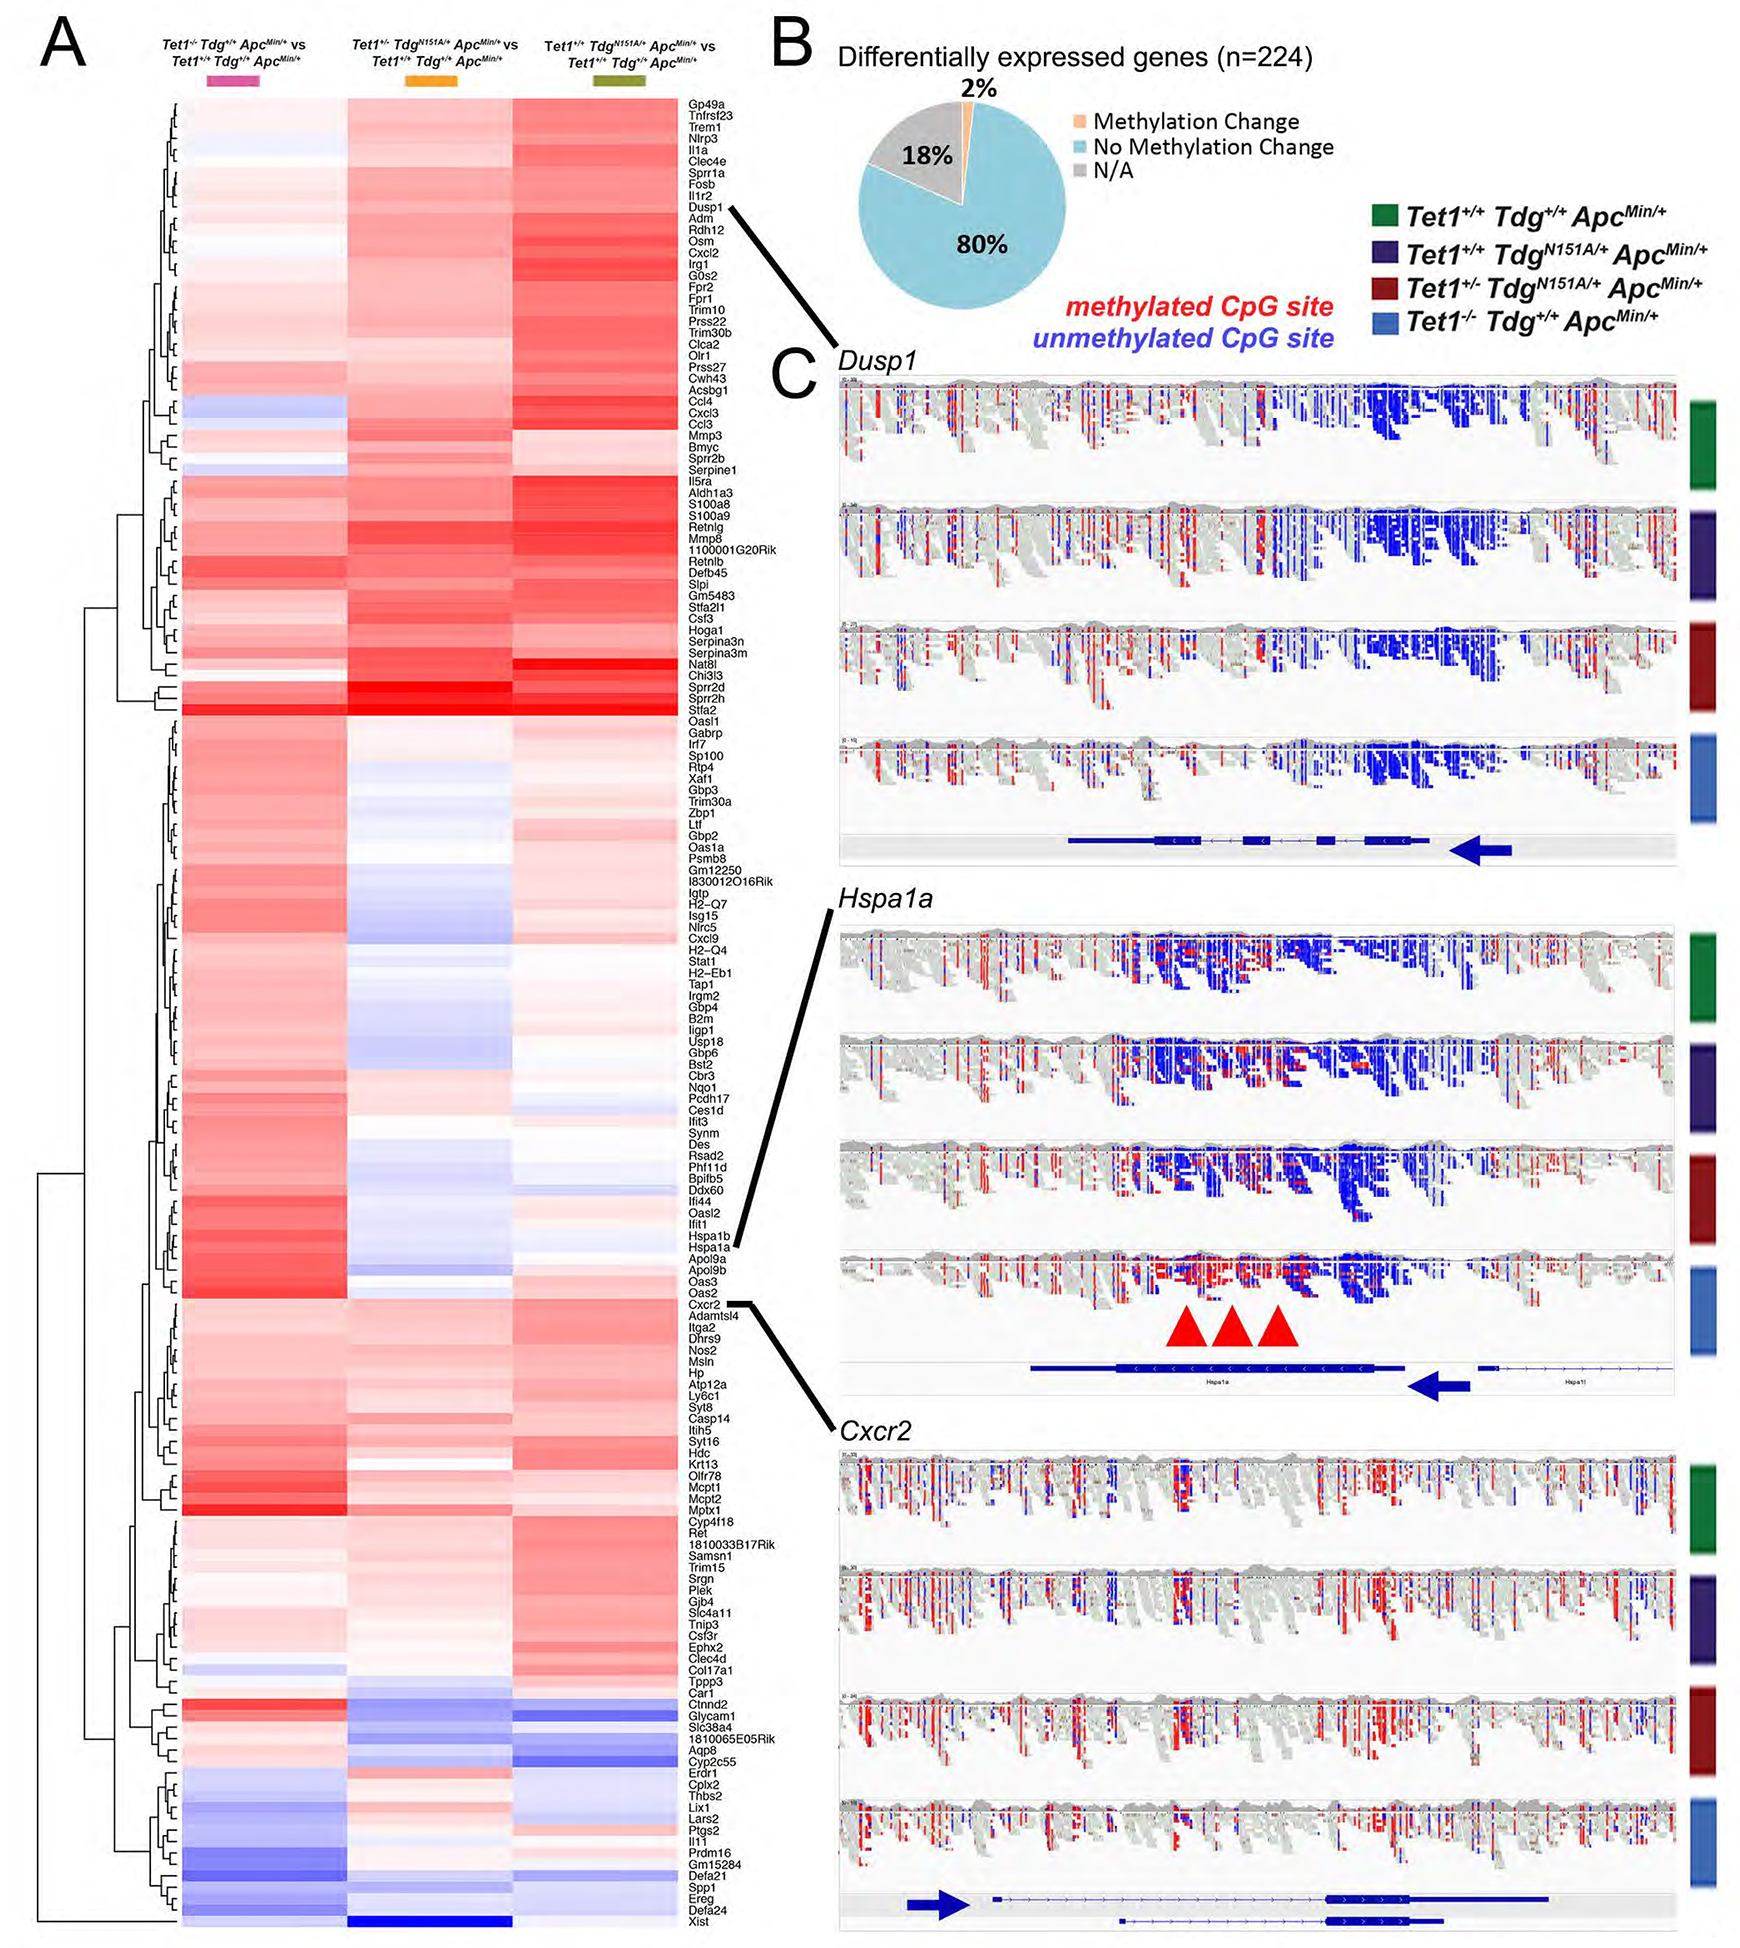
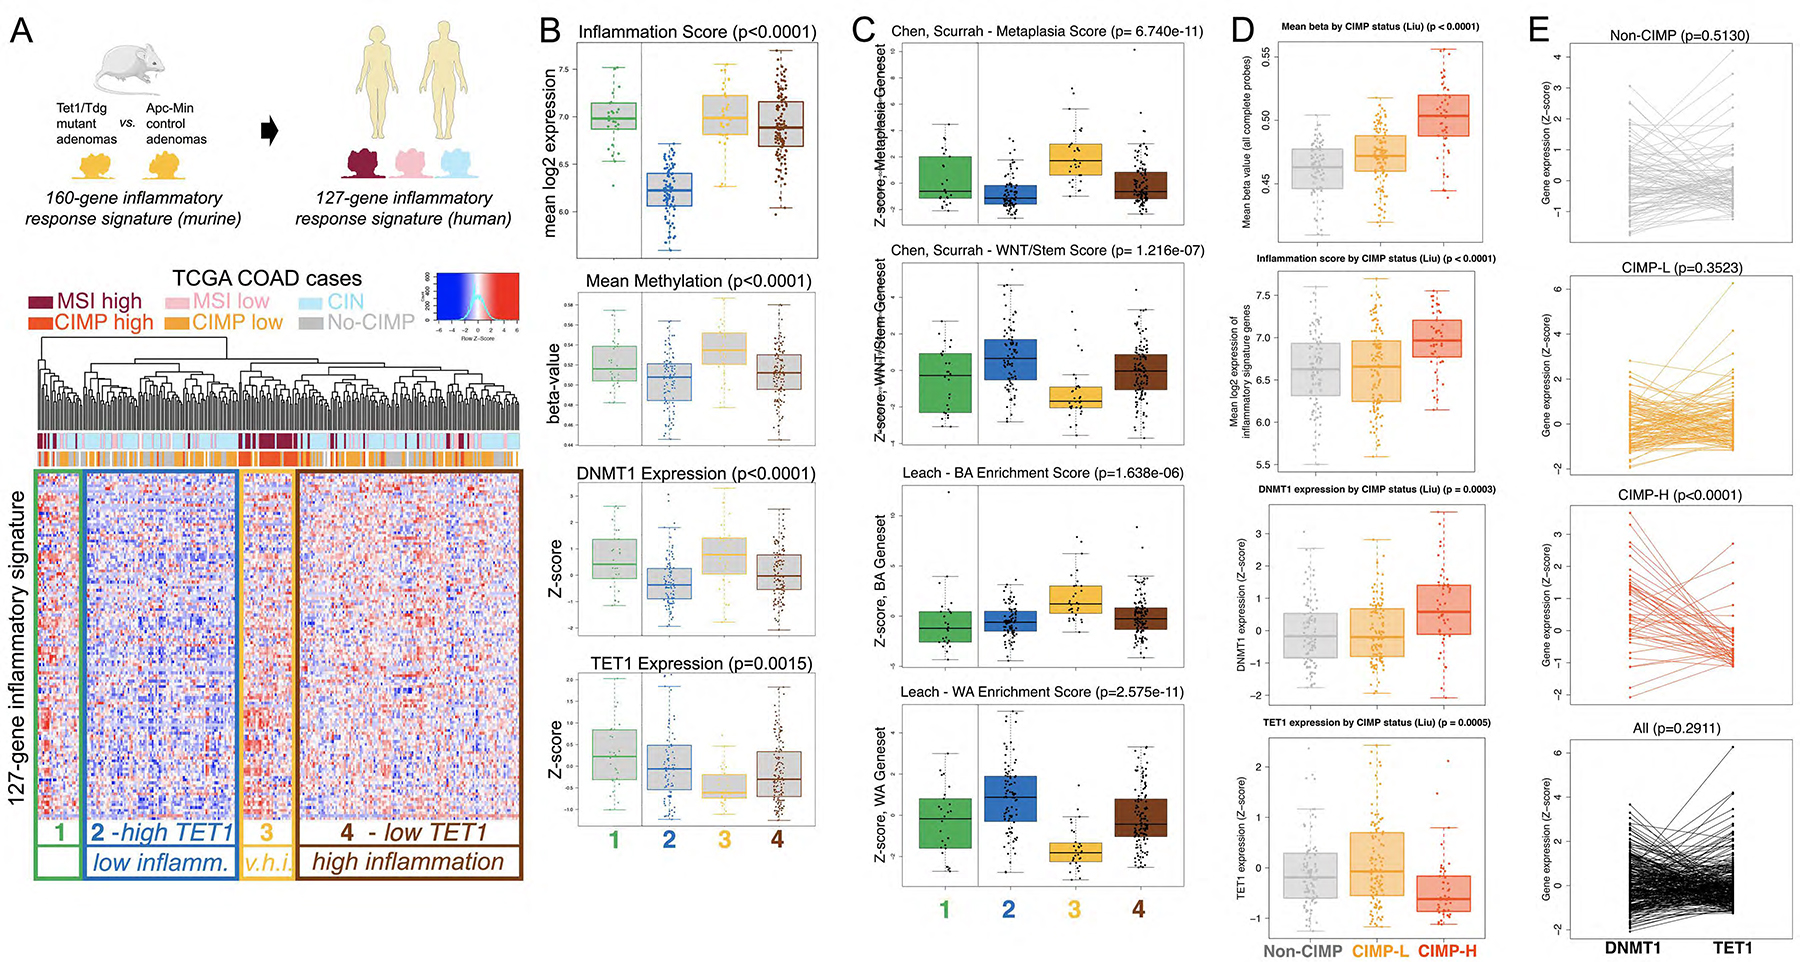
Methods: We disrupted active DNA demethylation genes Tet1 and/or Tdg from ApcMin mice and characterized the methylome and transcriptome of colonic adenomas. Data were compared to human colonic adenocarcinomas (COAD) in The Cancer Genome Atlas.

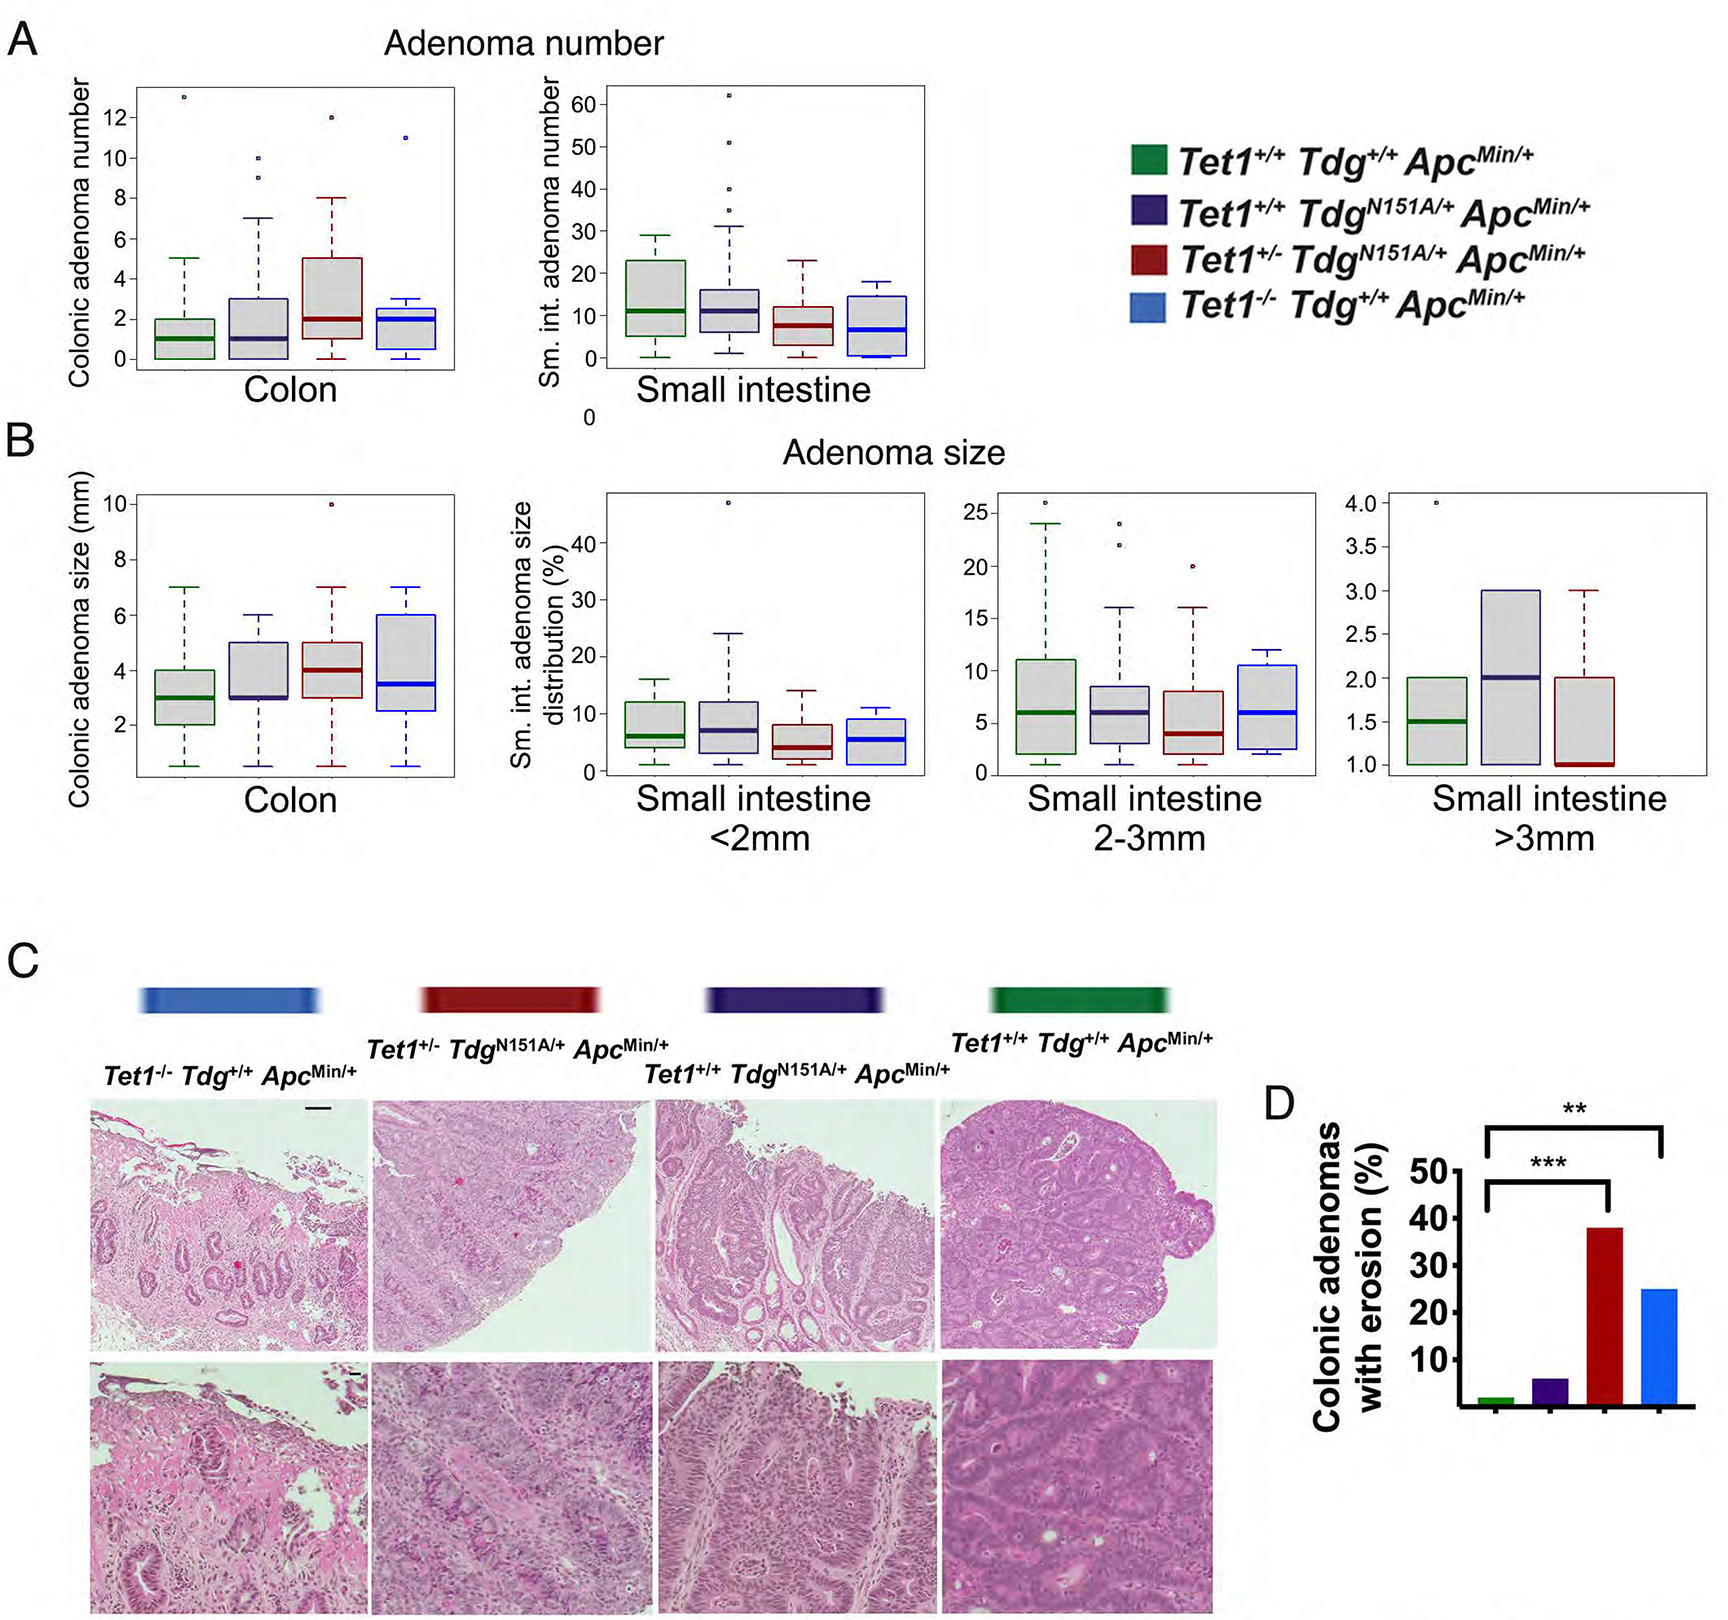
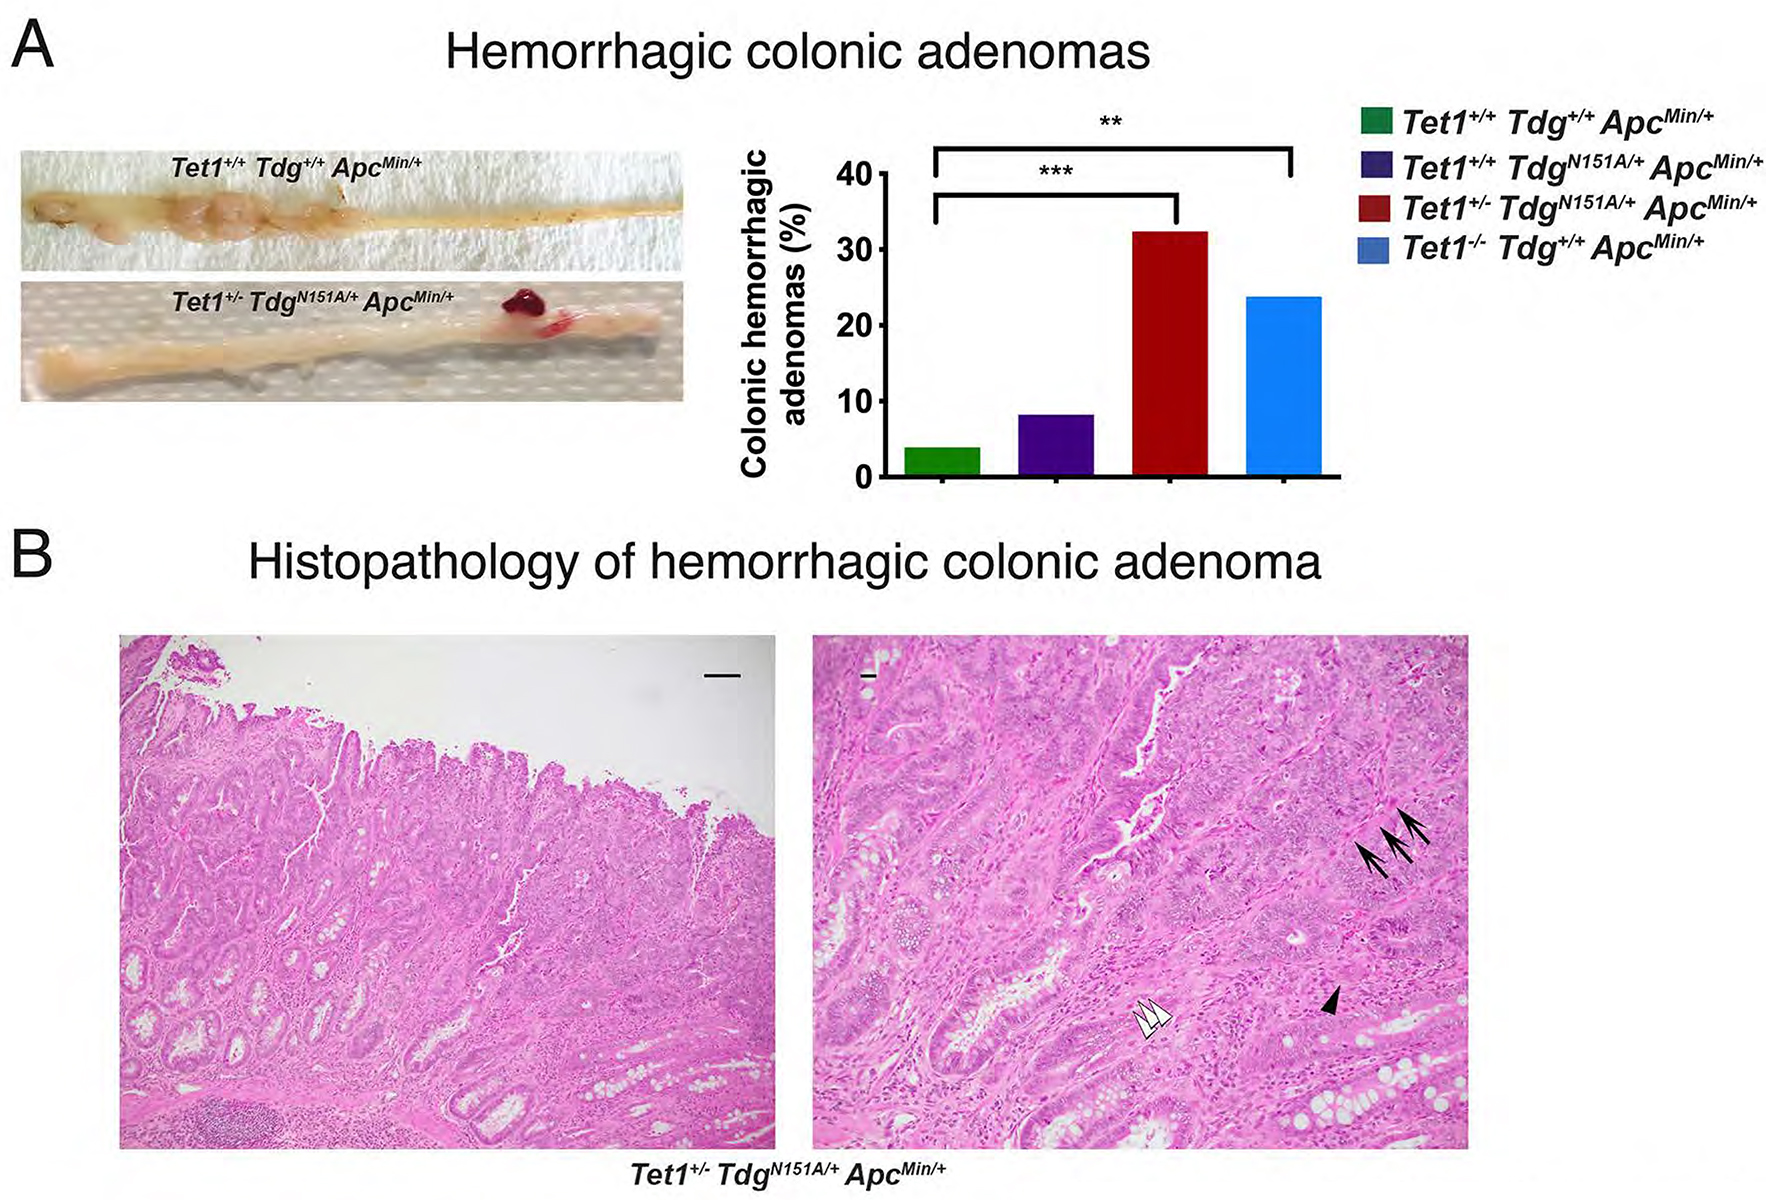
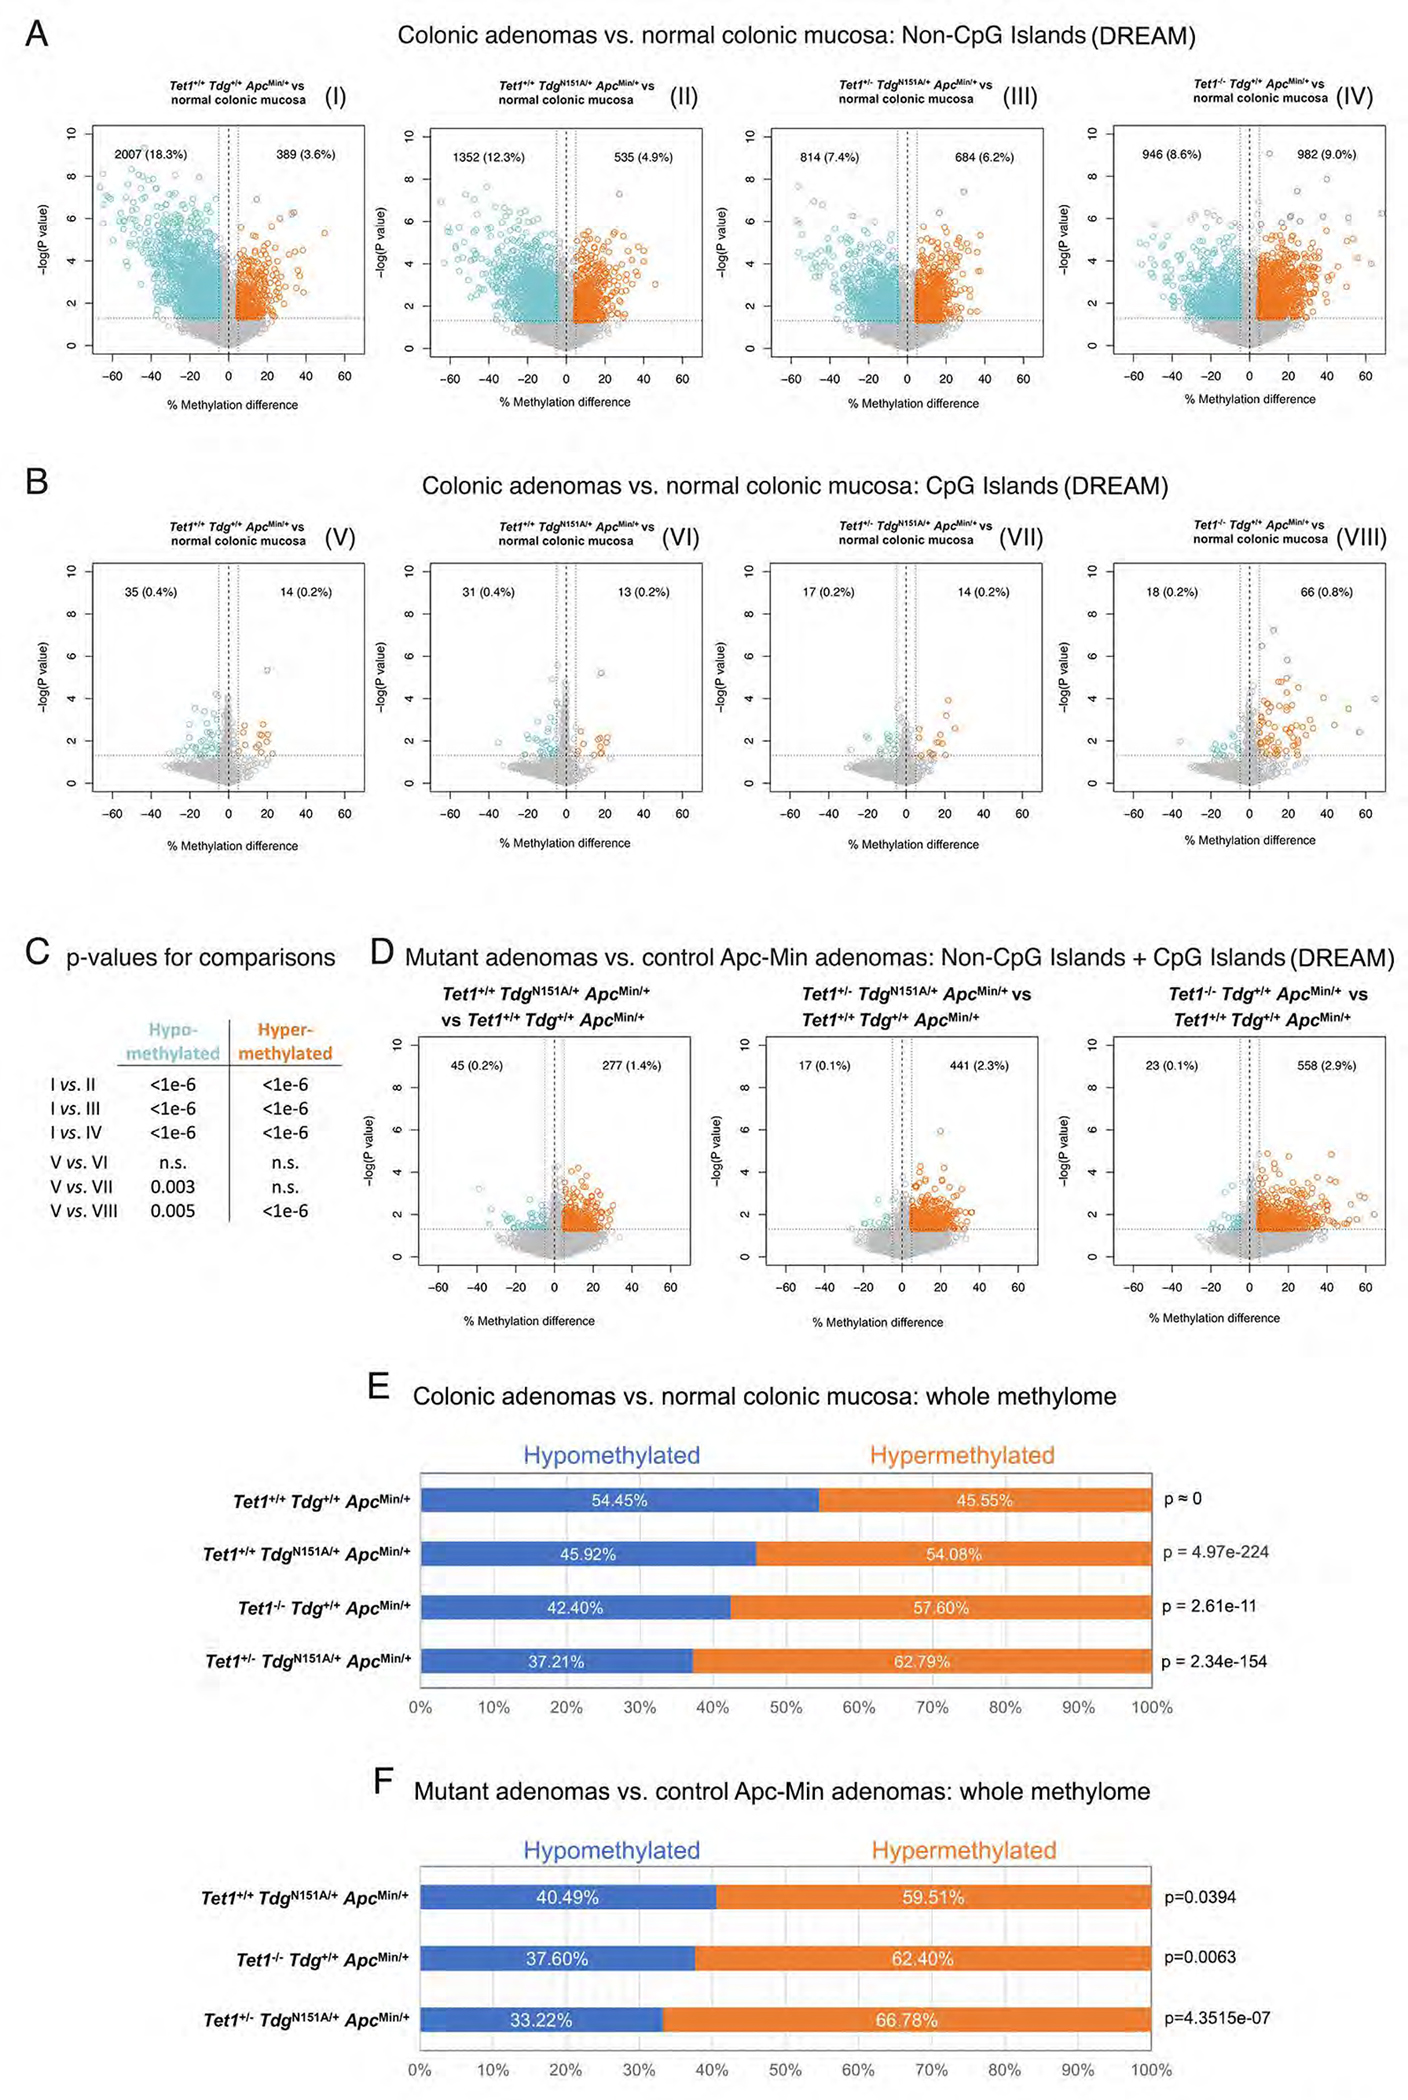
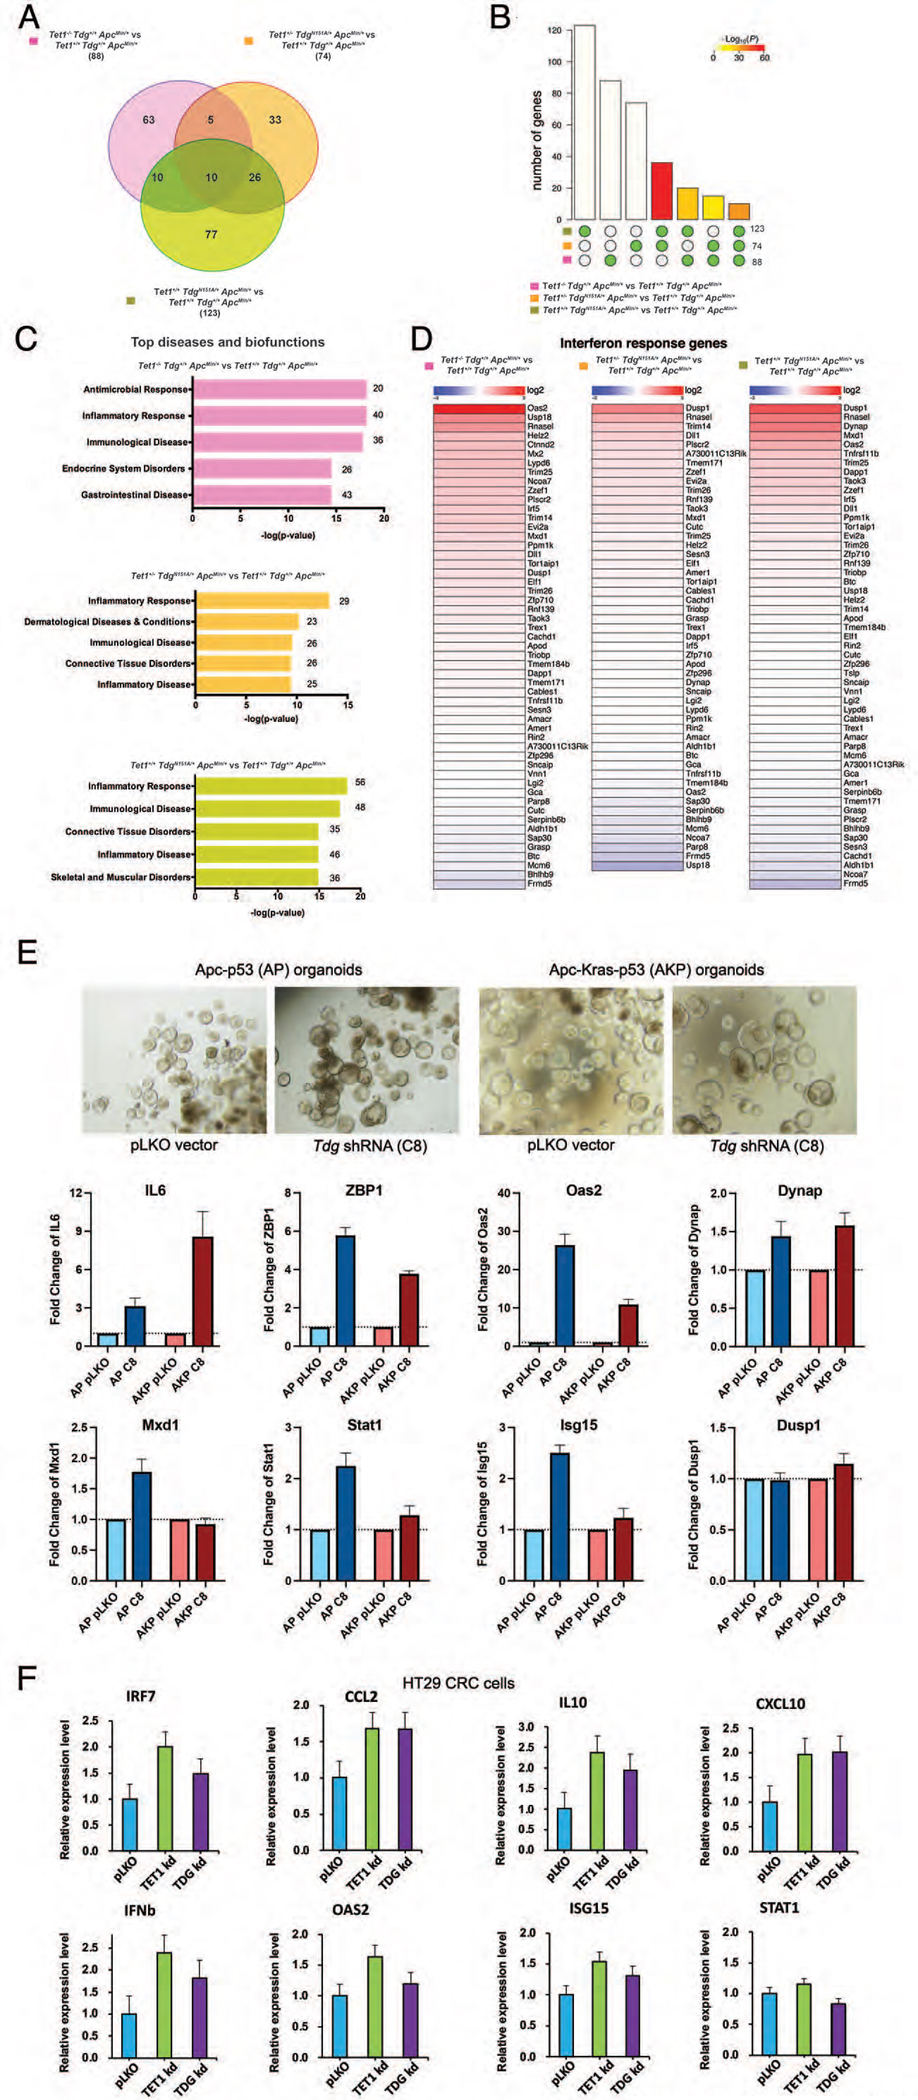
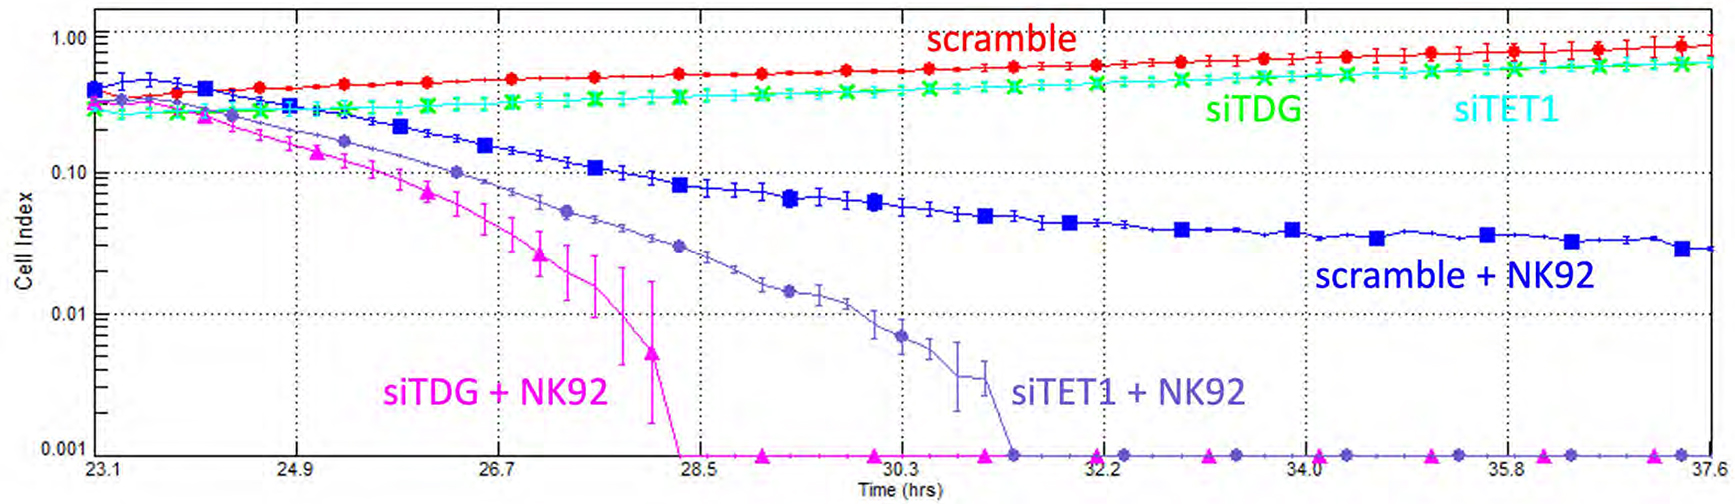
Results: There were increased numbers of small intestinal adenomas in ApcMin mice expressing the TdgN151A allele, whereas Tet1-deficient and Tet1/TdgN151A-double heterozygous ApcMin colonic adenomas were larger with features of erosion and invasion. We detected reduction in global DNA hypomethylation in colonic adenomas from Tet1- and Tdg-mutant ApcMin mice and hypermethylation of CpG islands in Tet1-mutant ApcMin adenomas. Up-regulation of inflammatory, immune, and interferon response genes was present in Tet1- and Tdg-mutant colonic adenomas compared to control ApcMin adenomas. This up-regulation was also seen in murine colonic organoids and human CRC lines infected with lentiviruses expressing TET1 or TDG short hairpin RNA. A 127-gene inflammatory signature separated colonic adenocarcinomas into 4 groups, closely aligned with their microsatellite or chromosomal instability and characterized by different levels of DNA methylation and DNMT1 expression that anticorrelated with TET1 expression. Tumors with the CpG island methylator phenotype (CIMP) had concerted high DNMT1/low TET1 expression. TET1 or TDG knockdown in CRC lines enhanced killing by natural killer cells.

Conclusions: Our findings reveal a novel epigenetic regulation, linked to the type of genomic instability, by which TET1/TDG-mediated DNA demethylation decreases methylation levels and inflammatory/interferon/immune responses. CIMP in CRC is triggered by an imbalance of methylating activities over demethylating activities. These mice represent a model of CIMP CRC.

Keywords: CpG Island Methylator Phenotype; DNA Demethylation; DNA Methylation; Inflammatory Response; Interferon Response.


Conflict of interest statement

Conflicts of interest

J.R.W. has served or is serving as a consultant or advisor for Qsonica, Salarius Pharmaceuticals, Daiichi Sankyo, Inc., Vyne Therapeutics and Lily Asia Ventures. J.R.W also receives funding for research from Salarius Pharmaceuticals and Oryzon Genomics. No relevant conflicts of interest exist for the other authors.

Figures

Figure 1 -
Figure 1 -. Tet1 and Tdg inactivation modifies tumor multiplicity or size in the ApcMin background.
Box plots representations of number (A) and size distribution (B) of colonic and small intestinal adenomas in Tet1−/−Tdg+/+ApcMin/+ mice; Tet1+/−TdgN151A/+ApcMin/+ mice; Tet1+/+TdgN151A/+ApcMin/+ mice, and control Tet1+/+Tdg+/+ApcMin/+ mice. Small intestinal adenomas were binned in: <2mm, 2–3mm and >3mm. (C) Histopathological analysis of adenomas of different genotypes stained by hematoxylin-eosin and visualized at 10x (top row; scale bar=50 microns) and 20x magnification (bottom row; scale bar=10 microns). (D) Frequency of surface erosion in adenomas of different genotypes. **p-value <0.01, ***p-value <0.001.
Figure 2 -
Figure 2 -. Hemorrhagic colonic adenomas in Tet1+/−TdgN151A/+ApcMin/+ mice and Tet1−/−Tdg+/+ApcMin/+ mice.
(A) Gross morphology and percent of hemorrhagic colonic adenomas in the four genotype-groups. **p-value=0.0044, ***p-value=0.0008. (B) Representative pictures of hematoxylin-eosin-stained sections of a hemorrhagic colonic adenoma developed in Tet1+/−TdgN151A/+ApcMin/+ mouse at 10x (left; scale bar=50 microns) and 20x magnification (right; scale bar=10 microns), showing evidence of malignant transformation, evidenced by overall disorganized architecture, irregular, ragged and invading glands. Frame in left panel corresponds to enlarged right panel. White arrowheads mark cancer cells invading the stroma; black arrowhead points to a budding gland; arrows point to capillaries responsible for the characteristic hemorrhagic macroscopic appearance.
Figure 3 -
Figure 3 -. Loss of global DNA hypomethylation in Tet1- and Tdg-mutant ApcMin adenomas.
Volcano plots showing differences in DNA methylation at (A) non-CpG island (NCGI) and (B) CpG island sites (CGI) in each comparison of Tet1−/−Tdg+/+ApcMin/+ adenomas, Tet1+/−TdgN151A/+ApcMin/+ adenomas, Tet1+/+TdgN151A/+ApcMin/+ adenomas and control Tet1+/+Tdg+/+ApcMin/+ adenomas vs. normal colonic mucosa. CpG sites showing average methylation changes ≥5% and p-value<0.05 are highlighted in blue (hypomethylated sites) and orange (hypermethylated sites); number and percent of hypo-/hypermethylated CpG sites over total number of CpG sites analyzed is shown in each Volcano plot. Volcano plots are labeled I through VIII. (C) Summary of p-values for differences in hypo- and hypermethylated CpG sites between the indicated volcano plots in A and B, labeled I through VIII; n.s.=non-significant. (D) Volcano plots showing the global (NCGI + CGI) difference in average DNA methylation in each comparison between Tet1−/−Tdg+/+ApcMin/+ adenomas, Tet1+/−TdgN151A/+ApcMin/+ adenomas, Tet1+/+TdgN151A/+ApcMin/+ adenomas vs. control Tet1+/+Tdg+/+ApcMin/+ adenomas. CpG sites showing average DNA methylation changes ≥5% and p-value<0.05 are highlighted in blue (hypomethylated sites) and orange (hypermethylated sites). (E) Percent hypo- and hyper-methylation in comparisons between normal murine colonic mucosa methylome (GSE57527) and methylome of Tet1−/−Tdg+/+ApcMin/+ adenomas, Tet1+/−TdgN151A/+ApcMin/+ adenomas, Tet1+/+TdgN151A/+ApcMin/+ adenomas and control Tet1+/+Tdg+/+ApcMin/+ adenomas. (F) Percent hypo- and hyper-methylation in each comparison between Tet1−/−Tdg+/+ApcMin/+ adenomas, Tet1+/−TdgN151A/+ApcMin/+ adenomas, Tet1+/+TdgN151A/+ApcMin/+ adenomas vs. control Tet1+/+Tdg+/+ApcMin/+ adenomas. Percent hypo-/hypermethylation is computed by identifying CpGs in the intersection between each methylome comparison; p-value was computed with Wilcoxon rank-sum test.
Figure 4 -
Figure 4 -. Tet1- and/or Tdg-mutant ApcMin adenomas exhibit upregulation of inflammatory, interferon and immune response pathways.
(A) Venn diagrams showing the number of common and differentially expressed genes between Tet1−/−Tdg+/+ApcMin/+ adenomas, Tet1+/−TdgN151A/+ApcMin/+ adenomas, Tet1+/+TdgN151A/+ApcMin/+ adenomas vs. control Tet1+/+Tdg+/+ApcMin/+ adenomas. (B) Bar chart illustrating all possible intersections, by SuperExactTest, among genes differentially expressed (y-axis) in Tet1−/−Tdg+/+ApcMin/+ adenomas, Tet1+/−TdgN151A/+ApcMin/+ adenomas, Tet1+/+TdgN151A/+ApcMin/+ adenomas vs. control Tet1+/+Tdg+/+ApcMin/+ adenomas confirms statistically significant involvement of the same genes in Tet1 and Tdg mutant adenomas. The matrix of solid and empty circles at the bottom illustrates “presence” (solid green) or “absence” (empty) of data sets in each intersection; numbers to the right of the matrix are set sizes; colored bars represent intersection sizes with color intensity showing p-value significance. (C) Ingenuity pathway analysis of differentially expressed genes in Tet1−/−Tdg+/+ApcMin/+ adenomas, Tet1+/−TdgN151A/+ApcMin/+ adenomas, Tet1+/+TdgN151A/+ApcMin/+ adenomas vs. control Tet1+/+Tdg+/+ApcMin/+ adenomas. The most highly enriched gene ontology categories (top diseases and biofunctions) are shown. (D) Differentially expressed genes between Tet1−/−Tdg+/+ApcMin/+ adenomas, Tet1+/−TdgN151A/+ApcMin/+ adenomas, Tet1+/+TdgN151A/+ApcMin/+ adenomas vs. control Tet1+/+Tdg+/+ApcMin/+ adenomas are compared with a list of genes induced by interferon-beta. (E) qRT-PCR showing induction of interferon and inflammatory response genes following Tdg knockdown (C8) versus lentivirus control (pLKO) infection of colonic organoids bearing Apc/p53 mutation (AP) or Apc/Kras/p53 mutation (AKP). Morphology of organoids (phase-contrast) is shown. (F) qRT-PCR showing induction of interferon and inflammatory response genes in HT29 CRC cells following TET1 or TDG knockdown versus lentivirus control (pLKO) infection.
Figure 5 -
Figure 5 -. Tet1/Tdg-related inflammatory signature and methylation changes in differentially expressed genes.
(A) Hierarchical clustering of 160 genes differentially expressed between Tet1−/−Tdg+/+ApcMin/+ adenomas, Tet1+/−TdgN151A/+ApcMin/+ adenomas, Tet1+/+TdgN151A/+ApcMin/+ adenomas vs. control Tet1+/+Tdg+/+ApcMin/+ adenomas. (B) Summary of changes in methylation of differentially expressed genes in comparisons between Tet1−/−Tdg+/+ApcMin/+ adenomas, Tet1+/−TdgN151A/+ApcMin/+ adenomas, Tet1+/+TdgN151A/+ApcMin/+ adenomas vs. control Tet1+/+Tdg+/+ApcMin/+ adenomas. NA: for 18% of genes no methylation data were available in WGEM-seq dataset. (C) Genome browser views of WGEM-seq reads covering select differentially expressed genes. Blue: unmethylated CpG site; red: methylated CpG site. Blue arrows indicate direction of transcription. Red arrowheads mark gene body methylation of Hspa1a.
Figure 6 –
Figure 6 –. The TET1/TDG-related inflammatory signature separates human colon adenocarcinoma cases according to their genomic instability features; concerted high DNMT1 expression and low TET1 expression in human CIMP-H colonic adenocarcinoma.
(A) The 127-gene human TET1/TDG-related inflammatory signature, derived from the 160-gene murine Tet1/Tdg-inflammatory signature, identifies 4 clusters in TCGA COAD (colon adenocarcinoma) differing in microsatellite instability (MSI) or chromosomal instability (CIN) status. V.h.i.=very high inflammation. (B) Box plot representation of inflammation score (expression levels of 127-gene signature), mean methylation, DNMT1 and TET1 expression levels in the 4 clusters. (C) Box plot representation of expression (Z-score) of Metaplasia and WNT/Stem signatures from Chen, Scurrah et al., and BA (Braf-Alk5) and WA (Wnt activation) signatures from Leach et al.. (D) Box plot representation of mean methylation (β-value), inflammation score (expression levels of 127-gene signature), DNMT1 and TET1 expression levels in TCGA COAD cases, separated according to CpG Island Methylator Phenotype (no-CIMP, CIMP-L, and CIMP-H, in gray, orange and red, respectively, as in panel A). (E) Relationship between DNMT1 and TET1 expression levels in TCGA COAD cases (mRNA expression Z-scores from cBioPortal; from top to bottom: no-CIMP, CIMP-L, CIMP-H and all cases); DNMT1 expression was higher than TET1 expression in CIMP-H samples (36/46 cases, 78.3%, p-value< 0.0001 for paired Wilcoxon test).
Figure 7 –
Figure 7 –. Knockdown of TET1 or TDG sensitizes HT29 cells to killing by Natural Killer cells.
Cell killing analysis with xCELLigence system: HT29 cells were transfected with scramble siRNA or siRNA against TET1 or TDG, and the next day incubated or not with NK92 cells, and monitored in real-time for loss of adherent cells.

References

    1. Bray F, Ferlay J, Soerjomataram I, et al. Global cancer statistics 2018: GLOBOCAN estimates of incidence and mortality worldwide for 36 cancers in 185 countries. CA Cancer J Clin 2018;68:394–424. - PubMed
    1. Fearon ER, Vogelstein B. A genetic model for colorectal tumorigenesis. Cell 1990;61:759–767. - PubMed
    1. Feinberg AP, Tycko B. The history of cancer epigenetics. Nat Rev Cancer 2004;4:143–53. - PubMed
    1. Bellacosa A Genetic hits and mutation rate in colorectal tumorigenesis: versatility of Knudson’s theory and implications for cancer prevention. Genes Chromosomes Cancer 2003;38:382–388. - PubMed
    1. Grady WM, Yu M, Markowitz SD. Epigenetic Alterations in the Gastrointestinal Tract: Current and Emerging Use for Biomarkers of Cancer. Gastroenterology 2020. - PMC - PubMed

Publication types