. 2023 Apr:28:58-78.
doi: 10.1016/j.jtos.2023.02.005. Epub 2023 Feb 9.

Experimental design considerations for studies of human tear proteins

Affiliations

Experimental design considerations for studies of human tear proteins

Brooke M Harkness et al. Ocul Surf. 2023 Apr.

Abstract

Purpose: Human tears contain abundant, diverse sets of proteins that may serve as biomarkers of ocular surface health. There is a need for reproducible methods that consider multiple factors influencing the tear proteome, in addition to the variable of interest. Here we examined a workflow for proteomic analysis of tear proteins without the need to pool tear samples from multiple individuals, thus allowing for analyses based on individual factors, and increasing opportunities for protein biomarker discovery.

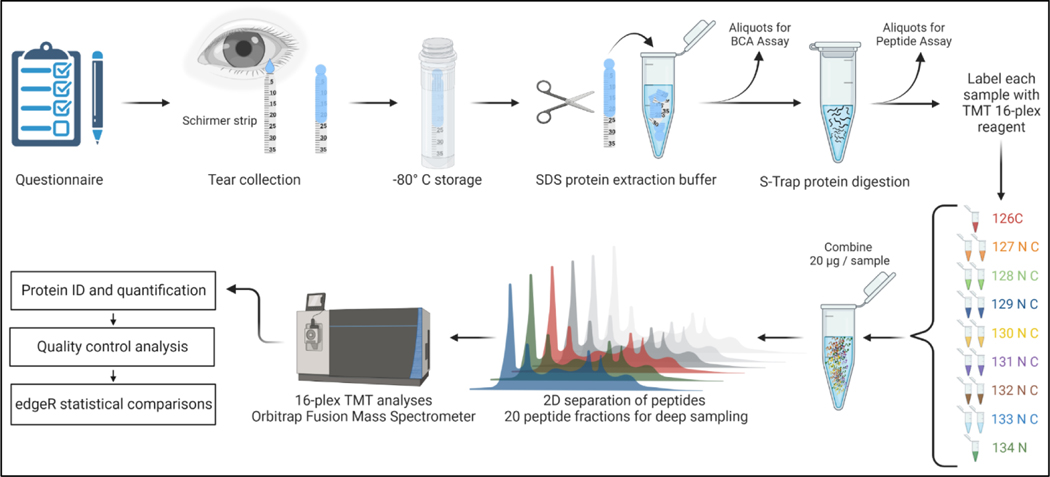
Methods: Tears were collected by Schirmer strip following topical ocular anesthetic application then individually stored at -80 °C prior to processing for proteomics. Tear proteins were extracted from Schirmer strips, digested using suspension trapping spin columns (S-Trap), and labeled with high multiplicity tandem mass tags (TMT). Peptide digests were then extensively fractionated by two-dimensional chromatography and analyzed by mass spectrometry to identify and measure changes in protein abundance in each sample. Analysis of select samples was performed to test protocols and to compare the impact of clinically relevant parameters. To facilitate comparison of separate TMT experiments, common pool samples were included in each TMT instrument run and internal reference scaling (IRS) was performed.

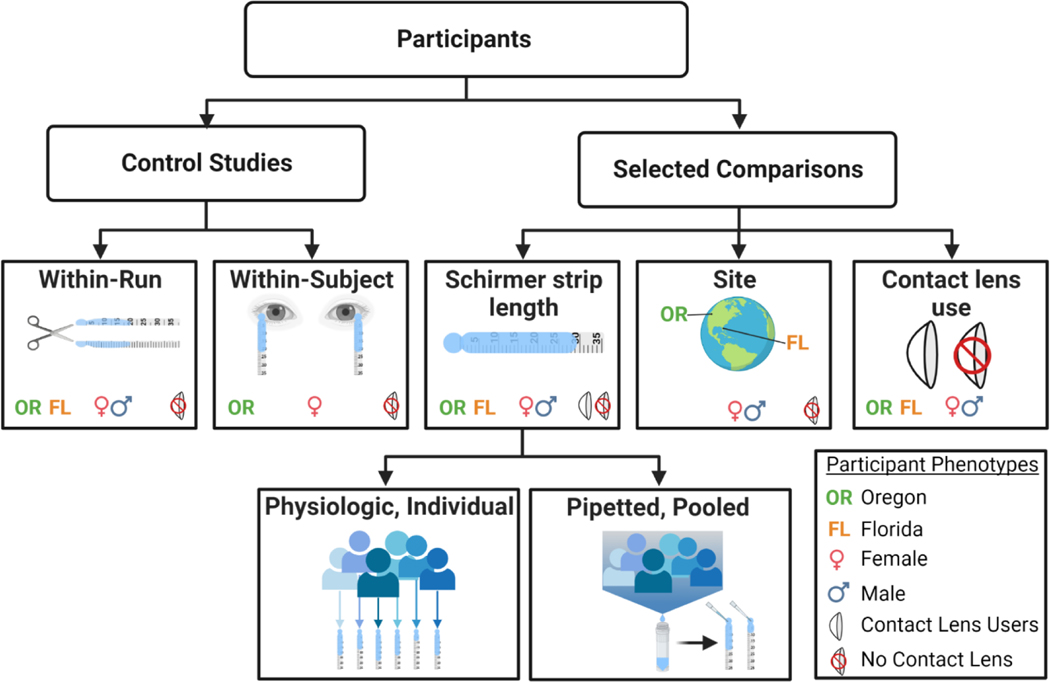
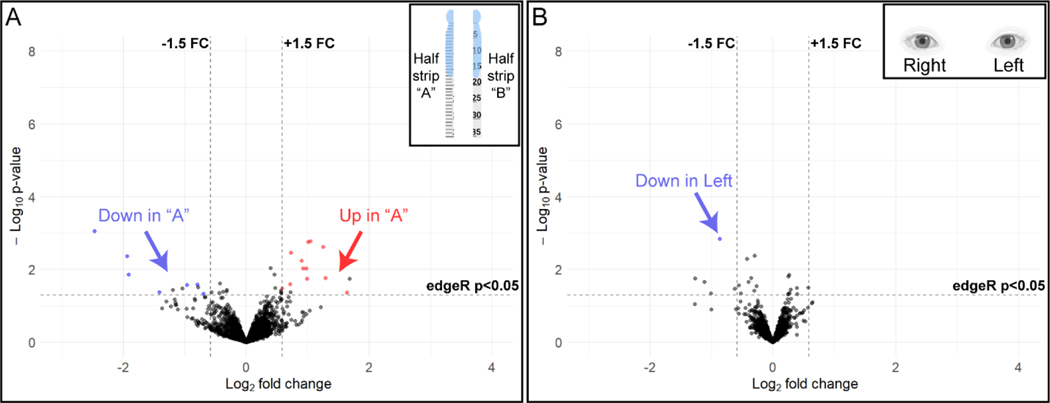
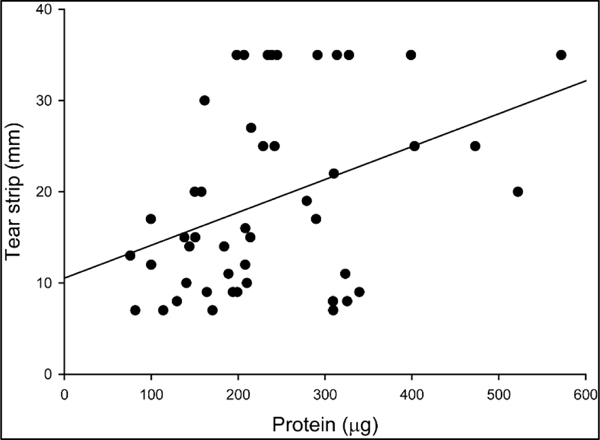
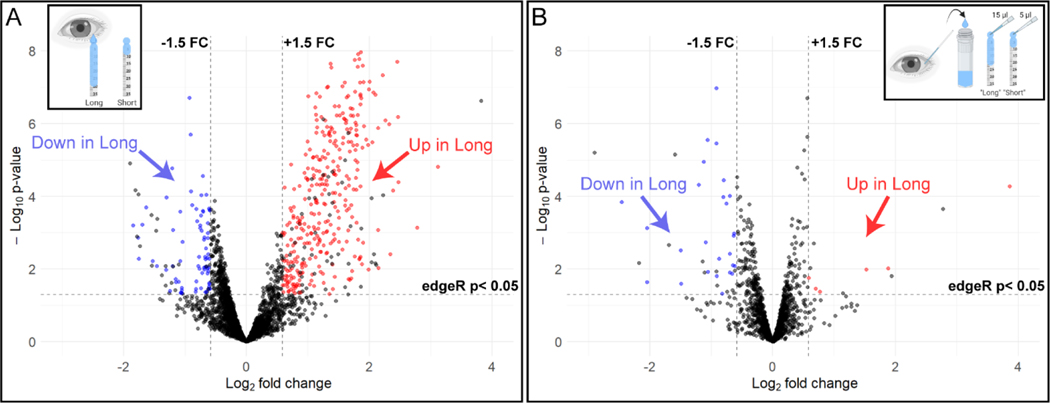
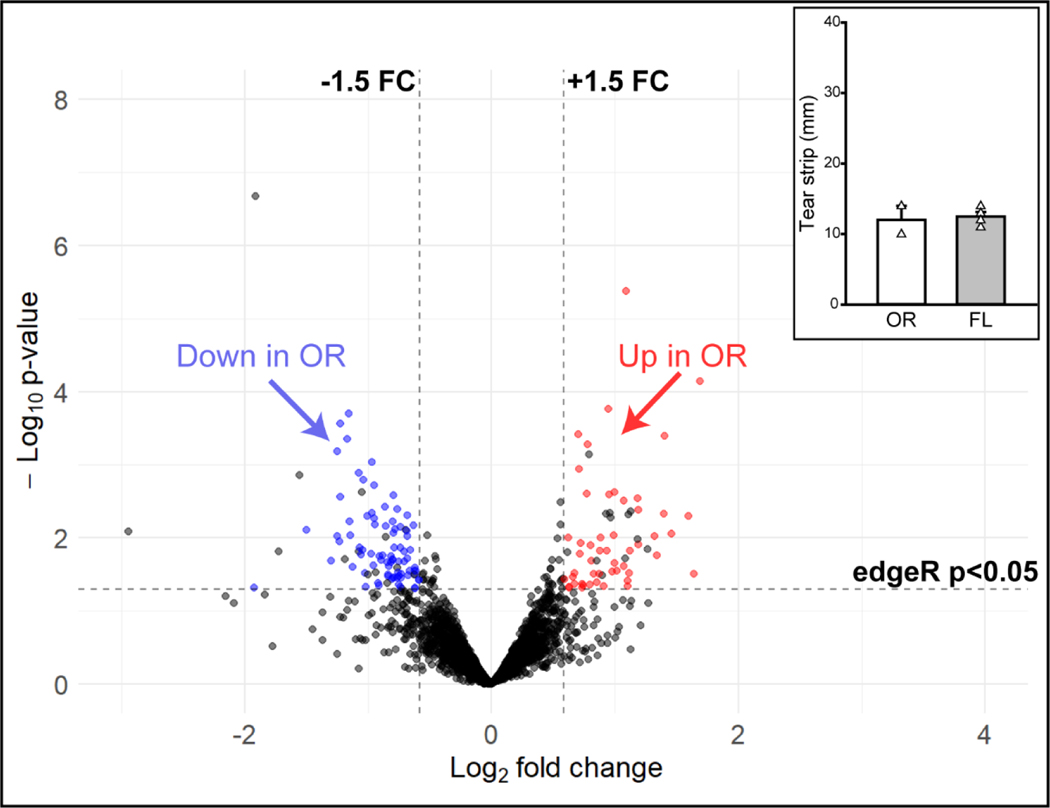
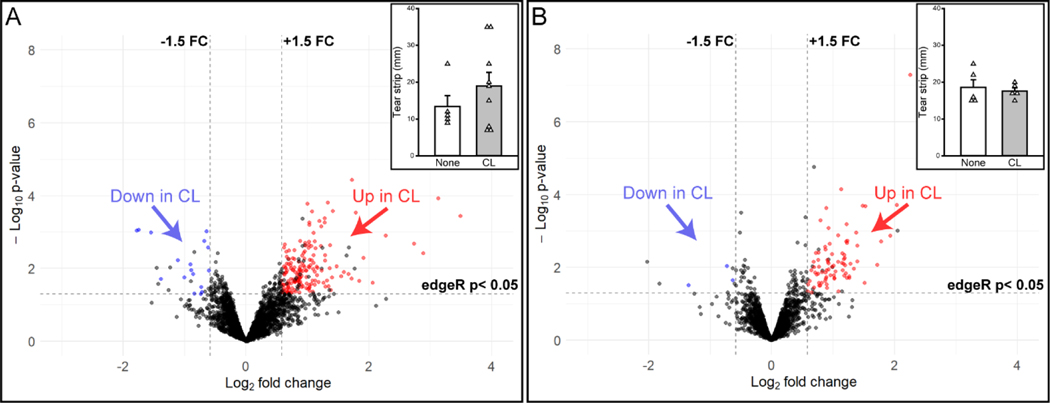
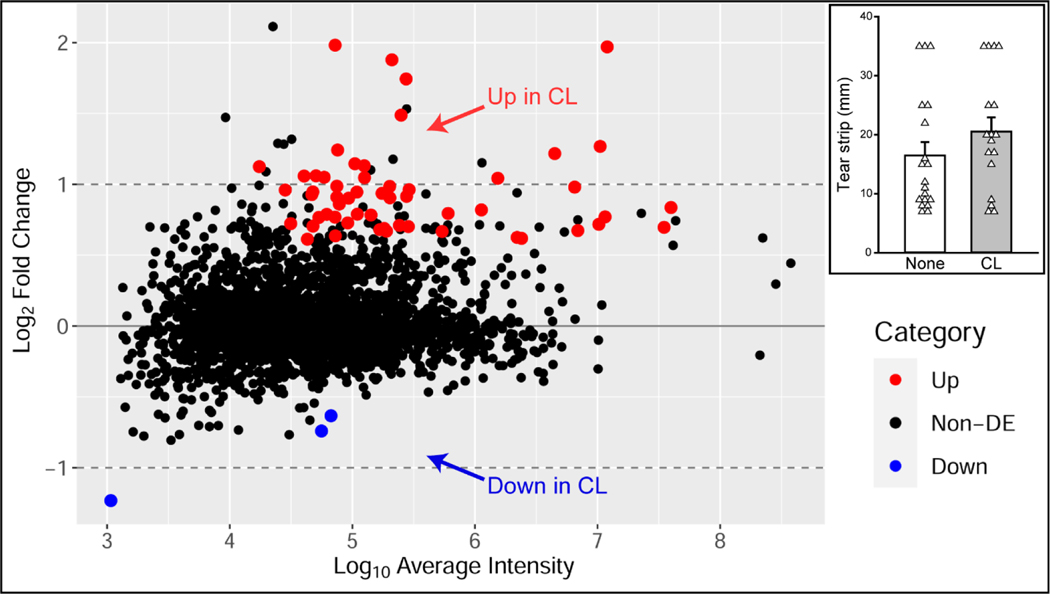
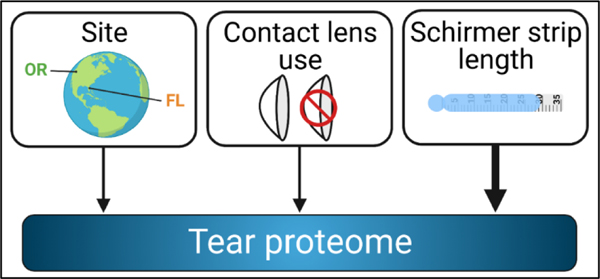
Results: Differences in subsets of tear proteins were noted for: geographic site of tear collection, contact lens use, and differences in tear fluid volume among individuals.

Conclusion: These findings demonstrate that proteomic analysis of human tear proteins can be performed without the need to pool samples, and that development of analytic workflows must consider factors that may affect outcomes in studies focused on diverse clinical samples.

Keywords: Biomarker; Contact lens; Proteome; Schirmer; Tears.


Conflict of interest statement

Conflict of Interest Disclosures

The authors report no conflicts of interest.

Figures

Figure 1.
Figure 1.
Tandem mass tag (TMT) workflow for collection and analysis of human tear fluids. Created with BioRender.com
Figure 2.
Figure 2.
Summary of proteomic control and selected comparisons and p articipant phenotypes within each comparison. Created with BioRender.com
Figure 3.
Figure 3.
Volcano plots of relative protein abundance in (A) replicates of strips cut in half (n = 7 eyes, 2 half-strips/eye, 14 half strips, inset) and (B) left and right eyes of the same individual (n = 4 people, 8 eyes, inset). X-axis values are the log2 fold changes (FC) and y-axis values are the log10 uncorrected edgeR exact test p-values. There were very few proteins that demonstrated an increase (red) or decrease (blue) in relative abundance in (A) half strip “A” as compared to half strip “B”. There was only 1 protein in the left eye (B) that demonstrated decreased (blue) relative abundance when compared to the right eye of the same participant. A complete list of differentially expressed proteins in the above comparisons can be found in Appendix Tables A.1 and A.2. Insets created with BioRender.com
Figure 4.
Figure 4.
Tear protein recovery increases with Schirmer strip wetted length across individual eyes, although there is wide variation. The total amount of protein (μg) recovered from each tear strip was plotted versus the Schirmer strip wetted length (mm). Each data point represents one sample from one eye. Some samples were collected from different eyes of the same participant; therefore, some individuals are represented more than once (n = 47 samples from 37 individuals).
Figure 5.
Figure 5.
Effect of Schirmer strip wetted length on the tear proteome. A) Individuals that naturally produce long Schirmer strip wetted length (inset) show extensive differential abundance of tear proteins as compared to those that produce short Schirmer strip wetted length. (B) Pipetted application of different fluid amounts from pooled tear samples (inset) causes some differential relative abundance of proteins in the pipetted “Long” Schirmer group as compared to the pipetted “Short” group, although not to the extent seen in individuals that naturally produce long Schirmer strip wetted lengths (A). Many proteins demonstrated an increased relative abundance in Long strips (A, red) when compared to Short strips with fewer proteins demonstrating a decrease in relative abundance in Long strips (blue) versus Short strips. The opposite was true in the pipetted samples with very few proteins demonstrating an increase in relative abundance in pipetted “Long” strips (B, red) compared to pipetted “Short” strips and more proteins demonstrating decreased relative abundance in pipetted “Long” strips (blue) compared to pipetted “Short” strips. Due to volcano plot scale standardization, 20 proteins for panel A and 3 proteins for panel B exceeded the scale and are not shown. A complete list of differentially expressed proteins in the above comparisons can be found in Appendix Tables A.3 and A.4. Insets created with BioRender.com
Figure 6.
Figure 6.
Volcano plot of differentially abundant proteins by tear collection site. Oregon (OR) samples demonstrate differential abundance of proteins as compared to Florida (FL) samples. Inset is a graph of Schirmer strip wetted lengths from OR and FL samples included in this comparison. Even when Schirmer strip wetted length was controlled, there were proteins that were increased (red) or decreased (blue) in relative abundance in OR samples as compared to FL samples. There was one protein that exceeded the standardized scales set for these volcano plots and is not shown. A complete list of differentially expressed proteins in the above comparisons can be found in Appendix Table A.5. Inset: Mean tear strip length ± SEM. White triangles represent individual sample values within each group.
Figure 7.
Figure 7.
Volcano plots of differentially abundant proteins with soft contact lens (CL) use for (A) individuals with a wide range of Schirmer strip wetted length or (B) individuals with more restricted Schirmer length. Both panels depict the number of proteins that increase (red) or decrease (blue) in relative abundance in CL users as compared to those participants who do not use CLs. One protein exceeded the standardized scales and was not shown in the figure (A). Insets are Schirmer strip wetted lengths from CL users (CL, gray bar) and those who do not use CLs (None, white bar) for each experiment. A complete list of differentially expressed proteins in the above comparisons can be found in Appendix Tables A.6 and A.7. Insets: Mean tear strip lengths ± SEM. White triangles represent individual sample values within each group.
Figure 8.
Figure 8.
Visual representation of the 2596 total proteins detected in the combined contact lens (CL) analysis of differentially abundant proteins in CL users as compared to CL non-users. Proteins that met criteria for differential abundance are color-coded by those that had increased (red) and decreased (blue) abundance in CL users. Proteins that were not differentially expressed (Non-DE) between the two groups are shown in black. Inset: Schirmer tear strip wetted lengths are balanced between the CL group (CL, gray bar) and non-user group (None, white bar) with a wide variation in strip lengths. Inset: Bars indicate mean strip lengths ± SEM. White triangles represent individual sample values within each group.
Figure 9.
Figure 9.
Various factors may influence an individual’s tear proteome and should be taken into consideration when designing and conducting tear proteomic studies. Geographic site and soft contact lens use contributed modestly to changes in the tear proteome, while tear volume (Schirmer tear strip wetted length) contributed most significantly to changes in the tear proteome in our experiments. Created with BioRender.com

References

    1. Dartt DA and Willcox MD, Complexity of the tear film: importance in homeostasis and dysfunction during disease. Exp Eye Res, 2013. 117: p. 1–3. - PMC - PubMed
    1. Dor M, et al. , Investigation of the global protein content from healthy human tears. Exp Eye Res, 2019. 179: p. 64–74. - PubMed
    1. Kenny A, et al. , Proteins and microRNAs are differentially expressed in tear fluid from patients with Alzheimer’s disease. Sci Rep, 2019. 9(1): p. 15437. - PMC - PubMed
    1. Willcox MD, Tear film, contact lenses and tear biomarkers. Clin Exp Optom, 2019. 102(4): p. 350–363. - PubMed
    1. Benitez-Del-Castillo JM, et al. , Quantification of a panel for dry-eye protein biomarkers in tears: A comparative pilot study using standard ELISA and customized microarrays. Mol Vis, 2021. 27: p. 243–261. - PMC - PubMed

Publication types