. 2023 May;145(5):597-610.
doi: 10.1007/s00401-023-02547-3. Epub 2023 Feb 10.

Dysregulation of astrocytic Ca2+ signaling and gliotransmitter release in mouse models of α-synucleinopathies

Affiliations

Dysregulation of astrocytic Ca2+ signaling and gliotransmitter release in mouse models of α-synucleinopathies

Carmen Nanclares et al. Acta Neuropathol. 2023 May.

Erratum in

Abstract

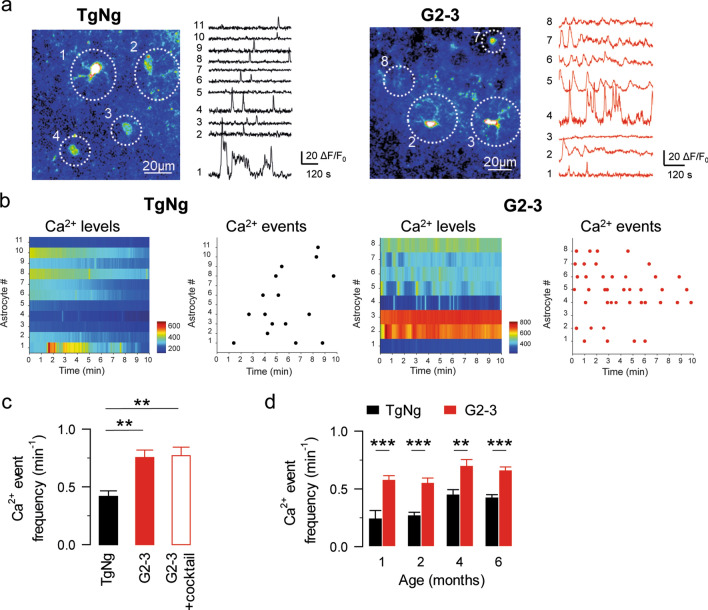
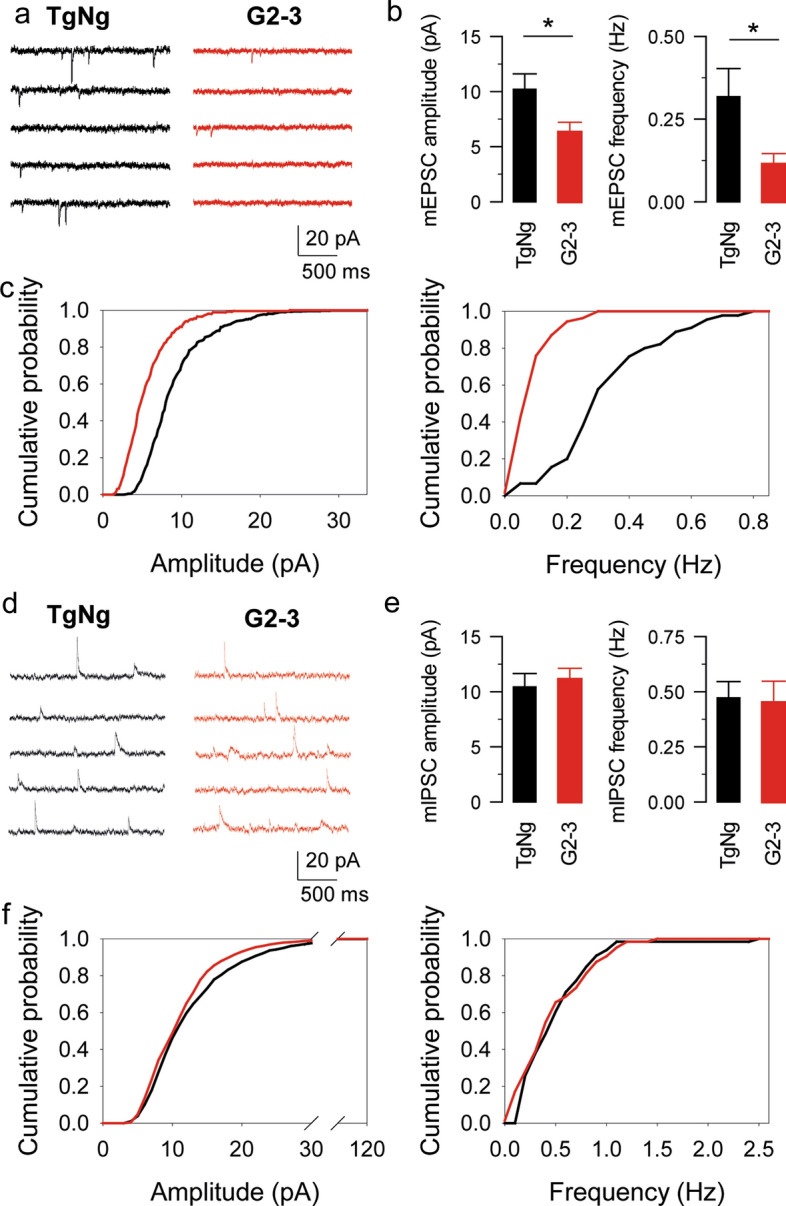
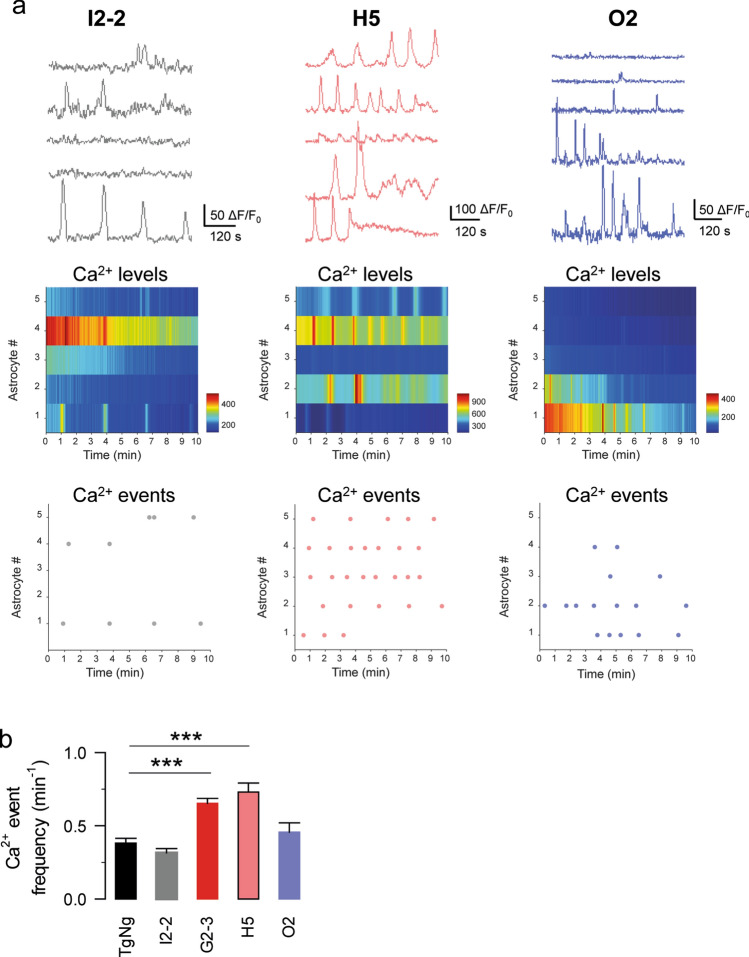
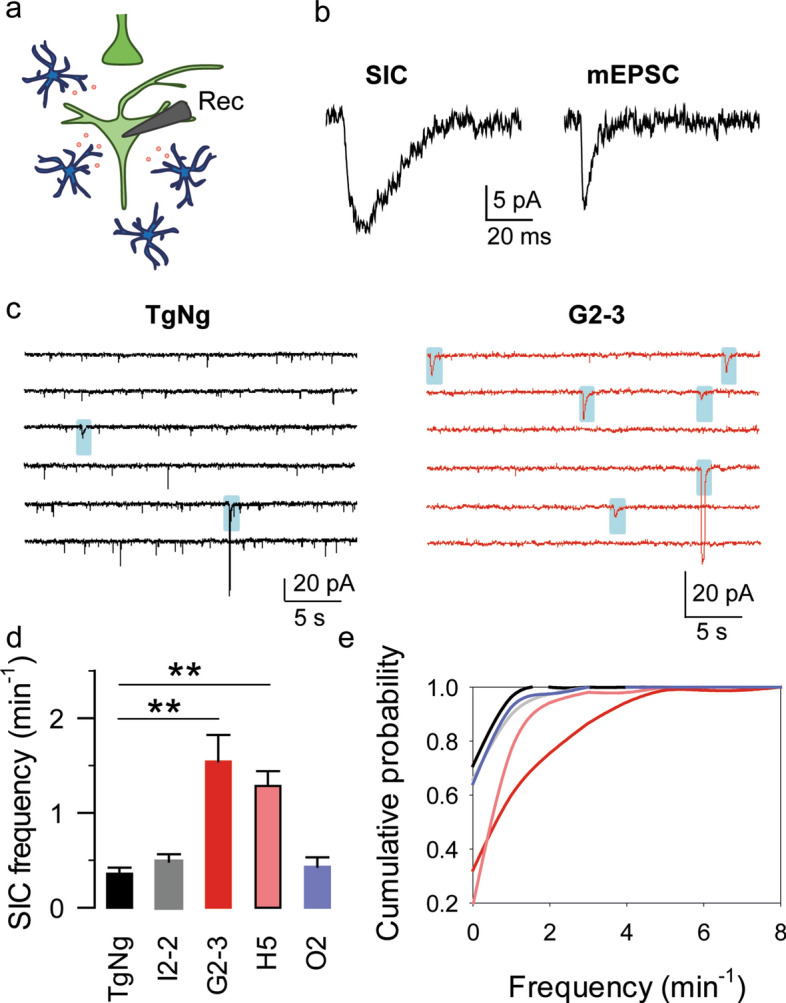
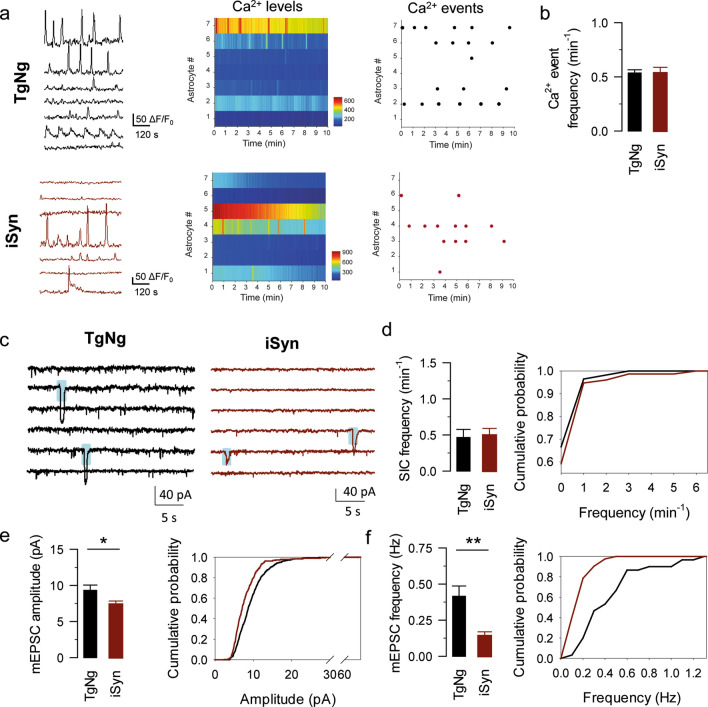
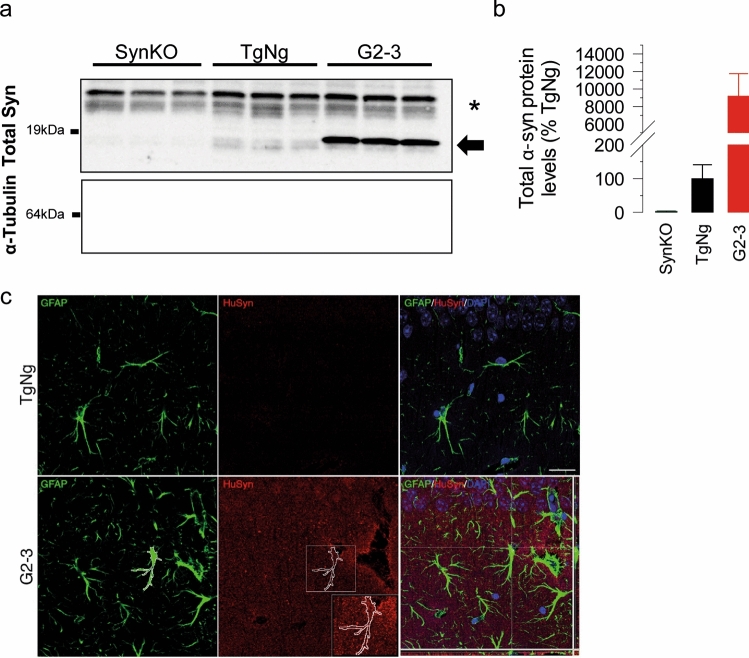
α-Synuclein is a major component of Lewy bodies (LB) and Lewy neurites (LN) appearing in the postmortem brain of Parkinson's disease (PD) and other α-synucleinopathies. While most studies of α-synucleinopathies have focused on neuronal and synaptic alterations as well as dysfunctions of the astrocytic homeostatic roles, whether the bidirectional astrocyte-neuronal communication is affected in these diseases remains unknown. We have investigated whether the astrocyte Ca2+ excitability and the glutamatergic gliotransmission underlying astrocyte-neuronal signaling are altered in several transgenic mouse models related to α-synucleinopathies, i.e., mice expressing high and low levels of the human A53T mutant α-synuclein (G2-3 and H5 mice, respectively) globally or selectively in neurons (iSyn mice), mice expressing human wildtype α-synuclein (I2-2 mice), and mice expressing A30P mutant α-synuclein (O2 mice). Combining astrocytic Ca2+ imaging and neuronal electrophysiological recordings in hippocampal slices of these mice, we have found that compared to non-transgenic mice, astrocytes in G2-3 mice at different ages (1-6 months) displayed a Ca2+ hyperexcitability that was independent of neurotransmitter receptor activation, suggesting that the expression of α-synuclein mutant A53T altered the intrinsic properties of astrocytes. Similar dysregulation of the astrocyte Ca2+ signal was present in H5 mice, but not in I2-2 and O2 mice, indicating α-synuclein mutant-specific effects. Moreover, astrocyte Ca2+ hyperexcitability was absent in mice expressing the α-synuclein mutant A53T selectively in neurons, indicating that the effects on astrocytes were cell-autonomous. Consistent with these effects, glutamatergic gliotransmission was enhanced in G2-3 and H5 mice, but was unaffected in I2-2, O2 and iSyn mice. These results indicate a cell-autonomous effect of pathogenic A53T expression in astrocytes that may contribute to the altered neuronal and synaptic function observed in α-synucleinopathies.

Keywords: Astrocyte; Calcium; Gliotransmission; Synucleinopathies; α-synuclein.


Conflict of interest statement

The authors declare that they have no conflict of interest.

Figures

Fig. 1
Fig. 1
Astrocyte Ca2+ signal is altered in G2-3 transgenic mice. a Pseudocolor images and representative traces of Ca2+ fluorescence intensities obtained from transgene negative (TgNg) and G2-3 mice. b Heat map indicating Ca2+ levels and raster plot indicating Ca2+ events along time obtained from TgNg and G2-3 mice. c Ca2+ events per minute obtained from TgNg and G2-3 mice in control conditions and in the presence of a cocktail of antagonists. d Ca2+ events per minute obtained from TgNg and G2-3 mice at different ages. Data are expressed as mean ± s.e.m. (**)p < 0.01, (***)p < 0.001
Fig. 2
Fig. 2
The increase in astrocyte Ca2+ event frequency observed in the G2-3 mice is not a consequence of an increase in neurotransmitter release. a mEPSC traces recorded from TgNg and G2-3 mice. b mEPSC amplitude and frequency obtained from TgNg and G2-3 mice. Data are expressed as mean ± s.e.m. (*) p < 0.05. c Cumulative probability of mEPSC amplitude (left; the maximum difference between the cumulative distributions, D, is 0.44781 with a corresponding p < 0.001) and mEPSC frequency (right; the maximum difference between the cumulative distributions, D, is 0.74444 with a corresponding p < 0.001). d mIPSC traces recorded from TgNg and G2-3 mice. e mIPSC amplitude and frequency obtained from TgNg and G2-3 mice. Data are expressed as mean ± s.e.m. f Cumulative probability of mIPSC amplitude (left; the maximum difference between the cumulative distributions, D, is 0.09153 with a corresponding p > 0.1) and mIPSC frequency (right; the maximum difference between the cumulative distributions, D, is 0.17188 with a corresponding p > 0.1)
Fig. 3
Fig. 3
Astrocyte Ca2+ alterations are A53T-mutant specific. a Representative Ca2+ traces, heat maps and raster plots obtained from astrocytes in I2-2, H5 and O2 mice. b Ca2+ events per minute obtained from TgNg, I2-2, G2-3, H5 and O2 mice. Data are expressed as mean ± s.e.m. (***) p < 0.001
Fig. 4
Fig. 4
Astrocytic glutamate release is increased in G2-3 mice. a Scheme of the experimental approach. Note the glutamate (red) release by astrocytes (blue) and the recording CA1 pyramidal neuron (light green). b Representative SIC and mEPSC traces. c Representative SIC traces (shaded in blue) obtained from TgNg and G2-3 mice. d SICs per minute obtained from TgNg, I2-2, G2-3, H5 and O2 mice. Data are expressed as mean ± s.e.m. (**) p < 0.01. e Cumulative SIC frequency obtained from TgNg, I2-2 (the maximum difference between the cumulative distributions from TgNg and I2-2 mice, D, is 0.064902 with a corresponding p > 0.1), G2-3 (the maximum difference between the cumulative distributions from TgNg and G2-3 mice, D, is 0.386869 with a corresponding p > 0.1), H5 (the maximum difference between the cumulative distributions from TgNg and H5 mice, D, is 0.516783 with a corresponding p > 0.05) and O2 (the maximum difference between the cumulative distributions from TgNg and O2 mice, D, is 0.067116 with a corresponding p > 0.1) mice
Fig. 5
Fig. 5
Astrocyte–neuron signaling is not altered by neuronal α-synuclein. a Representative Ca2+ fluorescence traces obtained from TgNg and iSyn mice (left), heat maps indicating Ca2+ levels from TgNg and iSyn mice (middle), raster plots indicating Ca2+ events from TgNg and iSyn mice (right). b Ca2+ events per minute obtained from TgNg and iSyn mice. c Representative SIC (shaded in blue) and mEPSC traces obtained from TgNg and iSyn mice. d SICs per minute obtained from TgNg and iSyn mice (left), cumulative SIC frequency obtained from TgNg and iSyn mice (right; the maximum difference between the cumulative distributions, D, is 0.074561 with a corresponding p > 0.1). e mEPSC amplitude (left) and cumulative amplitude (right; the maximum difference between the cumulative distributions, D, is 0.22012 with a corresponding p < 0.001) obtained from TgNg and iSyn mice. f mEPSC frequency (left) and cumulative frequency (right; the maximum difference between the cumulative distributions, D, is 0.58571 with a corresponding p < 0.025) obtained from TgNg and iSyn mice. Data are expressed as mean ± s.e.m. (*) p < 0.05 and (**) p < 0.01
Fig. 6
Fig. 6
Analysis of α-synuclein expression in astrocytes. Lysates from primary astrocyte cultures from brains of SynKO, TgNg and G2-3 mice were analyzed for α-synuclein expression. a Immunoblot for α-synuclein from brain samples from SynKO, TgNg and G2-3 mice. α-tubulin is used as a loading control. Note that G2-3 astrocytes show strong α-syn reactivity (arrow). α-syn is present in TgNg astrocytes but not in SynKO astrocytes. *Non-specific band. b α-synuclein protein levels quantified from a. Data was normalized to α-tubulin levels and relativized to TgNg. c Astrocytes within the stratum radiatum of G2-3 mice, but not TgNg mice, contain intracellular human α-syntransgenic negative; TgNg glial fibrillary acidic protein, GFAP human alpha-synuclein, HuSyn. Scale bar = 25 μm

References

    1. Angelova PR, Ludtmann MH, Horrocks MH, Negoda A, Cremades N, Klenerman D, Dobson CM, Wood NW, Pavlov EV, Gandhi S, et al. Ca2+ is a key factor in alpha-synuclein-induced neurotoxicity. J Cell Sci. 2016;129:1792–1801. doi: 10.1242/jcs.180737. - DOI - PMC - PubMed
    1. Araque A, Carmignoto G, Haydon PG. Dynamic signaling between astrocytes and neurons. Annu Rev Physiol. 2001;63:795–813. doi: 10.1146/annurev.physiol.63.1.795. - DOI - PubMed
    1. Araque A, Carmignoto G, Haydon PG, Oliet SH, Robitaille R, Volterra A. Gliotransmitters travel in time and space. Neuron. 2014;81:728–739. doi: 10.1016/j.neuron.2014.02.007. - DOI - PMC - PubMed
    1. Araque A, Martin ED, Perea G, Arellano JI, Buno W. Synaptically released acetylcholine evokes Ca2+ elevations in astrocytes in hippocampal slices. J Neurosci. 2002;22:2443–2450. doi: 10.1523/JNEUROSCI.22-07-02443.2002. - DOI - PMC - PubMed
    1. Araque A, Parpura V, Sanzgiri RP, Haydon PG. Tripartite synapses: glia, the unacknowledged partner. Trends Neurosci. 1999;22:208–215. doi: 10.1016/S0166-2236(98)01349-6. - DOI - PubMed

Publication types

Substances