. 2023 Feb 10;8(1):63.
doi: 10.1038/s41392-023-01316-8.

O-GlcNAcylation of YTHDF2 promotes HBV-related hepatocellular carcinoma progression in an N6-methyladenosine-dependent manner

Affiliations

O-GlcNAcylation of YTHDF2 promotes HBV-related hepatocellular carcinoma progression in an N6-methyladenosine-dependent manner

Yang Yang et al. Signal Transduct Target Ther. .

Abstract

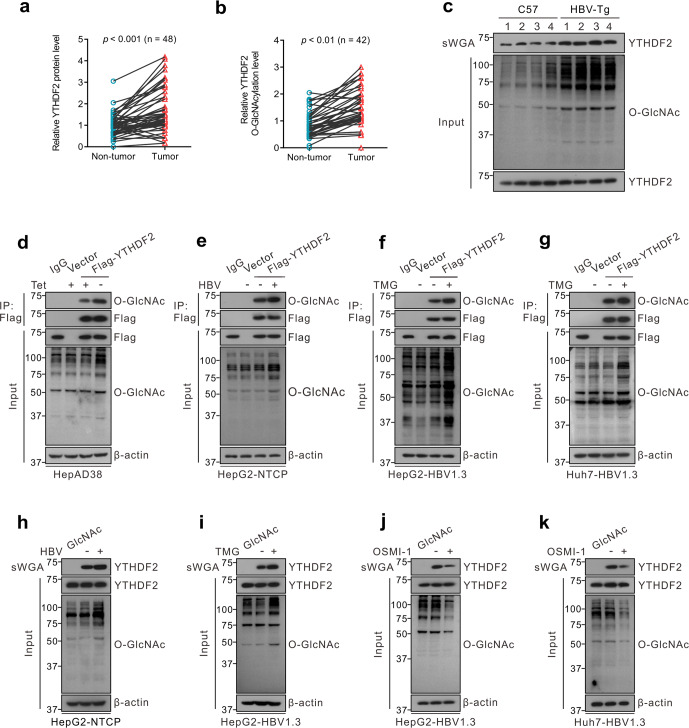
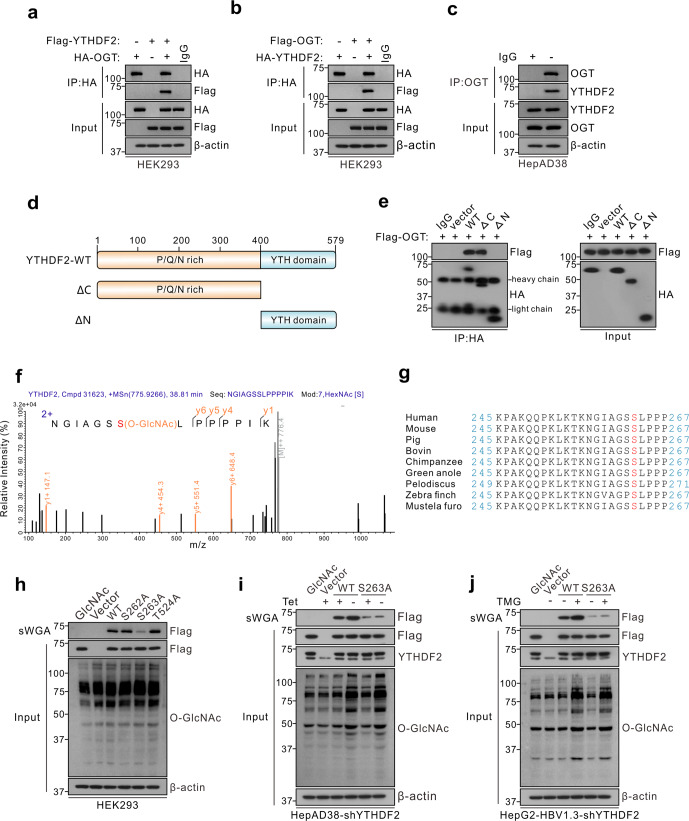
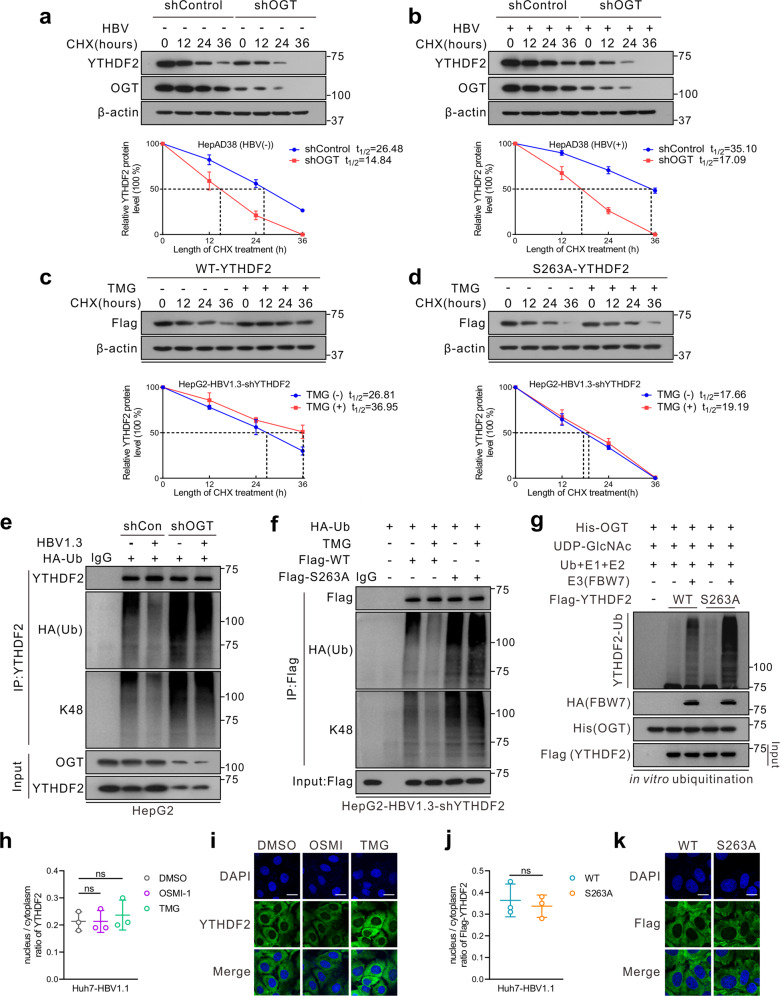
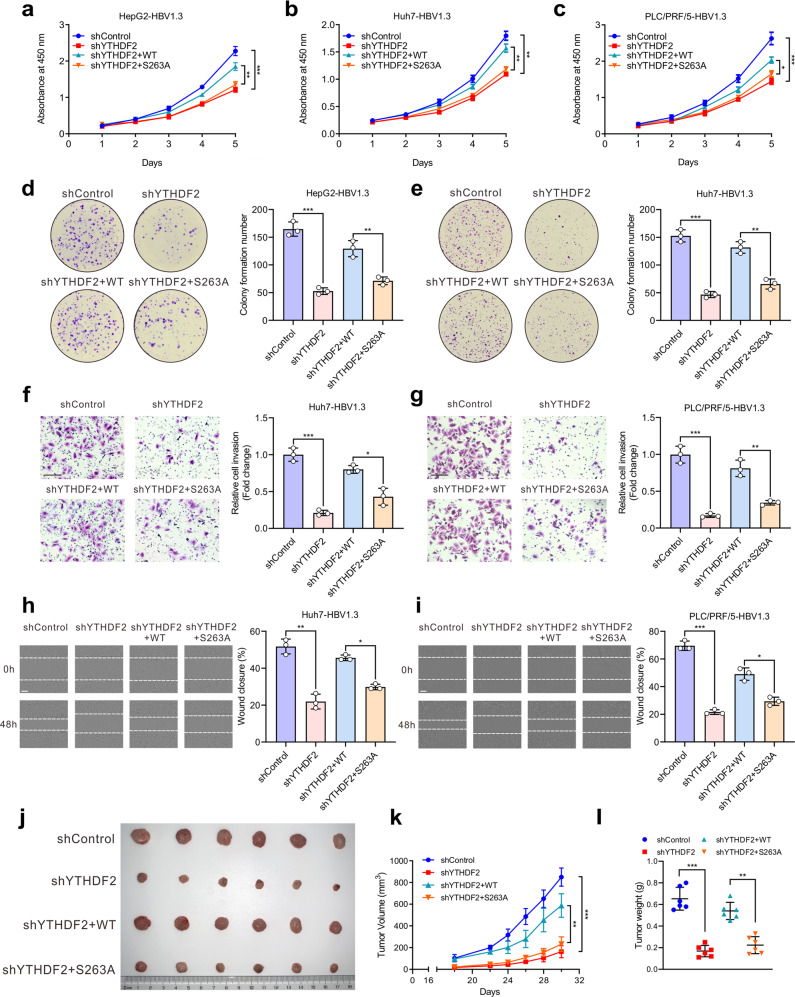
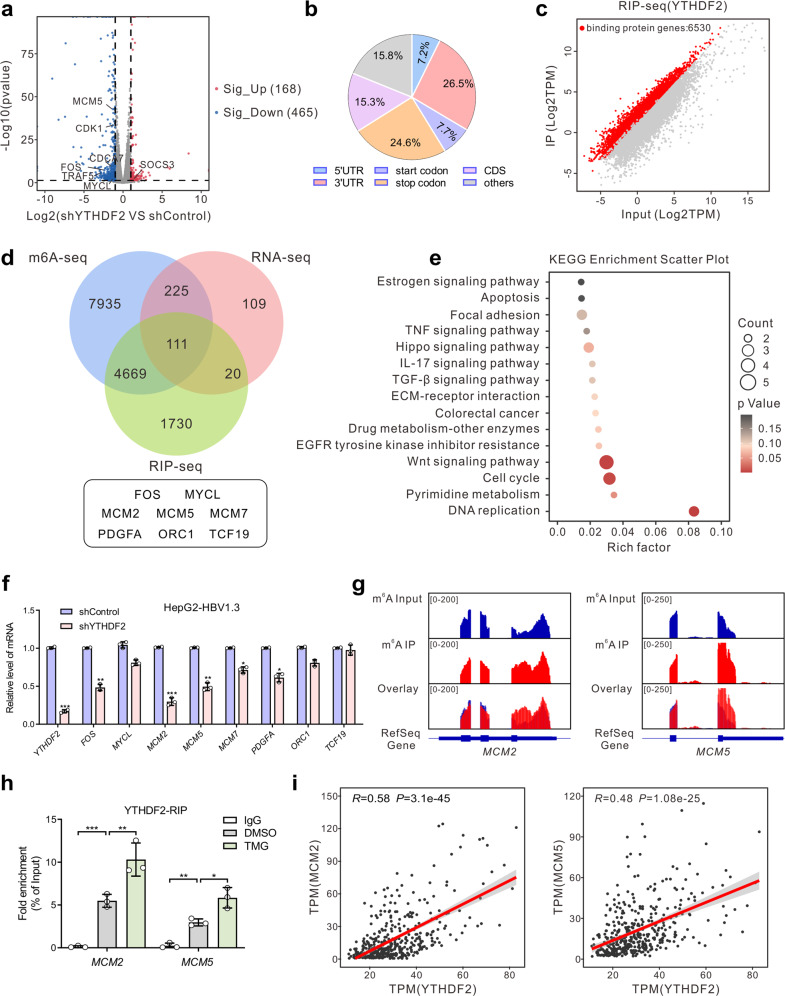
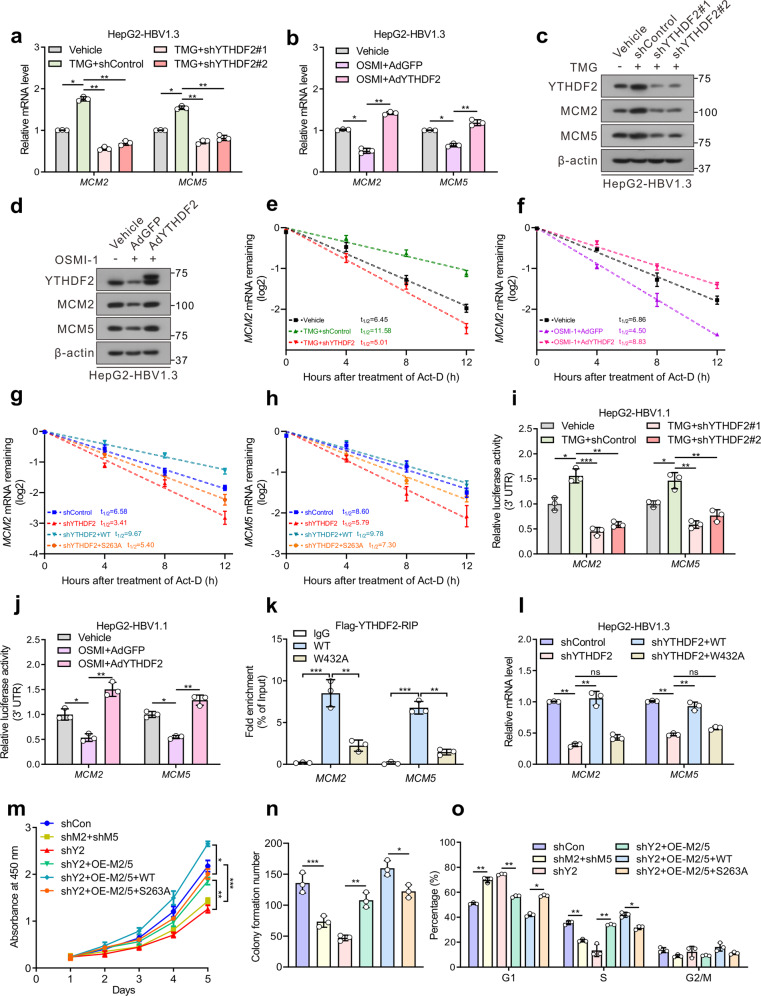
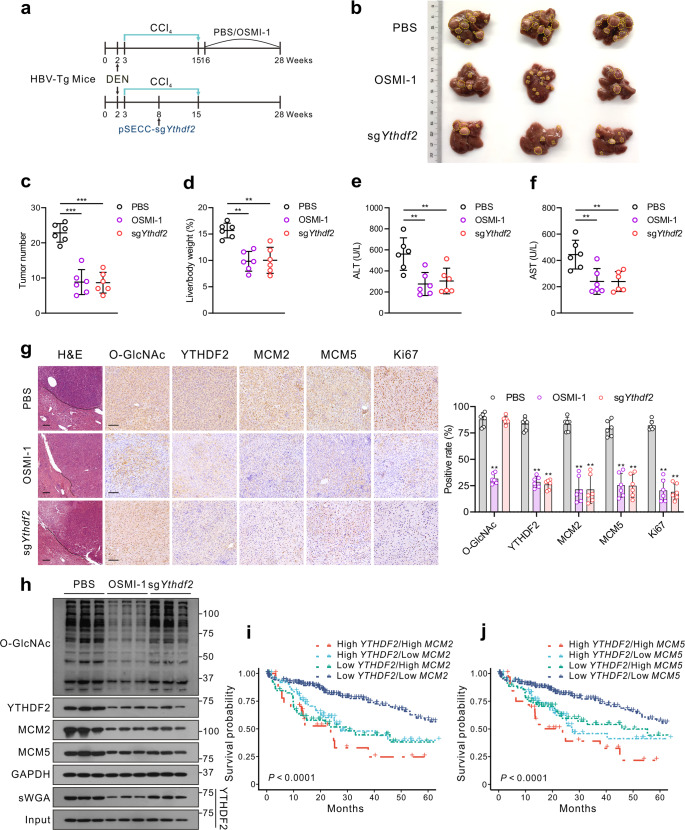
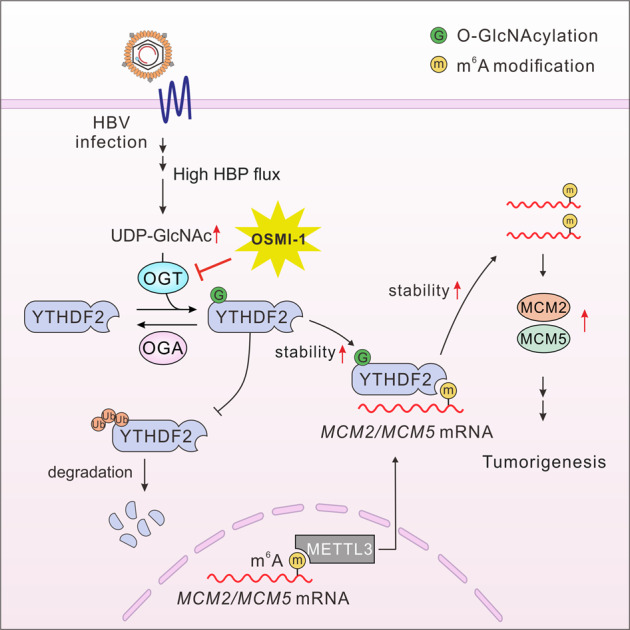
Hepatitis B virus (HBV) infection is a major risk factor for hepatocellular carcinoma (HCC), but its pathogenic mechanism remains to be explored. The RNA N6-methyladenosine (m6A) reader, YTH (YT521-B homology) domain 2 (YTHDF2), plays a critical role in the HCC progression. However, the function and regulatory mechanisms of YTHDF2 in HBV-related HCC remain largely elusive. Here, we discovered that YTHDF2 O-GlcNAcylation was markedly increased upon HBV infection. O-GlcNAc transferase (OGT)-mediated O-GlcNAcylation of YTHDF2 on serine 263 enhanced its protein stability and oncogenic activity by inhibiting its ubiquitination. Mechanistically, YTHDF2 stabilized minichromosome maintenance protein 2 (MCM2) and MCM5 transcripts in an m6A-dependent manner, thus promoting cell cycle progression and HBV-related HCC tumorigenesis. Moreover, targeting YTHDF2 O-GlcNAcylation by the OGT inhibitor OSMI-1 significantly suppressed HCC progression. Taken together, our findings reveal a new regulatory mechanism for YTHDF2 and highlight an essential role of YTHDF2 O-GlcNAcylation in RNA m6A methylation and HCC progression. Further description of the molecular pathway has the potential to yield therapeutic targets for suppression of HCC progression due to HBV infection.


Conflict of interest statement

The authors declare no competing interests.

Figures

Fig. 1
Fig. 1
YTHDF2 O-GlcNAcylation is enhanced upon HBV infection. a Immunoblots quantitative analysis of YTHDF2 expression in HBV-associated HCC tumors (n = 48), P < 0.001. b Analysis of YTHDF2 O-GlcNAcylation in HBV-associated HCC tumors (n = 42) by succinylated wheat germ agglutinin (sWGA) pull-down assays. YTHDF2 O-GlcNAcylation levels were quantified, P < 0.01. c Analysis of YTHDF2 O-GlcNAcylation in HBV-transgenic mice (n = 4), normal C57 mice were used as control. dg YTHDF2 Immunoprecipitation (IP) with anti-Flag M2 agarose beads in hepatoma cells transfected with Flag-YTHDF2 or a vector control. Specifically, HepAD38 cells were cultured without tetracycline (tet) (d), HepG2-NTCP cells were infected with HBV viruses (e), HepG2 cells (f) and Huh7 cells (g) were infected with AdHBV1.3 (named as HepG2-HBV1.3 and Huh7-HBV1.3) and treated with 25 μΜ Thiamet G (TMG) for 12 h. hk sWGA pull-down assays were performed in HepG2-NTCP cells infected with HBV viruses (h), HepG2-HBV1.3 cells (i, j) and Huh7-HBV1.3 cells (k) treated with 25 μΜ TMG or 20 μΜ OSMI-1 for 12 h. Western blotting was determined by anti-YTHDF2. All the presented input was adjusted to a similar level for the following IP or sWGA-binding assay
Fig. 2
Fig. 2
OGT mediates O-GlcNAcylation of YTHDF2 on Ser263. a, b Co-IP of OGT and YTHDF2 with anti-HA in HEK293 cells co-transfected with Flag (or HA)-YTHDF2 and HA (or Flag)-OGT expression constructs. c Co-IP of endogenous OGT and YTHDF2 in HepAD38 cells. d Schematic representation of the YTHDF2 constructs. YTHDF2-WT contains two domains, amino-terminal region (1–400aa, ΔC) and YTH domain (401–579aa, ΔN). e The interactions between OGT and the full-length or the truncated YTHDF2 (ΔC or ΔN) were determined in HEK293 cells by Co-IP. f LC-MS analysis of Flag-YTHDF2 identified residue Ser263 as the YTHDF2 O-GlcNAcylation site. g Cross-species sequence alignment of YTHDF2. h sWGA pull-down assay with anti-Flag in HEK293 cells. Cells were transfected with vectors encoding Flag-tagged YTHDF2 (WT, S262A, S263A or T524A). i, j YTHDF2 knockdown was performed in HepAD38 cells (i, with or without tet) or HepG2-HBV1.3 cells (j) by using lentiviral shRNA. Then cells were transfected with Flag-tagged YTHDF2 (WT or S263A), and subjected to sWGA pull-down assays. All the presented input was adjusted to a similar level for the following IP or sWGA-binding assay
Fig. 3
Fig. 3
O-GlcNAcylation stabilizes YTHDF2 through suppression of its ubiquitination. a, b Half-life and quantitative analysis of YTHDF2 in HepAD38 cells treated with (a) or without (b) tet. Cells were transfected with OGT shRNA lentivirus and treated with 100 μM cycloheximide (CHX) for the indicated time. YTHDF2 levels were analyzed by immunoblotting (n = 3, performed in triplicate). c, d Half-life and quantitative analysis of Flag-YTHDF2 in HepG2-HBV1.3 cells treated with or without 25 μM TMG. HepG2 cells stably with YTHDF2 knockdown (shYTHDF2) were transfected with Flag-tagged YTHDF2-WT (c) or YTHDF2-S263A (d) and treated with 100 μM CHX (n = 3, performed in triplicate). The basal levels of Flag-YTHDF2 expression (WT or S263A) at 0 h were adjusted to a similar level for comparison. Data are expressed as mean ± SD in ad. e, f In vivo YTHDF2 ubiquitination in HepG2 cells in the presence of HA-tagged ubiquitin (HA-Ub). e HepG2 cells were transfected with OGT shRNA lentiviral vector, with or without HBV infection; f HepG2-HBV1.3-shYTHDF2 cells were transfected with Flag-YTHDF2 (WT or S263A) and treated with 25 μM TMG. Cells were treated with 10 μM MG132 for 4 h to avoid degradation before harvest. After cell lysis, YTHDF2 was immunoprecipitated using anti-YTHDF2 or anti-Flag antibody. g In vitro YTHDF2 ubiquitination assay was performed with purified Flag-tagged WT or S263A YTHDF2, His-OGT, SCFFBW7 E3 complexes, E1, E2, Ub and UDP-GlcNAc. The reaction products were subjected to immunoblot analysis and YTHDF2 ubiquitination was detected with anti-YTHDF2. hk Subcellular localization of YTHDF2 in Huh7 cells transfected with HBV1.1 (pCH9/3091, containing 1.1 copies of the HBV genome) (Huh7-HBV1.1) were determined by immunoblot analysis (h, j) or immunofluorescence staining (scale bars = 25 μm) (i, k). Nuclear and cytosolic fractions were immunoblotted with anti-YTHDF2 or anti-Flag, and the nucleus/cytoplasm ratio of YTHDF2 was quantified (n = 3, performed in triplicate) (h, j). Representative images for h and j were in Supplementary Fig. 3a, b. For h and i, Huh7-HBV1.1 cells were treated with 25 μM TMG or 20 μM OSMI-1 for 24 h; for j and k, Huh7-HBV1.1 cells with YTHDF2 knockdown (shYTHDF2) were transfected with Flag-YTHDF2 (WT or S263A)
Fig. 4
Fig. 4
O-GlcNAcylation of YTHDF2 promotes hepatoma cell proliferation, invasion and migration in vitro and in vivo. Cells were transfected with YTHDF2 shRNA lentiviral vector to induce endogenous YTHDF2 knockdown, and subsequently infected with adenoviruses expressing Flag-YTHDF2 (WT or S263A). All hepatoma cells were infected with AdHBV1.3. ac Proliferation ability of HepG2-HBV1.3 cells (a), Huh7-HBV1.3 cells (b) and PLC/PRF/5-HBV1.3 cells (c) was detected by CCK-8 assay as indicated (n = 3, performed in triplicate). d, e Colony formation capacity of HepG2-HBV1.3 cells (d) and Huh7-HBV1.3 cells (e) treated as indicated (n = 3, performed in triplicate). f, g Cell invasion capacity of Huh7-HBV1.3 cells (f) and PLC/PRF/5-HBV1.3 cells (g) was measured by transwell assay as indicated (n = 3, performed in triplicate, bar = 100 μm). h, i Cell migration capacity of Huh7-HBV1.3 cells (h) and PLC/PRF/5-HBV1.3 cells (i) was measured by wound-healing assay as indicated (n = 3, performed in triplicate, bar = 200 μm). jl MHCC-97H cells were treated as indicated and subcutaneously injected into nude mice (n = 6 per group). j Representative appearance of subcutaneous implantation tumors. k and l Tumor volume (k) and tumor weight (l) of implantation tumors. Data are represented as mean ± SD. One-way ANOVA followed by Tukey’s test, *P < 0.05, **P < 0.01, ***P < 0.001
Fig. 5
Fig. 5
Identification of YTHDF2 targets by high-throughput RNA-seq, m6A-seq and RIP-seq. a Volcano plot of RNA-seq results in shControl and shYTHDF2 HBV-infected HepG2 cells. Blue and red dots indicate |log2FC | ≥ 1 and P-value ≤ 0.05. b Graphs of m6A peak distribution showing the proportion of total m6A peaks in the indicated regions in HBV-infected HepG2 cells. c Scatter plot of YTHDF2 RIP-seq (IP versus Input) in HBV-infected HepG2 cells. Red dots represent genes that are differentially upregulated or YTHDF2-binding genes, and gray dots represent genes that are not differentially expressed or differentially downregulated. d Venn diagram illustrating the overlapped targets of RNA-seq (downregulated upon YTHDF2 knockdown), m6A-seq and RIP-seq. e KEGG enrichment analysis of overlapped differentially expressed genes (DEGs) identified by RNA-seq, m6A-seq and RIP-seq. f Relative mRNA levels of initial screening genes in HepG2-HBV1.3 cells identified by RT-qPCR (n = 3, performed in triplicate). g Distribution of m6A peaks across MCM2 (left) and MCM5 (right) transcripts. h YTHDF2-RIP-qPCR showing the association of MCM2 or MCM5 transcripts with YTHDF2 in HepG2-HBV1.3 cells (n = 3, performed in triplicate). i Correlation analysis between YTHDF2 and MCM2 (left), or YTHDF2 and MCM5 (right) in TCGA-LIHC cohort (Pearson correlation, P < 0.001). Data are represented as mean ± SD. For f and h, data were analyzed by one-way ANOVA followed by Tukey’s test, *P < 0.05, **P < 0.01, ***P < 0.001
Fig. 6
Fig. 6
YTHDF2 stabilizes cell cycle-related gene MCM2 and MCM5 to promote HCC proliferation. ad Relative mRNA levels (a, b) or immunoblots (c, d) of MCM2 and MCM5 (MCM2/5). HepG2-HBV1.3 cells (AdHBV1.3 infected) were treated with 25 μM TMG, and followed by transfected with control or two individual YTHDF2 shRNAs (a, c) or treated with 20 μM OSMI-1, and infected with adenoviruses expressing Flag-YTHDF2 (AdYTHDF2) or control (AdGFP) (b, d). For a and b, experiments are performed in triplicate, n = 3. e, f Lifetime of MCM2 mRNA in HepG2-HBV1.3 cells treated with 25 μM TMG, and followed by transfected with control or YTHDF2 shRNA (e) or treated with 20 μM OSMI-1, and infected with AdGFP or AdYTHDF2 (f). g, h Lifetime of MCM2/5 mRNA in HepG2-HBV1.3-shYTHDF2 cells transfected with Flag-tagged YTHDF2 (WT or S263A). Transcription was inhibited by actinomycin D (5 μg/mL) (n = 3, performed in triplicate). i, j Relative luciferase activity of constructs containing 3’UTR of MCM2 or MCM5 in HepG2-HBV1.1 cells (pCH9/3091 transfected) (n = 3, performed in triplicate). k, l HepG2-HBV1.3 cells were transfected with control or YTHDF2 shRNA lentiviral vector, and subsequently transfected with Flag-tagged YTHDF2 (WT or W432A). Flag-RIP-qPCR (k) showed the interaction of MCM2/MCM5 transcripts with YTHDF2. RT-qPCR (l) showed the relative MCM2/5 mRNA levels (n = 3, performed in triplicate). mo Cell proliferation (m), colony formation (n) and flow cytometric analysis (o) in HepG2-HBV1.3 cells, which were transfected with control (shCon), or YTHDF2 shRNA lentiviral vector (shY2) or MCM2 and MCM5 shRNA lentiviral vectors (shM2 + shM5) to knock down endogenous YTHDF2 or MCM2/MCM5. Then shYTHDF2 groups were subsequently overexpressed with MCM2 and MCM5 (shY2+OE-M2/5), with (or without) overexpression of WT/S263A YTHDF2. All the experiments were performed in HBV-infected cells (n = 3, performed in triplicate). Data are represented as mean ± SD. For a, b and eo, data were analyzed by one-way ANOVA followed by Tukey’s test, *P < 0.05, **P < 0.01, ***P < 0.001
Fig. 7
Fig. 7
Targeting OGT-meditated YTHDF2 O-GlcNAcylation suppresses HBV-associated hepatocarcinogenesis in vivo. a Schematics showing experimental procedures of DEN-induced HBV-transgenic (Tg) mice. b Gross appearances of liver samples with tumors. c, d Tumor nodules numbers (c) and liver/body weight (d) of HBV-Tg mice, n = 6/group. e, f ALT (e) and AST (f) levels in mouse serum samples, n = 6/group. g Representative images of immunohistochemical (IHC) staining of indicated proteins in the liver of HBV-Tg mice and quantification of IHC by using Image J (n = 6/group), bar = 100 μm. h The indicated proteins expression and YTHDF2 O-GlcNAcylation level in liver tumors of HBV-Tg mice by immunoblots analysis and sWGA pull-down assay. i, j Kaplan–Meier survival analysis of YTHDF2 and MCM2 (i) or YTHDF2 and MCM5 (j) depicting the overall survival (OS) of patients with HCC from the TCGA-LIHC cohort, P < 0.0001. Data are represented as mean ± SD. For cg, data were analyzed by one-way ANOVA followed by the Tukey’s test, **P < 0.01, ***P < 0.001
Fig. 8
Fig. 8
Working model of the study. Schematic depiction of the mechanism underlying O-GlcNAcylation of YTHDF2-mediated HBV-related HCC progression by stabilizing m6A-modified MCM2/5

References

    1. Sung H, et al. Global Cancer Statistics 2020: GLOBOCAN estimates of incidence and mortality worldwide for 36 cancers in 185 countries. Ca. Cancer J. Clin. 2021;71:209–249. - PubMed
    1. Jia L, Gao Y, He Y, Hooper JD, Yang P. HBV induced hepatocellular carcinoma and related potential immunotherapy. Pharmacol. Res. 2020;159:104992. - PubMed
    1. Mills EL, et al. Itaconate is an anti-inflammatory metabolite that activates Nrf2 via alkylation of KEAP1. Nature. 2018;556:113–117. - PMC - PubMed
    1. Zhang W, et al. Lactate is a natural suppressor of RLR signaling by targeting MAVS. Cell. 2019;178:176–189.e15. - PMC - PubMed
    1. Thaker SK, Ch’ng J, Christofk HR. Viral hijacking of cellular metabolism. BMC Biol. 2019;17:59. - PMC - PubMed

Publication types