. 2023 Feb 10;9(1):55.
doi: 10.1038/s41420-023-01307-2.

MEK1 drives oncogenic signaling and interacts with PARP1 for genomic and metabolic homeostasis in malignant pleural mesothelioma

Affiliations

MEK1 drives oncogenic signaling and interacts with PARP1 for genomic and metabolic homeostasis in malignant pleural mesothelioma

Haitang Yang et al. Cell Death Discov. .

Abstract

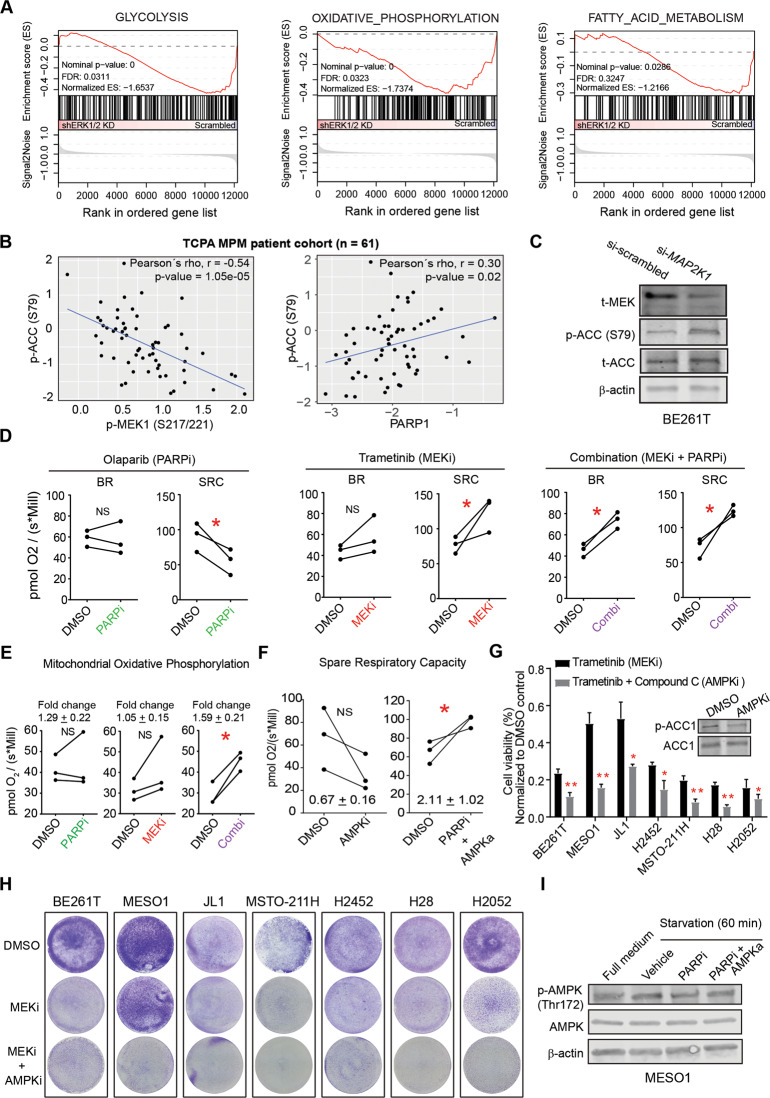
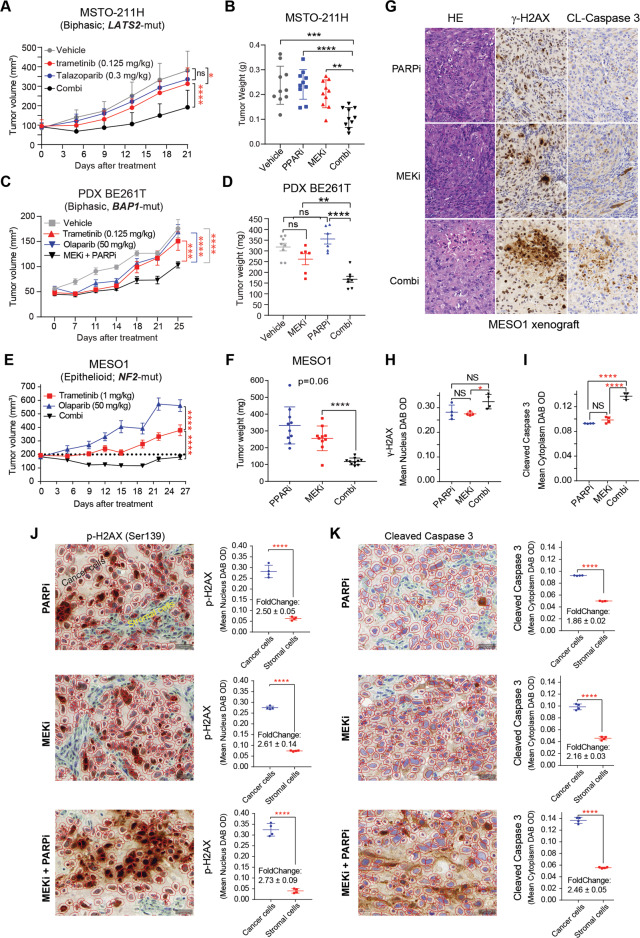
Malignant pleural mesothelioma (MPM) is a lethal malignancy etiologically caused by asbestos exposure, for which there are few effective treatment options. Although asbestos carcinogenesis is associated with reactive oxygen species (ROS), the bona fide oncogenic signaling pathways that regulate ROS homeostasis and bypass ROS-evoked apoptosis in MPM are poorly understood. In this study, we demonstrate that the mitogen-activated protein kinase (MAPK) pathway RAS-RAF-MEK-ERK is hyperactive and a molecular driver of MPM, independent of histological subtypes and genetic heterogeneity. Suppression of MAPK signaling by clinically approved MEK inhibitors (MEKi) elicits PARP1 to protect MPM cells from the cytotoxic effects of MAPK pathway blockage. Mechanistically, MEKi induces impairment of homologous recombination (HR) repair proficiency and mitochondrial metabolic activity, which is counterbalanced by pleiotropic PARP1. Consequently, the combination of MEK with PARP inhibitors enhances apoptotic cell death in vitro and in vivo that occurs through coordinated upregulation of cytotoxic ROS in MPM cells, suggesting a mechanism-based, readily translatable strategy to treat this daunting disease. Collectively, our studies uncover a previously unrecognized scenario that hyperactivation of the MAPK pathway is an essential feature of MPM and provide unprecedented evidence that MAPK signaling cooperates with PARP1 to homeostatically maintain ROS levels and escape ROS-mediated apoptosis.


Conflict of interest statement

The authors declare no competing interests.

Figures

Fig. 1
Fig. 1. The MAPK pathway is hyperactive and an oncogenic dependency in MPM.
A p-MEK1 (Ser217/221) protein levels in The Cancer Genome Atlas (TCGA) pan-cancer cohort (n = 32). The protein expression profile [reverse-phase protein array (RPPA)] was downloaded from The Cancer Proteome Atlas (TCPA) portal (https://tcpaportal.org/). The x-axis represents the cancer types and is ordered by mean p-MEK1 (Ser217/221) protein level. B Genetic alterations of tumor suppressor genes (TSG) in the TCGA cohort of malignant pleural mesothelioma (MPM) patients (n = 83). Data were downloaded from the cBioPortal for Cancer Genomics (https://www.cbioportal.org/). The blue color represents homozygous deletion of the indicated genes, while the red color indicates point mutations. C Histogram plots showing the difference in p-MEK1 protein levels between MPM samples from a cohort of patients in TCGA stratified by the indicated mutations. Notably, the p-MEK1 protein levels are independent of the mutational status of TSGs (BAP1, NF2, TP53, and CDKN2A). The p-value was determined by Welch’s t-test. D p-MEK1 (Ser217/221) protein level is positively correlated with anti-apoptotic proteins (BCL2A1, BCL-XL) in MPM patients. Proteomic data of patient MPM tumors were downloaded from the TCPA database. E Immunoblots of a panel of MPM cells treated with siRNA-based MAP2K1 (encoding MEK1) knockdown. F Viability assay of the indicated MPM cells transfected (72 h) with MAP2K1-specific or control siRNAs. *p < 0.05, **p < 0.01, ***p < 0.001 by Welch’s t-test (n = 3). In MESO-1 cells, both MAP2K1 and MAP2K2 were knocked down by siRNAs. G Flow cytometry-based apoptotic analysis of MPM cells after 72 h transfection with MEK1-specific siRNAs (si-MEK1). The Q1 and Q2 populations (in red) are considered apoptotic cells. The percentage of early and late apoptotic cells, defined by Annexin V+/PI- and Annexin V+/PI+ populations, respectively, were highlighted in red. H In vivo efficacy of trametinib (0.25 mg/kg) in patient-derived xenograft (PDX) BE261T (5 mice/group). Data were shown as mean ± SEM, with ****p < 0.0001 by two-way ANOVA. I, J Kaplan–Meier univariate survival (H) and multivariate Cox regression (I) analyses of the TCGA cohort of MPM patients. Patients are dichotomized by the optimal cutoff value of MAP2K1 (n = 85) or the p-MEK1 (n = 61) level across all patients, with survival curves and cumulative hazard rates analyzed and plotted using the R ‘survival’ and ‘survminer’ packages. The p-value was calculated using the log-rank test.
Fig. 2
Fig. 2. Molecular mechanisms underlying MAPK hyperactivation in MPM.
A Schematic of the RAS-RAF-MEK-ERK and the mTOR pathway downstream of RTK signaling. B Gene set variation analysis (GSVA) shows deregulation of the Hallmark modules in MPM tumors compared with normal pleural tissue. The transcriptomic data of MPM samples (GSE2549 dataset) were downloaded from the Gene Expression Omnibus (GEO). Note that the KRAS_signaling_UP signature is significantly enriched in MPM tumors vs. normal pleural tissue. C The RTK pathway proteins (p-IGF1R, p-CMET, HEREGULIN) and the MAPK pathway proteins (p-CRAF, p-MAPK/p-ERK) correlate strongly and positively with p-MEK1 (Ser217/221) in MPM. The numbers in the correlogram indicate the correlation coefficient (Spearman), with significant (P < 0.05) positive and negative correlations shown in blue and red, respectively. The color intensity is proportional to the correlation coefficient, with a non-significant (P > 0.05) correlation in the blank background. D Viability assay of the indicated MPM cells transfected (72 h) with FGFR1-specific or control siRNAs. *p < 0.05, **p < 0.01, ***p < 0.001 by Welch’s t-test (n = 3). E Immunoblots of H2452 cells treated for 12 h with the B/C-RAF inhibitor sorafenib. Note that 2.5 µM sorafenib effectively blocked MEK signaling (decrease in p-MEK). F Viability assay of the indicated MPM cells treated for 96 h with clinically relevant doses (maximal plasma concentration in patients) of the indicated inhibitors. Data are shown as mean ± s.d. (n = 3). *p < 0.05, **p < 0.01, ***p < 0.001, ****p < 0.0001 by Welch’s t-test.
Fig. 3
Fig. 3. MEK inhibition impairs HR and evokes protective PARP in MPM cells.
A Proteins and phosphoproteins whose expression is significantly correlated with p-MEK1 (Ser217/221) protein level in MPM. The green dots indicate the proteins significantly (p < 0.05) negatively correlated with p-MEK1, and the red significantly positively correlated with p-MEK1. The proteins with a correlation threshold (Spearman’s correlation coefficient >0.4 or <−0.4) are marked. RPPA proteomic data of MPM patients were downloaded from TCPA. B Gene set enrichment analysis (GSEA) revealed significant downregulation of homologous recombination (HR) gene signature in ERK1/2-depleted MPM cells. The GSE21750 dataset from the Gene Expression Omnibus (GEO) portal was used for the analysis, with pre-defined HR gene signatures based on Peng et al. (2014) and Severson et al. (2017). C Kaplan–Meier univariate survival analyses of MPM patients (n = 87). Algorithm-based HR signatures are based on the indicated studies. MPM patients are stratified by the optimal cutoff value of the HR score across all patients using the surv_cutpoint function in the R ‘maxstat’ package. The p-value is calculated by the log-rank test. D PARP1 protein level predicts MEKi sensitivity. The blue dots are inhibitors whose IC50 values are significantly (p < 0.05) positively correlated with PARP1 levels, and the red ones are significantly (p < 0.05) negatively correlated with PARP1. The correlation analysis was based on the drug sensitivity profile of thoracic cancer cells (n = 32, including 3 MPM cell lines and 29 lung cancer cell lines) in GDSC. E Immunoblots of MESO-1 and BE261T cells treated with MEKi (trametinib; 0.5 μM) for the indicated time (MESO1) or for 24 h with different concentrations (BE261T). Protein quantification was shown above the protein bands. F Immunoblots of MESO-1 cells treated with trametinib (MEKi; 0.5 µM) and olaparib (PARPi; 5 µM), alone and in combination for the indicated time. G Immunoblots of BE261T and MESO-1 cells treated with olaparib (PARPi) for the indicated time. Protein quantification was shown above the bands.
Fig. 4
Fig. 4. The combination of MEKi/PARPi enhances the apoptotic death of MPM cells.
A Dose-response curves of MPM cells treated for 72 h with trametinib (MEKi) and olaparib (PARPi), alone or in combination. Data are shown as mean ± s.d. (n = 3). B Dose-response curves of the indicated MPM cells treated with trametinib and talazoparib (PARPi). Data are shown as mean ± s.d. (n = 3). C Clonogenic assay of MPM cells (BE261T, MSTO-211H, H2052) treated with trametinib and olaparib, alone or in combination (1–2 weeks). D Apoptotic assay of BE261T and MSTO-211H cells treated with MEKi (trametinib; 0.5 μM) and PARPi (olaparib; 5 μM), alone and in combination for 72 h. The percentage of early and late apoptotic cells, defined by Annexin V+/PI- and Annexin V+/PI+ populations, respectively, were highlighted in red. E MEK1 knockdown (si-MAP2K1) sensitizes MPM cells to PARPi (olaparib). MPM cells transfected with si-scrambled or si-MAP2K1 (48 h post-transfection) were treated with MEKi/PARPi (trametinib, 0.1 μM; olaparib, 5 μM) for additional 72 h and subjected to viability assay. Scrambled siRNAs were used as control. *p < 0.05, **p < 0.01, ***p < 0.001, ****p < 0.0001 by Welch’s t-test (compared with si-MAP2K1 + PARPi). F MEK1 overexpression compromises MEKi/PARPi efficacy. MPM cells transfected with control (GFP) or MEK1-GFP vectors were subjected to immunoblot analysis 48 h post-transfection or viability assay after being treated for 72 h with the MEKi/PARPi combination (trametinib, 0.1 μM; olaparib, 5 μM). ****p < 0.0001 by Welch’s t-test. G Viability assay of MPM cells treated with trametinib (0.1 µM) and olaparib (5 µM) (combination), in the absence or presence of the indicated inhibitors for 96 h. Q-VD-Oph (20 μM), pan-caspase inhibitor; necrostatin-1 (10 μM), necroptosis inhibitor; Fer-1 (2 μM), ferroptosis inhibitor; HCQ (5 μM), autophagy inhibitor. *p < 0.05, **p < 0.01, ***p < 0.001, ****p < 0.0001 by one-way ANOVA.
Fig. 5
Fig. 5. PARP-AMPK-regulated SRC protects MEKi-induced metabolic stress.
A Gene set enrichment analysis (GSEA) showed that downregulation of ERK1/2 significantly decreased transcriptional signatures of glycolysis, oxidative phosphorylation, and fatty acid metabolism. The GEO dataset GSE21750 was used for GSEA. B p-ACC (Ser79) protein level negatively correlates with p-MEK1 but positively with PARP1 in MPM patients. The protein expression data [reverse-phase protein array (RPPA)] were downloaded from The Cancer Proteome Atlas (TCPA) portal (https://tcpaportal.org/). C Immunoblots of BE261T cells transfected (72 h) with si-MAP2K1 or scrambled siRNAs. D Respirometric measure (n = 3) of basal respiration (BR) and spare respiration capacity (SRC) in MESO1 cells treated with MEKi (0.5 μM trametinib) and PARPi (5 μM olaparib) for 72 h. *p < 0.05 by paired t-test. E Quantification of mitochondrial oxidative phosphorylation (OXPHOS) in MESO-1 cells treated with DMSO, PARPi, MEKi, and the combination. *p < 0.05 by paired t-test (n = 3). F Quantification of spare respiratory capacity (SRC) in MESO-1 cells treated with DMSO, AMPK inhibitor (AMPKi), and the combination of PARPi and AMPK activator (AMPKa). *p < 0.05 by paired t-test (n = 3). G, H Viability (72 h; G) and clonogenic (1 week; H) assay of MPM cells treated with MEKi (0.5 μM), in the presence or absence of compound C (5 μM). Shown in the insert (G) are immunoblots of BE261T cells treated with DMSO or compound C for 12 h. *p < 0.05, **p < 0.01, by Welch’s t-test. I Immunoblots of MESO1 cells starved (60 min) and co-treated (60 min) with compound C (AMPKi; 5 µM), AICAR (AMPKa; 1 mM), and olaparib (PARPi; 5 µM). Quantification of phospho-proteins was normalized to its total protein and the β-actin.
Fig. 6
Fig. 6. MEKi/PAPRi cytotoxicity converges in the upregulation of excess ROS.
A Intracellular reactive oxygen species (ROS) levels of MPM cells treated for 72 h with DMSO (vehicle), PARPi (5 µM), and MEKi (0.5 µM), alone and in combination. Data were normalized to vehicle control and shown as mean ± SEM. *p < 0.05, **p < 0.01, ***p < 0.001 by Welch’s t-test (comparisons between treatment groups and vehicle control). MESO-1 cells treated with H2O2 (1 mM; 30 min) were used as the positive control. B N‑acetylcysteine (NAC) attenuates MEKi/PARPi cytotoxicity. Viability assay of MPM cells pre-incubated (12 h) with DMSO (vehicle) or NAC (5 mM) followed by further treatment (96 h) with trametinib (0.5 µM) and olaparib (5 µM). Data are shown as fold changes, with the viability of the cells treated with trametinib/olaparib/DMSO (vehicle) set as 1. *p < 0.05, **p < 0.01 by Welch’s t-test (n = 3). Representative clonogenic assay of BE261T cells treated with MEKi (0.1 µM) and PAPRi (5 µM) with or without NAC (5 mM) was shown to the right. C p-MEK1 (Ser217/221) protein level is significantly positively correlated with TIGAR and DJ1. The protein expression profile [reverse-phase protein array (RPPA)] was downloaded from The Cancer Proteome Atlas (TCPA) portal (https://tcpaportal.org/). D Volcano plots showing the genes downregulated [adjusted p-value (padj) <0.05 & log2 FC < -2] (in green) and upregulated (padj < 0.05 & log2 FC > 2) (in red) by H2O2, with the H2O2-upregulated genes determined as ROS responsive signature. The transcriptome dataset (GSE32335) of H2O2-treated cells was downloaded from the GEO. E PARP1 mRNA levels are significantly positively correlated with the ROS-responsive gene signature in MPM tumors. F, G High levels of PARP1 and ROS-responsive gene signature are significantly associated with poor survival in MPM patients. The P value is calculated by using the log-rank test. H Working model illustrating the results of this study. MEK hyperactivation is the molecular driver and a therapeutic target in MPM. MEKi evokes genomic and metabolic stress and triggers a protective mechanism involving the pleiotropic PARP1. A combination of MEK and PARP inhibitors leads to synergistic upregulation of ROS, which translates into incurable genomic and metabolic perturbations and subsequently apoptotic cell death.
Fig. 7
Fig. 7. Combined MEKi/PARPi enhances DNA damage and apoptotic death of MPM cells in vivo.
A–F Growth curves (A, C, E) and tumor weights (B, D, F) of MSTO-211H and MESO-1 xenografts and a patient-derived xenograft (PDX, BE261T) treated with MEKi (trametinib), PARPi (talazoparib or olaparib), alone and in combination. Data are presented as mean ± SEM. *p < 0.05, ****p < 0.0001 by two-way ANOVA. NS non-significant. Note that the efficacy of trametinib (1 mg/kg) as monotherapy has been assessed in MESO-1 xenografts (Fig. S1F), so the vehicle was not repeated here according to the 3 R principle of animal experimentation. G–I H&E and IHC (γ-H2AX and Caspase-3) of residual tumors from MESO1 xenografts (G), with quantifications of γ-H2AX and Caspase-3 levels shown (H, I). *p < 0.05, ****p < 0.0001 by two-way ANOVA. Original overall magnification, × 50. J, K IHC staining and quantification of γH2AX (J) and cleaved Caspase 3 (K) in residual MESO-1 xenografts after being treated with PARPi, MEKi, and the combination. Four tumors/group were randomly chosen for the analysis, with the quantification of γ-H2AX (nucleus OD value) and cleaved caspase 3 (cytoplasm OD value) based on the whole tissue slide. Representative images (200x) showing the artificial intelligence-based detection of cancer cells and the stroma marked with red and blue circles, respectively, by the QuPath software implementation. ****p < 0.0001 by Welch’s t-test.

Similar articles

Cited by

References

    1. Tsao AS, Pass HI, Rimner A, Mansfield AS. New era for malignant pleural mesothelioma: updates on therapeutic options. J Clin Oncol. 2022;40:681–92. - PMC - PubMed
    1. Janes SM, Alrifai D, Fennell DA. Perspectives on the treatment of malignant pleural mesothelioma. New Engl J Med. 2021;385:1207–18. - PubMed
    1. Yang H, Xu D, Schmid RA, Peng RW. Biomarker-guided targeted and immunotherapies in malignant pleural mesothelioma. Ther Adv Med Oncol. 2020;12:1758835920971421. - PMC - PubMed
    1. Yang H, Xu D, Yang Z, Yao F, Zhao H, Schmid RA, et al. Systematic analysis of aberrant biochemical networks and potential drug vulnerabilities induced by tumor suppressor loss in malignant pleural mesothelioma. Cancers (Basel). 2020;12:2310. - PMC - PubMed
    1. Yang H, Hall SRR, Sun B, Zhao L, Gao Y, Schmid RA, et al. NF2 and canonical hippo-YAP pathway define distinct tumor subsets characterized by different immune deficiency and treatment implications in human pleural mesothelioma. Cancers (Basel). 2021;13:1561. - PMC - PubMed