. 2023 Feb 10;14(1):755.
doi: 10.1038/s41467-023-36089-9.

Bile salt hydrolase in non-enterotoxigenic Bacteroides potentiates colorectal cancer

Affiliations

Bile salt hydrolase in non-enterotoxigenic Bacteroides potentiates colorectal cancer

Lulu Sun et al. Nat Commun. .

Abstract

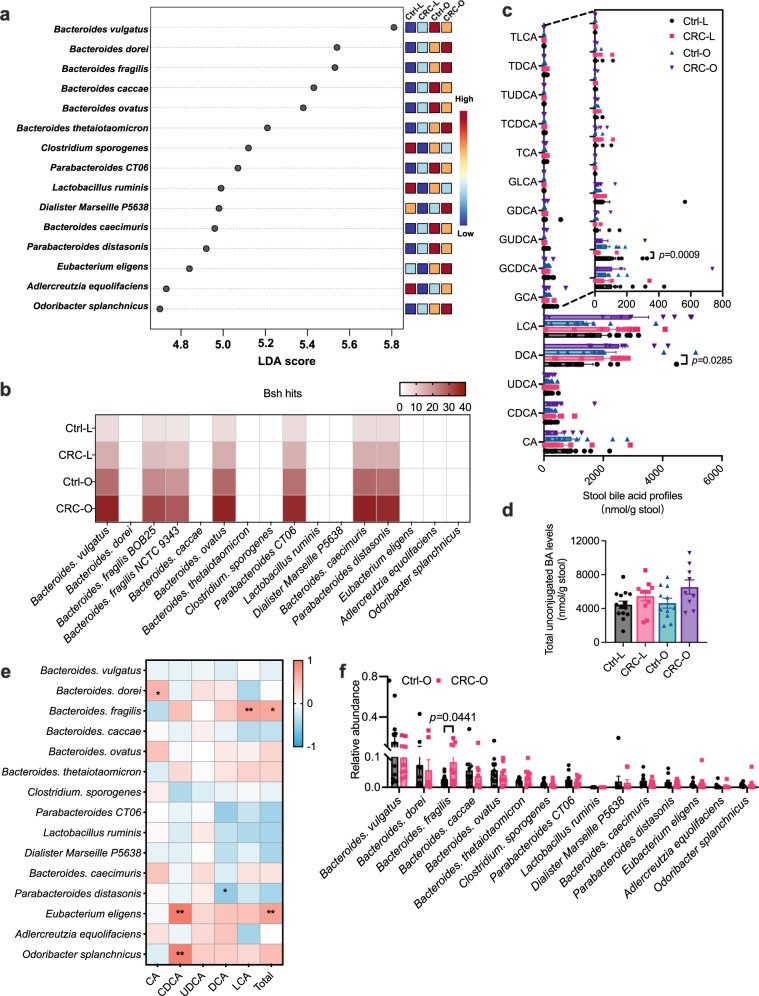
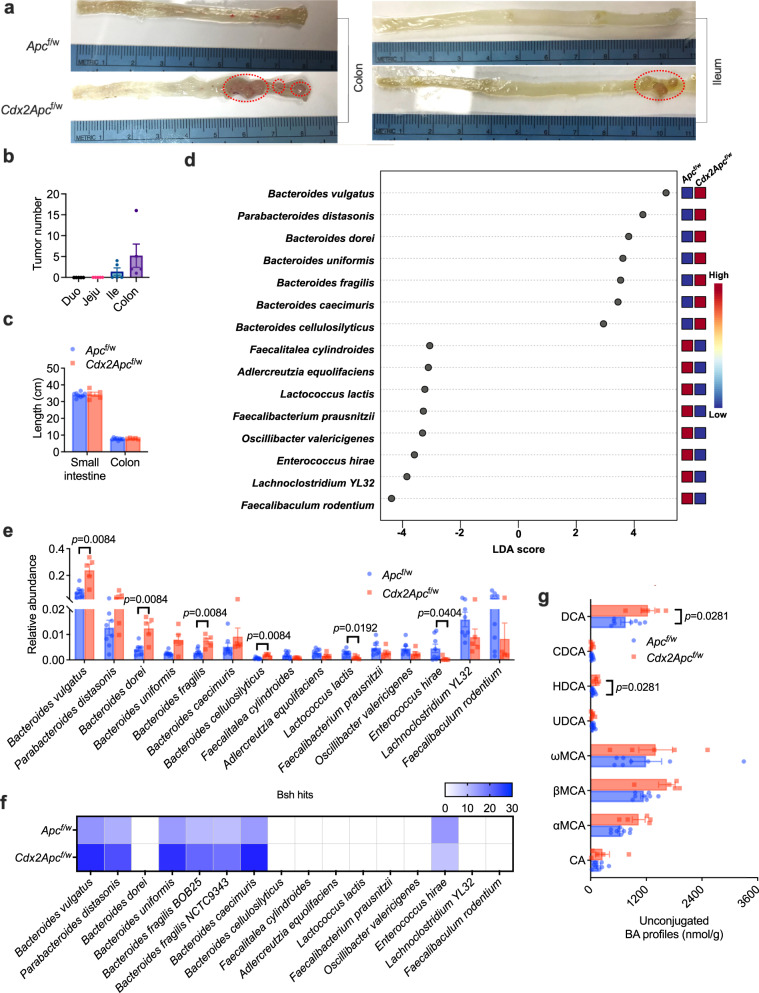
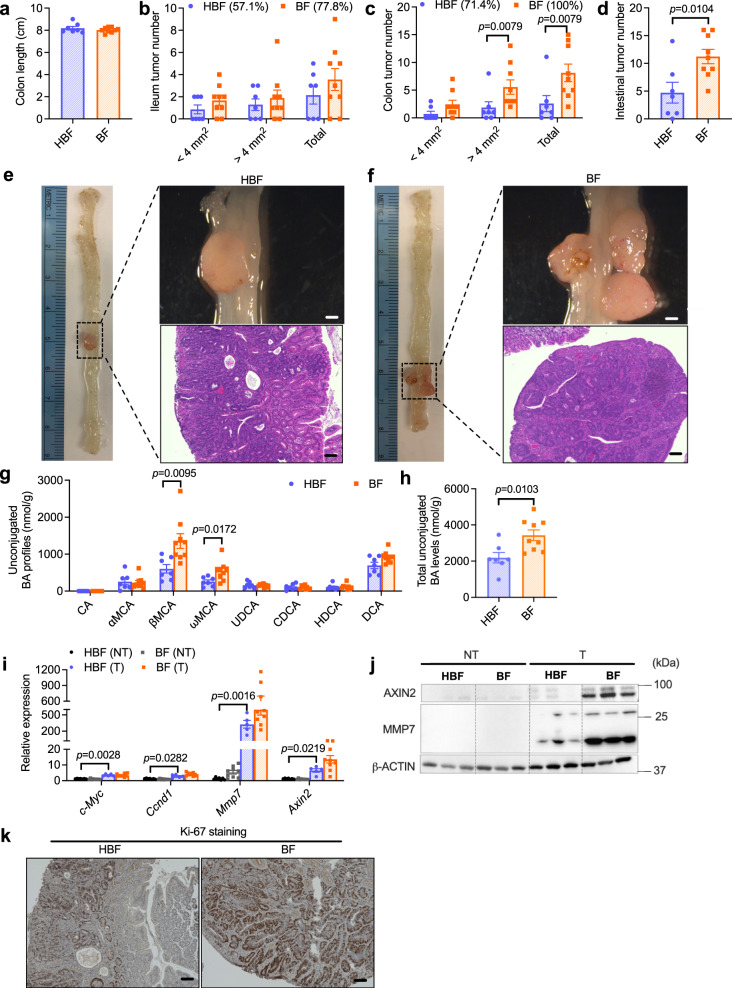
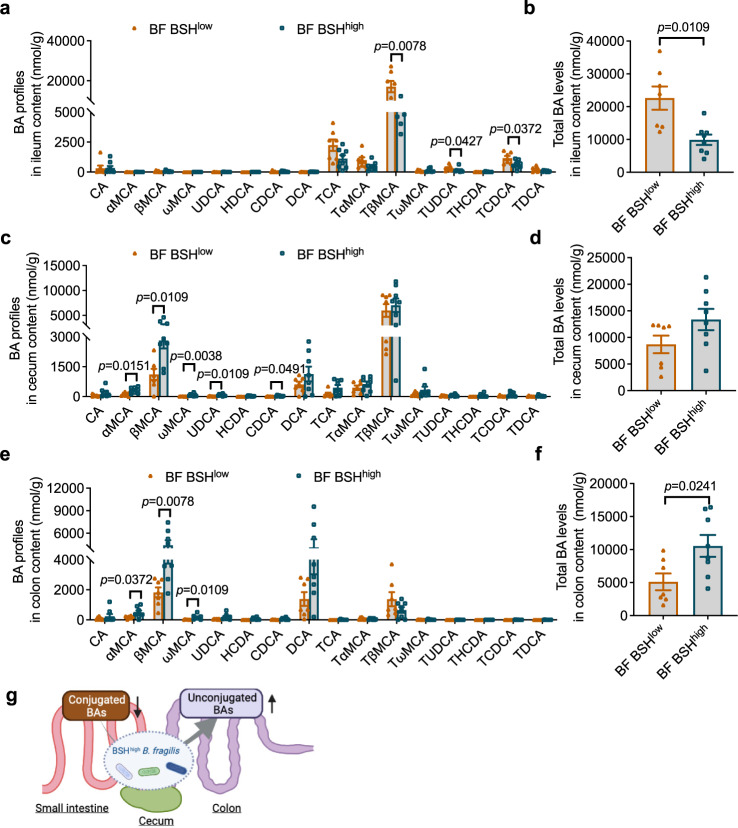
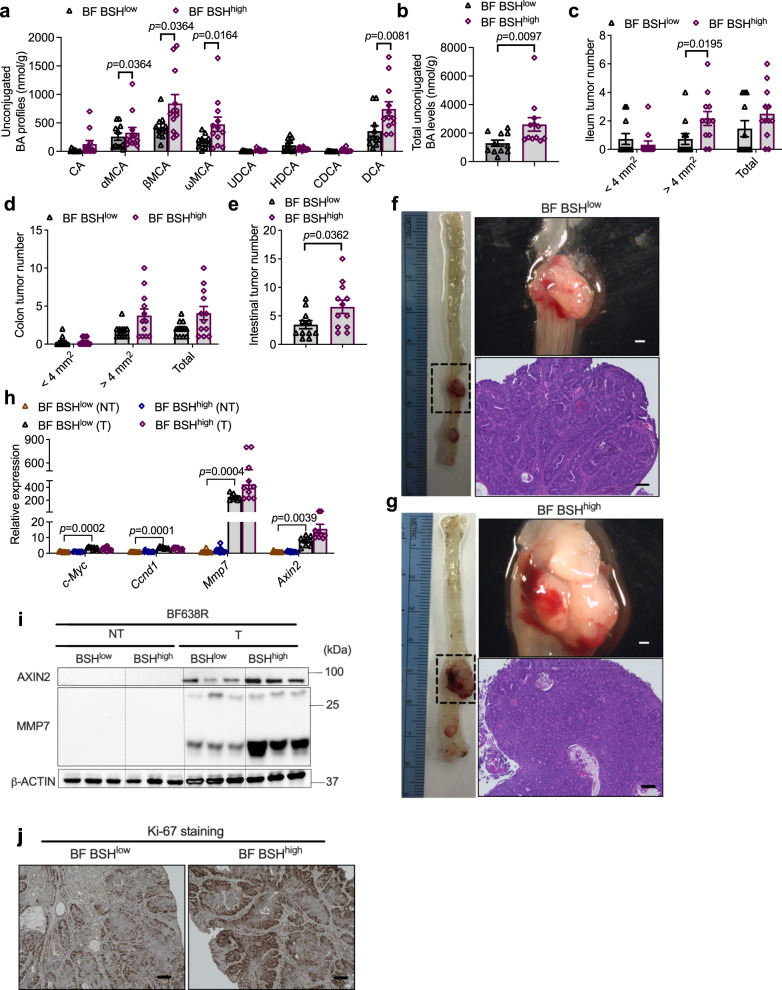
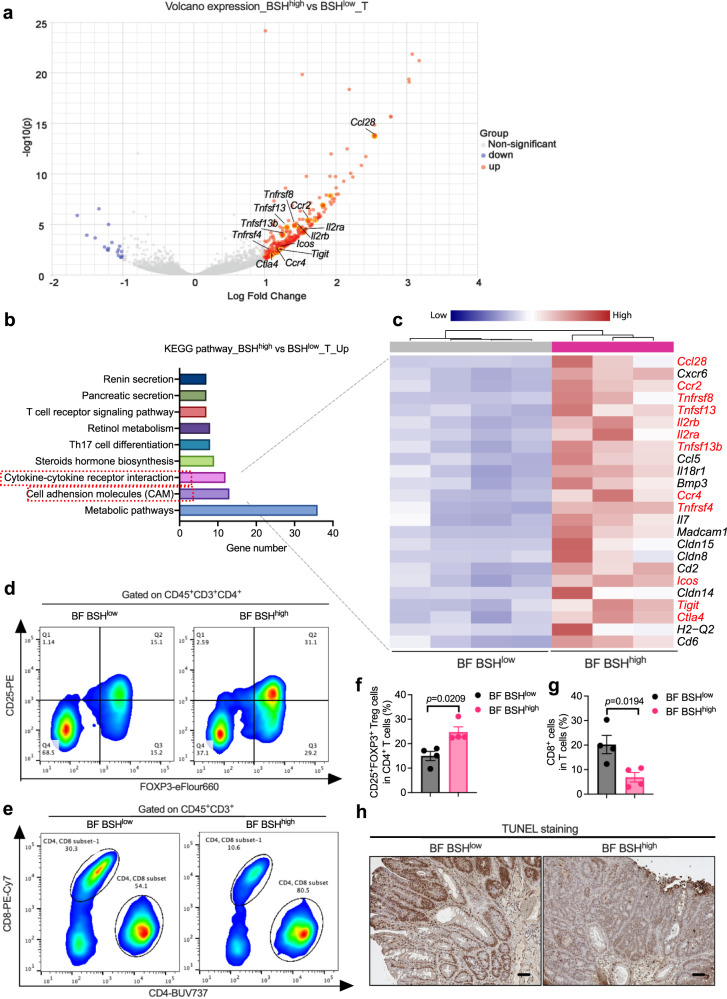
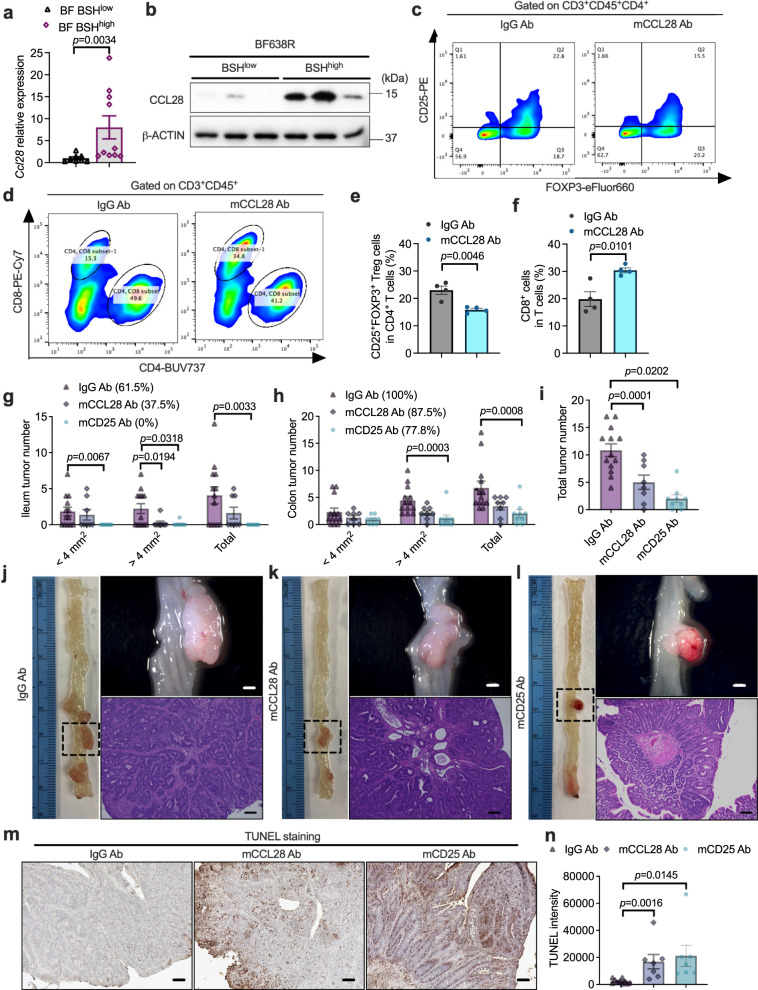
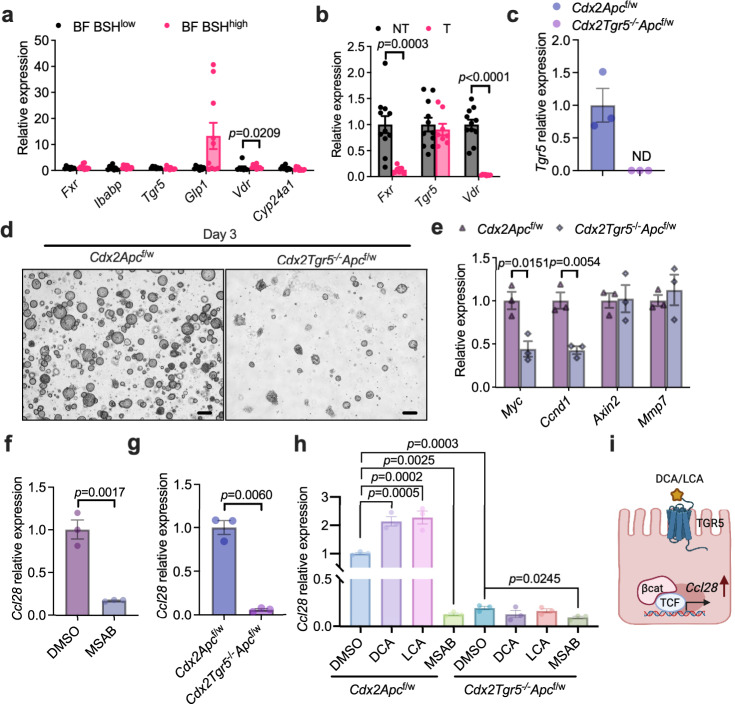
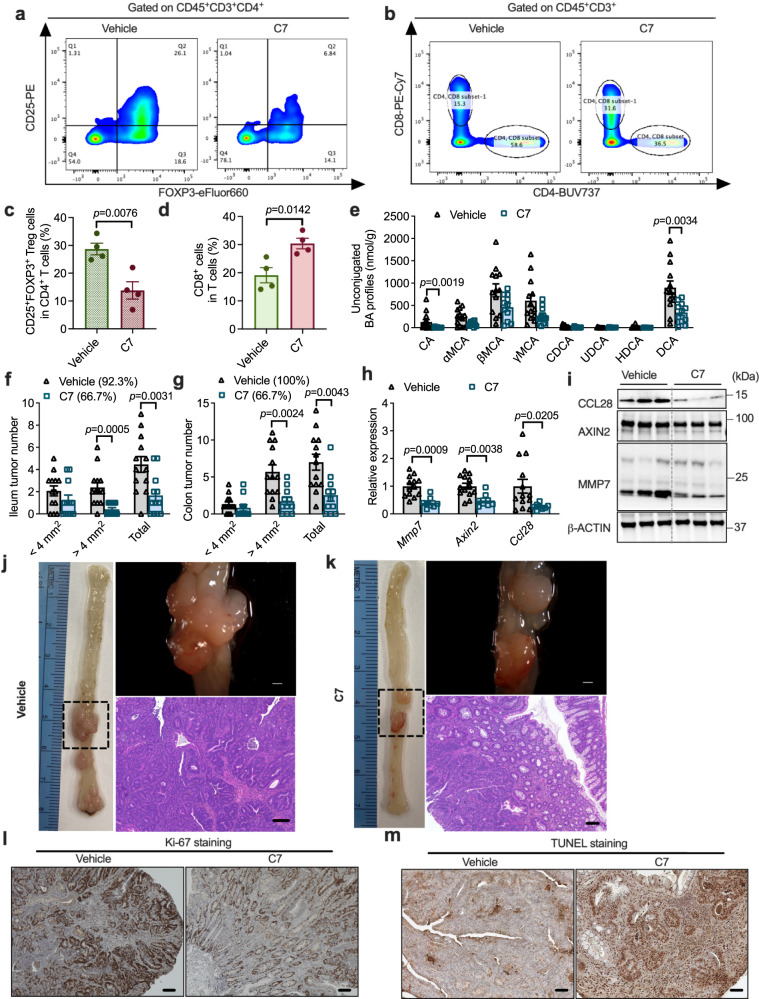
Bile salt hydrolase (BSH) in Bacteroides is considered a potential drug target for obesity-related metabolic diseases, but its involvement in colon tumorigenesis has not been explored. BSH-expressing Bacteroides is found at high abundance in the stools of colorectal cancer (CRC) patients with overweight and in the feces of a high-fat diet (HFD)-induced CRC mouse model. Colonization of B. fragilis 638R, a strain with low BSH activity, overexpressing a recombinant bsh gene from B. fragilis NCTC9343 strain, results in increased unconjugated bile acids in the colon and accelerated progression of CRC under HFD treatment. In the presence of high BSH activity, the resultant elevation of unconjugated deoxycholic acid and lithocholic acid activates the G-protein-coupled bile acid receptor, resulting in increased β-catenin-regulated chemokine (C-C motif) ligand 28 (CCL28) expression in colon tumors. Activation of the β-catenin/CCL28 axis leads to elevated intra-tumoral immunosuppressive CD25+FOXP3+ Treg cells. Blockade of the β-catenin/CCL28 axis releases the immunosuppression to enhance the intra-tumoral anti-tumor response, which decreases CRC progression under HFD treatment. Pharmacological inhibition of BSH reduces HFD-accelerated CRC progression, coincident with suppression of the β-catenin/CCL28 pathway. These findings provide insights into the pro-carcinogenetic role of Bacteroides in obesity-related CRC progression and characterize BSH as a potential target for CRC prevention and treatment.


Conflict of interest statement

The authors declare no competing interests.

Figures

Fig. 1
Fig. 1. BSH-producing Bacteroides species are enriched in CRC patients.
af Stool samples were collected from 45 individuals [14 for control lean group (Ctrl-L); 11 for CRC lean group (CRC-L); 11 for control overweight group (Ctrl-O); 9 for CRC overweight group (CRC-O)] for shotgun metagenomics and bile acid analysis. a Top 15 species of gut microbiota that led to the differences among four groups. b bsh hits in the variable gut microbiota species. c Stool bile acid profiles. Kruskal–Wallis test with Dunn’s post hoc test. CA: cholic acid; UDCA: ursodeoxycholic acid; T: taurine-; G: glycine-. d Total unconjugated bile acids. e Heatmap of the correlation between variable gut microbiota species and stool unconjugated bile acid levels in subjects with overweight. Correlation analyses were determined by Spearman’s rank test with two-sided. *p < 0.05, **p < 0.01. The exact p values are p = 0.0239 (Bacteroides. dorei vs CA), p = 0.0051 (Bacteroides. fragilis vs LCA), p = 0.0104 (Bacteroides. fragilis vs Total), p = 0.0456 (Parabacteroides distasonis vs DCA), p < 0.0001 (Eubacterium eligens vs CDCA), p = 0.0043 (Eubacterium eligens vs Total), p < 0.0001 (Odoribacter splanchnicus vs CDCA). f Relative abundances of variable gut microbiota in subjects with overweight. Mann–Whitney U test with two-sided. Data are presented as mean values +/− SEM in (c, d, f). Source data are provided as a Source Data File for Fig. 1.
Fig. 2
Fig. 2. BSH-producing Bacteroides species are enriched in a CRC mouse model.
ag Apcf/w and Cdx2Apcf/w mice were fed a HFD for 12 weeks (n = 8 mice for Apcf/w; n = 5 mice for Cdx2Apcf/w). a Representative pictures of ileum and colon, revealing the tumor occurrence (in red circle). b Tumor numbers in different segments of intestine from 5 Cdx2Apcf/w mice, Duo: duodenum; Jeju: jejunum; Ile: Ileum. c Length of small intestine and colon. d Top 15 species of gut microbiota that led to the differences between two groups. e Relative abundance of variable gut microbiota species levels. Kruskal–Wallis test with Dunn’s post hoc test. f bsh hits in the variable gut microbiota species. g Unconjugated bile acid profiles in the colon contents. Mann–Whitney U test with two-sided. ωMCA: ω-muricholic acid. Data are presented as mean values +/– SEM in (b, c, e, g). Source data are provided as a Source Data File for Fig. 2.
Fig. 3
Fig. 3. B. fragilis NCTC9343 colonization increases CRC progression.
ah HFD-fed Cdx2Apcf/w mice were colonized with heat-killed B. fragilis 9343 (HBF) or B. fragilis 9343 (BF) for 12 weeks (n = 7 mice for HBF; n = 9 mice for BF). a Length of colon. The ileum (b) and colon (c) tumor incidence, and tumor numbers with different sizes (<4 mm2, >4 mm2 and the sum of both). Mann–Whitney U test with two-sided. d Total tumor number in the intestine. Two-tailed Student’s t test. e, f Representative pictures of colon (left), gross images of tumor (top right) in the colon and H&E staining (bottom right) of colon tumor sections. Scale bars: 1.5 mm (top right) and 100 μm (bottom right). g Unconjugated bile acid profiles in the colon contents. Mann–Whitney U test with two sided. h Total unconjugated bile acid levels in the colon contents. Two-tailed Student’s t test. i Relative mRNA levels of WNT target genes in non-tumor (NT) and tumor (T) colon tissues (n = 7 for HBF-NT; n = 9 for BF-NT; n = 5 for HBF-T; n = 9 for BF-T;). Kruskal–Wallis test with Dunn’s post hoc test. j WB data of proteins encoded by WNT target genes, n = 3 independent samples/group. k Representative IHC staining of Ki-67, a proliferation marker (n = 5 independent slides for HBF; n = 7 independent slides for BF). Scale bars: 100 μm. Data are presented as mean values +/− SEM in (ad, gi). Source data are provided as a Source Data file for Fig. 3.
Fig. 4
Fig. 4. Microbial BSH overexpression in B. fragilis facilitates bile acid escape to the colon.
af HFD-fed Cdx2Apcf/w mice were colonized with B. fragilis 638R with low BSH activity (BF BSHlow) or B. fragilis 638R with high BSH activity (BF BSHhigh) for 2 weeks (n = 7 mice for BF BSHlow; n = 8 mice for BF BSHhigh). Bile acid profiles (a) and total bile acid levels (b) in the ileum contents. Mann–Whitney U test with two-sided (a); two-tailed Student’s t test (b). Bile acid profiles (c) and total bile acid levels (d) in the cecum contents. Mann–Whitney U test with two-sided (c). Bile acid profiles (e) and total bile acid levels (f) in the colon contents. Mann–Whitney U test with two-sided (e); two-tailed Student’s t test (f). g Schematic diagram showing that conjugated bile acids are deconjugated by BSH-expressing bacteria and escape into colon in the form of unconjugated bile acids. Created with BioRender.com. Data are presented as mean values +/− SEM in a-f. Source data are provided as a Source Data File for Fig. 4.
Fig. 5
Fig. 5. Microbial BSH overexpression in B. fragilis potentiates CRC progression.
ah HFD-fed Cdx2Apcf/w mice were colonized with BF BSHlow or BF BSHhigh for 12 weeks (n = 11 mice for BF BSHlow; n = 12 mice for BF BSHhigh). Unconjugated bile acid profiles (a) and total unconjugated bile acid levels (b) in the colon contents. Mann–Whitney U test with two-sided (a). Two-tailed Student’s t test (b). The ileum (c) and colon (d) tumor incidence, and tumor numbers with different sizes (<4 mm2, >4 mm2 and the sum of both. Mann–Whitney U test with two-sided. e Total tumor numbers in the intestine. Two-tailed Student’s t test. f, g Representative pictures of colon (left), gross images of tumors (top right) in the colon and H&E staining (bottom right) of colon tumor sections. Scale bars: 1.5 mm (top right) and 100 μm (bottom right). h Relative mRNA levels of WNT target genes in colon non-tumor (NT) and tumor (T) tissues (n = 10 for BF BSHlow-NT; n = 12 for BF BSHhigh-NT; n = 8 for BF BSHlow-T; n = 10 for BF BSHhigh-T). Kruskal–Wallis test with Dunn’s post hoc test. i WB data of proteins involved in WNT signaling (n = 3 independent samples/group). j Representative IHC staining of Ki-67 (n = 8 independent slides for BF BSHlow; n = 9 independent slides for BF BSHhigh). Scale bars: 100 μm. Data are presented as mean values +/− SEM in (ae, h). Source data are provided as a Source Data File for Fig. 5.
Fig. 6
Fig. 6. Microbial BSH overexpression in B. fragilis induced intra-tumoral immunosuppressive properties.
ac HFD-fed Cdx2Apcf/w mice were colonized with BF BSHlow or BF BSHhigh for 12 weeks, from which the colon non-tumor (NT) and tumor (T) tissues were applied for mRNA sequencing (pooled sample sizes: n = 4 independent samples for BF BSHlow_NT; n = 4 independent samples for BF BSHhigh_NT; n = 4 independent samples for BF BSHlow_T; n = 3 independent samples for BF BSHhigh_T). a Volcano plot showing the upregulated and downregulated genes in colon tumor tissues. Red dots (upregulated) and blue dots (downregulated) were identified as significantly changed mRNAs with multiple comparisons adjusted P value < 0.05 and |logFC| > 1. Two-tailed Student’s t test. b Significantly (multiple comparisons adjusted P value < 0.05) enriched pathway terms of upregulated genes in colon tumor tissues under microbial BSH overexpression (BSHhigh vs BSHlow) indicated by KEGG pathway analysis. Two-tailed Student’s t test. c Heatmap showing all the upregulated genes that involved in cytokine–cytokine receptor interaction and cell adhesion molecules (CAM) under microbial BSH overexpression (BSHhigh vs BSHlow). The genes in red were identified as markers of Treg cells as reported. dg HFD-fed Cdx2Apcf/w mice were colonized with BF BSHlow or BF BSHhigh for 12 weeks, from which the colon tumor tissues were applied for flow cytometry analysis (n = 4 independent samples/group). Flow cytometry analysis determined the FOXP3+CD25+ Treg cells (d) and CD8+ T cells (e) in colon tumor tissues. The portion of FOXP3+CD25+ Treg cells in CD4+ T cells (f) and CD8+ T cells in total T cells (g). Two-tailed Student’s t test. h HFD-fed Cdx2Apcf/w mice were colonized with BF BSHlow or BF BSHhigh for 12 weeks (n = 11 mice for BF BSHlow; n = 12 mice for BF BSHhigh). Representative IHC staining of TUNEL, an apoptosis marker (n = 8 independent slides for BF BSHlow; n = 9 independent slides for BF BSHhigh). Scale bars: 100 μm. Data are presented as mean values +/− SEM in (f, g). Source data are provided as a Source Data File for Fig. 6.
Fig. 7
Fig. 7. CCL28-induced accumulation of Treg cells contributed to B. fragilis-accelerated CRC progression.
a HFD-fed Cdx2Apcf/w mice that were colonized with BF BSHlow or BF BSHhigh for 12 weeks (n = 8 mice for BF BSHlow; n = 10 mice for BF BSHhigh). Ccl28 relative expression in colon tumor tissues. Two-tailed Student’s t test. b CCL28 protein levels (n = 3 independent samples/group). cf Cdx2Apcf/w mice were fed with HFD for 10 weeks, and then the mice were colonized with BF BSHhigh and injected (i.p.) with IgG or mCCL28 neutralizing antibody for another 2 weeks. The colon tumor tissues were used for flow cytometry analysis (n = 4 independent samples/group). Flow cytometry analysis determined the FOXP+CD25+ Treg cells (c) and CD8+ T cells (d) in colon tumor tissues. The portion of FOXP+CD25+ Treg cells in CD4+ T cells (e) and CD8+ T cells in total T cells (f). Two-tailed Student’s t test. gn HFD-fed Cdx2Apcf/w mice were fed with HFD for 6 weeks, and then colonized with BF BSHhigh and injected (i.p.) with IgG, mCCL28 Ab or mCD25 Ab neutralizing antibody for another 6 weeks (n = 13 mice for IgG Ab; n = 8 mice for mCCL28 Ab; n = 9 mice for mCD25 Ab). The ileum (g) and colon (h) tumor incidence, and tumor numbers with different sizes (<4 mm2, >4 mm2 and the sum of both). Mann–Whitney U test with two-sided. i Total tumor number in the intestine. Two-tailed Student’s t test. jl Representative pictures of colon (left), gross images of tumors (top right) in the colon and H&E staining (bottom right) of colon tumor sections. Scale bars: 1.5 mm (top right) and 100 μm (bottom right). Representative IHC staining (m) and quantification (n) of TUNEL (n = 10 in dependent slides for IgG Ab; n = 7 independent slides for mCCL28 Ab; n = 7 independent slides for mCD25 Ab). Scale bars: 100 μm. Two-tailed Student’s t test. Data are presented as mean values +/− SEM in (a, ei, n). Source data are provided as a Source Data File for Fig. 7.
Fig. 8
Fig. 8. DCA/LCA activates TGR5 signaling that regulates Ccl28 expression in the presence of β-catenin.
a HFD-fed Cdx2Apcf/w mice were colonized with BF BSHlow or BF BSHhigh for 12 weeks (n = 8 mice for BF BSHlow; n = 10 mice for BF BSHhigh). Relative expression of Fxr, Tgr5 and Vdr, as well as their target genes, in colon tumor tissues. Mann–Whitney U test with two-sided. b Relative expression of Fxr, Tgr5 and Vdr in colon non-tumor (NT) and tumor (T) tissues (n = 11 independent samples for NT; n = 8 independent samples for T). Mann–Whitney U test with two-sided. ce Cdx2Apcf/w and Cdx2Tgr5−/−Apcf/w mice were fed with HFD for over 10 weeks, and then the colon tumors were used for colon organoid isolation and further culturing (n = 3 independent samples /group). c Relative expression of Tgr5. d Representative images of colon tumor-derived organoids at day 3 after passage. Scale bars: 200 μm. e Relative expression of β-catenin target genes. Mann–Whitney U test with two-sided. f Isolated colon tumor organoids were treated with DMSO or MSAB (10 μM, a β-catenin protein degrader) overnight (n = 3 technical replicates/group). Relative expression of Ccl28. Two-tailed Student’s t test. g, h Cdx2Apcf/w and Cdx2Tgr5−/−Apcf/w mice were fed with a HFD for over 10 weeks, and then the colon tumors were used for colon organoid isolation and further culturing (n = 3 technical replicates/group). g Relative expression of Ccl28. Two-tailed Student’s t test. h Relative expression of Ccl28 under DMSO, DCA (100 μM), LCA (100 μM), MSAB treatment overnight. Kruskal–Wallis test with Dunn’s post hoc test. i Diagram that uncovers that DCA/LCA-TGR5 signaling regulates Ccl28 expression in the presence of β-catenin in colon cancer cell. Created with BioRender.com. Data are presented as mean values +/− SEM in (ac, eh). Source data are provided as a Source Data File for Fig. 8.
Fig. 9
Fig. 9. Pharmacological inhibition of microbial BSH alleviated colon cancer.
ad Cdx2Apcf/w mice were fed with HFD for 10 weeks, and then the mice were colonized with BF BSHhigh and fed with HFD or HFD with compound 7 for another 2 weeks. The colon tumor tissues were used for flow cytometry analysis (n = 4 independent samples/group). Flow cytometry analysis determined the FOXP+CD25+ Treg cells (a) and CD8+ T cells (b) in colon tumor tissues. The portion of FOXP+CD25+ Treg cells in CD4+ T cells (c) and CD8+ T cells in total T cells (d). Two-tailed Student’s t test. ek Under BF BSHhigh colonization, Cdx2Apcf/w mice were fed with HFD or HFD with compound 7 for 12 weeks (n = 13 mice for Vehicle; n = 11 mice for C7). e Unconjugated bile acid profiles in colon contents. Mann–Whitney U test with two-sided. The ileum (f) and colon (g) tumor incidence, and tumor numbers with different sizes (<4 mm2, >4 mm2 and the sum of both). Mann–Whitney U test with two-sided. h Relative mRNA levels of WNT target genes and Ccl28 in colon tumor tissues. Mann–Whitney U test with two-sided. i WB data of CCL28 and proteins involved in WNT signaling (n = 3 independent samples/group). j, k Representative pictures of colon (left), gross images of tumor (top right) in the colon and H&E staining (bottom right) of colon tumor sections. Scale bars: 1.5 mm (top right) and 100 μm (bottom right). Representative IHC staining of Ki-67 (l) and TUNEL (m). n = 9 independent slides for Vehicle; n = 9 independent slides for C7. Scale bars: 100 μm. Data are presented as mean values +/− SEM in (ch). Source data are provided as a Source Data File for Fig. 9.

References

    1. Siegel RL, et al. Colorectal cancer statistics, 2020. CA Cancer J. Clin. 2020;70:145–164. - PubMed
    1. Cancer Genome Atlas, N. Comprehensive molecular characterization of human colon and rectal cancer. Nature. 2012;487:330–337. - PMC - PubMed
    1. Fodde R, Smits R, Clevers H. APC, signal transduction and genetic instability in colorectal cancer. Nat. Rev. Cancer. 2001;1:55–67. - PubMed
    1. Romano G, Chagani S, Kwong LN. The path to metastatic mouse models of colorectal cancer. Oncogene. 2018;37:2481–2489. - PubMed
    1. Garrett WS. The gut microbiota and colon cancer. Science. 2019;364:1133–1135. - PubMed

Publication types