. 2023 Feb 11;14(1):767.
doi: 10.1038/s41467-023-36367-6.

Structural insights into pathogenic mechanism of hypohidrotic ectodermal dysplasia caused by ectodysplasin A variants

Affiliations

Structural insights into pathogenic mechanism of hypohidrotic ectodermal dysplasia caused by ectodysplasin A variants

Kang Yu et al. Nat Commun. .

Abstract

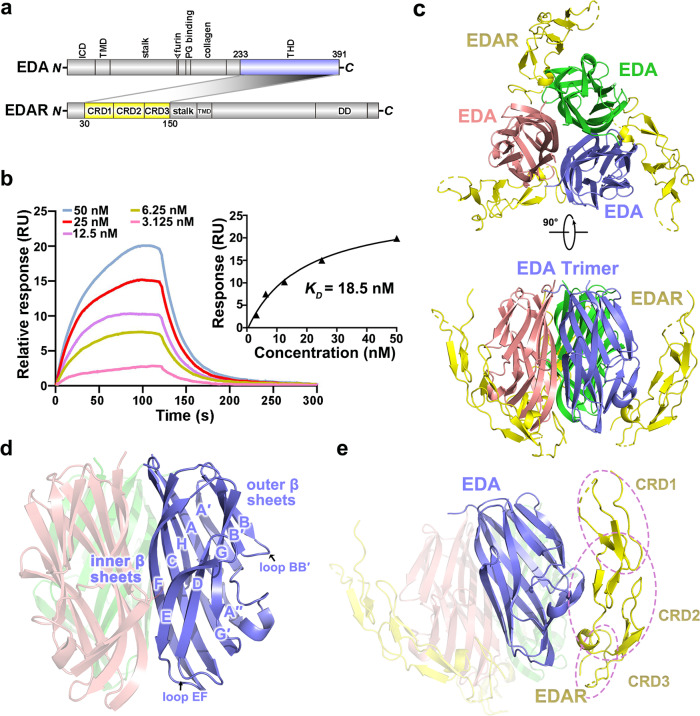
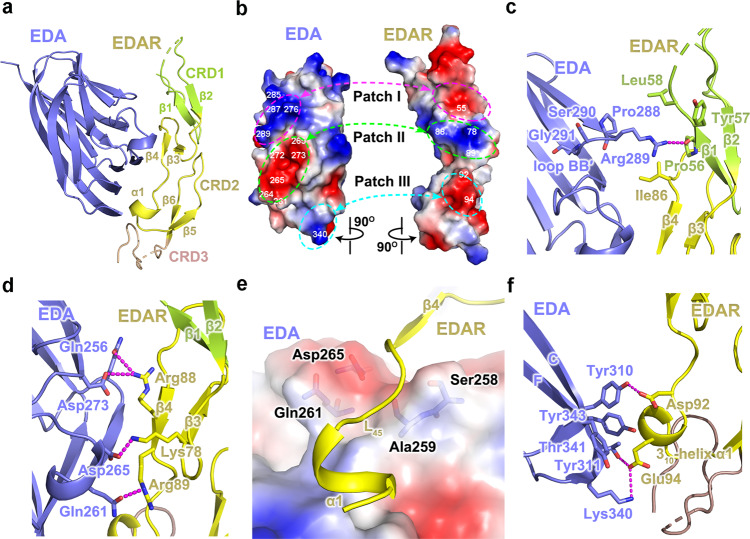
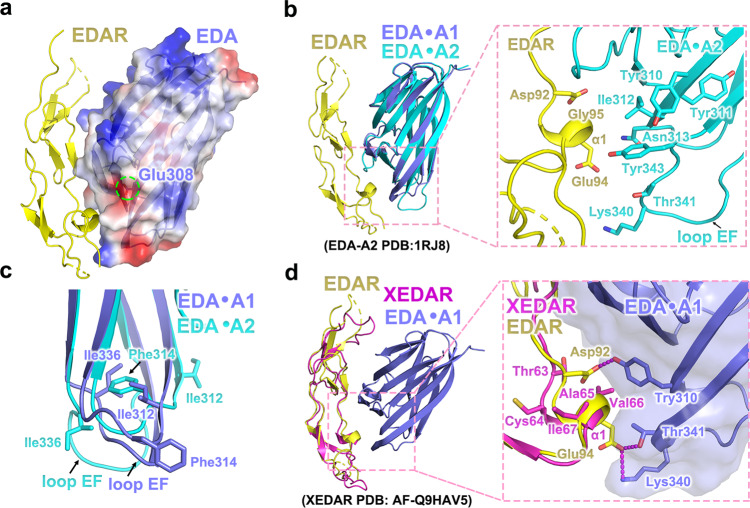
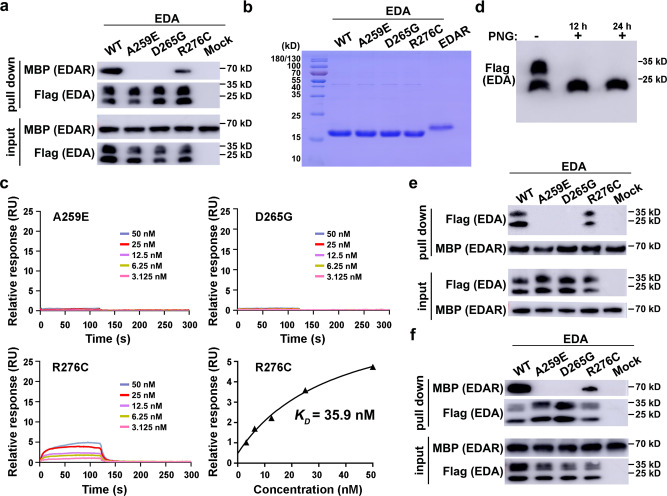
EDA is a tumor necrosis factor (TNF) family member, which functions together with its cognate receptor EDAR during ectodermal organ development. Mutations of EDA have long been known to cause X-linked hypohidrotic dysplasia in humans characterized by primary defects in teeth, hair and sweat glands. However, the structural information of EDA interaction with EDAR is lacking and the pathogenic mechanism of EDA variants is poorly understood. Here, we report the crystal structure of EDA C-terminal TNF homology domain bound to the N-terminal cysteine-rich domains of EDAR. Together with biochemical, cellular and mouse genetic studies, we show that different EDA mutations lead to varying degrees of ectodermal developmental defects in mice, which is consistent with the clinical observations on human patients. Our work extends the understanding of the EDA signaling mechanism, and provides important insights into the molecular pathogenesis of disease-causing EDA variants.


Conflict of interest statement

The authors declare no competing interests.

Figures

Fig. 1
Fig. 1. Overview of the EDA·A1THD-EDARCRDS complex structure.
a Domain organization of EDA·A1 and EDAR. The interacting domains are labeled and highlighted in different colors. The shaded areas indicate the interaction between EDA·A1 and EDAR. ICD intracellular domain, TMD transmembrane domain, THD TNF homology domain, CRD cysteine-rich domain, DD death domain. b Surface plasmon resonance measurements showing that WT EDA·A1THD interacts with EDARCRDS in a concentration-dependent manner. Graphs of equilibrium response unit versus EDA·A1THD concentrations are plotted. The estimated KD for the interaction is about 18.5 nM. c Top and side views of the EDA·A1THD-EDARCRDS complex. EDA·A1THD is a trimeric assembly (slate blue, salmon and green) and each EDARCRDS (yellow) attaches to one side of the ligand. d Cartoon representation of the EDA·A1THD trimer. Loops and β strands of one EDA·A1THD monomer are labeled. e The structure of EDARCRDS adopts an elongated conformation. CRD1, CRD2, and CRD3 are highlighted by dashed purple circles. Source data are provided as a Source Data file.
Fig. 2
Fig. 2. Interactions between EDA·A1THD and EDARCRDS.
a The interaction between EDA·A1THD and EDARCRDS is mainly mediated by CRD2 of EDARCRDS. CRD1, CRD2 and CRD3 are highlighted in limon green, yellow and wheat, respectively. b The electrostatic surface potential of the binding site in EDA·A1THD and EDARCRDS. Three pairs of surface patches with opposite electrostatic properties important for the ligand-receptor interaction are highlighted in dashed circles. Positive potential, blue; negative potential, red. c, d Detailed interactions at patches I and II between EDA·A1THD and EDARCRDS. EDA·A1THD and EDARCRDS are shown in cartoon representation. Residues involved in the interaction are shown in stick models and electrostatic interactions are denoted as magenta dashed lines. e Strand β4 and loop L45 (between strand β4 and helix α1) in EDARCRD2 sit on the saddle-shaped surface of EDA·A1THD. f Detailed interactions at patch III between EDA·A1THD and EDARCRDS. EDA·A1THD and EDARCRDS are shown in cartoons and interacting residues in stick models.
Fig. 3
Fig. 3. The interaction specificity between EDA·A1THD and EDARCRDS.
a Residue Glu308 in EDA·A1THD exhibits no direct interaction with EDARCRDS. EDA·A1THD is shown in electrostatic potential surface representation with residue Glu308 denoted by a dashed green circle. The EDARCRDS is shown in cartoon mode. b Structural comparison of EDA·A1THD and EDA·A2THD. The structure of EDA·A2THD (PDB: 1RJ8) is superimposed onto the EDA·A1THD-EDARCRDS structure. A close-up view of the interface centered at helix α1 of EDARCRD2 is shown on the right. EDA·A1THD, EDA·A2THD and EDARCRDS are colored in slate blue, cyan, and yellow, respectively. c Structural comparison showing the positional change of Phe314 and Ile336 in EDA·A2THD. d Superposition of the predicted XEDARCRDS generated by AlphaFold (PDB: AF-Q9HAV5) onto the EDA·A1THD-EDARCRDS complex. A close-up view of the interface centered at helix α1 of XEDARCRD2 is shown on the right. EDA·A1THD, EDARCRDS, and XEDARCRDS are colored slate blue, yellow, and hotpink, respectively.
Fig. 4
Fig. 4. Biochemical analysis of mutations at the EDA·A1THD-EDARCRDS interface.
a Pull-down assay using anti-Flag beads with ectopically expressed human Flag-EDA·A1THD and purified EDARCRDS-MBP. The levels of each protein in the input and pull-down samples were analyzed by immunoblotting with the indicated antibodies. The upper and lower bands of Flag-EDA·A1THD are N-glycosylated and non-N-glycosylated isoforms, respectively. WT, wild type; MBP (EDAR), anti-MBP to detect EDARCRDS-MBP; Flag (EDA), anti-Flag to detect Flag-EDA·A1THD. b SDS-PAGE analysis of EDA·A1THD variants and EDARCRDS. c Surface plasmon resonance measurement of binding affinity between EDA·A1THD variants and EDARCRDS. d Deglycosylation of EDA·A1THD. Soluble Flag-EDA·A1THD proteins expressed in the supernatant of HEK293T cells were treated with or without peptide N-glycanase (PNGase) F for 12 hours (12 h) or 24 hours (24 h) before western blotting analysis. N-glycosylated forms of Flag-EDA·A1THD (upper bands) disappeared after being treated with PNGase F. e Pull-down assay using amylose (MBP-tag affinity) agarose beads with ectopically expressed human Flag-EDA·A1THD and purified EDARCRDS-MBP. The levels of each protein in the input and pull-down samples were analyzed by immunoblotting with the indicated antibodies. WT, wild type; MBP (EDAR), anti-MBP to detect EDARCRDS-MBP; Flag (EDA), anti-Flag to detect Flag-EDA·A1THD. f Pull-down assay using anti-Flag beads with ectopically expressed mouse Flag-EDA·A1THD and purified mouse EDARCRDS-MBP. The levels of each protein in the input and pull-down samples were analyzed by immunoblotting with the indicated antibodies. Source data are provided as a Source Data file.
Fig. 5
Fig. 5. Functional analysis of the EDA·A1-EDAR interaction mutations.
a Immunofluorescence staining showing the binding of EDA·A1THD variants to EDAR on the cell membrane. MBP-EDA·A1THD, full-length EDAR-Flag and DNA were stained in green, red and blue, respectively. Scale bar: 10 µm. b Luciferase reporter assay shows that supplemented WT EDA·A1THD activates NF-κB signaling pathway in a dose-dependent manner in HEK293T cells ectopically expressing full-length EDAR. Data are presented as the mean ± SEM for n = 3 independent experiments. c The interaction between EDARCRDS and EDA·A1THD variants was assessed by a luciferase reporter assay with HEK293T cells ectopically expressing full-length EDAR (n = 3, mean ± SEM). Top right: similar amount of WT and mutant soluble EDA·A1THD proteins from supernatants of transfected HEK293T cells were analyzed by Western blot to validate the amounts of proteins. d Luciferase reporter assay with HaCaT cells that express endogenous EDAR (n = 3, mean ± SEM). A two-sided Student t-test was performed. ***P = 0.00016 (A259E), ***P = 0.000043 (D265G), **P = 0.0045 (R276C) and ***P = 0.000033 (Mock). Source data are provided as a Source Data file.
Fig. 6
Fig. 6. Disruption of the EDA·A1THD-EDARCRDS interaction results in ectodermal dysplasia in mice.
a The Eda mutant male mice were analyzed for their ectodermal derivatives. The Edako/Y mice showed the most severe defects characterized by hairless tails and abdomen, kinked tail tips, a bald patch behind ears and abnormal eyelid development. The phenotype of the EdaD265G/Y mice was slightly milder than that of the Edako/Y mice, showing scanty abdomen hair and ear hair, but with normal tail hair and tips. The EdaA259E/Y and EdaR276C/Y mutant mice exhibited no obvious abnormalities in the ectodermal derivatives mentioned above. b Representative radiographic images of lower molars from WT and mutant Eda mice. White arrows indicate “bull-shaped” taurodontism teeth with a large pulp cavity. M1, M2, M3: first, second, third molar. Scale bar: 1 mm. c Quantification of the taurodontism phenotype in Eda mutant mice. Left: Schematic diagram of the taurodontism phenotype. Taurodontism is characterized by an elongation of the pulp chamber extending into the root area. A, pulp roof; B, pulp floor; C, apex of the longest tooth root; D, enamel-cemental junction. Right: Quantification of taurodontism phenotype. Data are presented as the mean ± SD for n = 7 adult (about 6-week old) male mice per group. A two-sided Student’s t-test was performed. ***P = 8.7E−07 (AB/AC, D265G), ***P = 2.7E−06 (AB/AC, KO), ***P = 2.8E−05 (BD, D265G) and ***P = 2.4E−05 (BD, KO). Source data are provided as a Source Data file.
Fig. 7
Fig. 7. Sweat gland and hair follicle phenotypes in EDA-EDAR interaction deficiency mice.
a Sweat test of WT and mutant Eda mice. Sweat is detected as dark spots. b The area of sweat dark spots from a is quantified as an indication of the sweating ability. Data are presented as the mean ± SD for n = 9 male mice for KO and 10 for other genotypes with measurements recorded from the two hind paws of each individual. A two-sided Student’s t-test was performed. ***P = 2.2E−04 (A259E), ***P = 3.1E−24 (D265G), ***P = 3.7E−06 (R276C) and ***P = 6.3E−24 (KO). c Histological sections of the footpads. Sweat glands are indicated by white arrowheads. Scale bar: 0.2 mm. d Histological sections of the abdominal skin showing hair follicles indicated by green arrowheads. Scale bar: 0.2 mm. e Micro–computed tomography (μCT) analysis of craniofacial phenotypes in Eda knockout and WT mice. No obvious craniomaxillofacial abnormality was observed in Eda knockout mice. f Phenotypic variations in mice and humans carrying EDA mutations. +, ++, and +++: degree of severity; - within the normal range; NA: not available. Hypodontia score (mouse): -, normal molars; +, reduced and rounded cusps; ++, reduced and rounded cusps, missing cusps; +++, reduced and rounded cusps, missing cusps, taurodontism; ++++, reduced and rounded cusps, missing cusps, taurodontism, missing the third molar. Hypodontia score (human): NA, not available; +, missing teeth; ++, missing teeth, peg-shaped residual teeth. Hypotrichosis score (mouse): -, dense abdomen hair; +, sparse abdomen hairs; ++, very few abdomen hairs; +++, no abdomen hair. Hypotrichosis score (human): -, dense hair; +, sparse eyebrows; +, very few eyebrows, sparse body and scalp hair. Hypohidrosis score (mouse): +, slightly reduced sweat volume; ++, severe reduced sweat volume; +++, no sweat volume. Sweating function score (human): -, able to sweat; +, unable to sweat. Source data are provided as a Source Data file.
Fig. 8
Fig. 8. Summary of missense mutations in EDA·A1THD.
The pathogenic mutations that cause ectodermal dysplasia (middle circle) can be divided into four distinct categories (type I, II, III, and IV) with different locations in EDA·A1THD and distinct clinical phenotypes.

Similar articles

Cited by

References

    1. Wright JT, et al. Ectodermal dysplasias: classification and organization by phenotype, genotype and molecular pathway. Am. J. Med. Genet. A. 2019;179:442–447. doi: 10.1002/ajmg.a.61045. - DOI - PMC - PubMed
    1. Anbouba GM, Carmany EP, Natoli JL. The characterization of hypodontia, hypohidrosis, and hypotrichosis associated with X-linked hypohidrotic ectodermal dysplasia: A systematic review. Am. J. Med. Genet. A. 2020;182:831–841. doi: 10.1002/ajmg.a.61493. - DOI - PubMed
    1. Wright, J. T. et al. in GeneReviews(®) (University of Washington, Seattle, Seattle (WA), 2017). - PubMed
    1. Kere J, et al. X-linked anhidrotic (hypohidrotic) ectodermal dysplasia is caused by mutation in a novel transmembrane protein. Nat. Genet. 1996;13:409–416. doi: 10.1038/ng0895-409. - DOI - PubMed
    1. Cluzeau C, et al. Only four genes (EDA1, EDAR, EDARADD, and WNT10A) account for 90% of hypohidrotic/anhidrotic ectodermal dysplasia cases. Hum. Mutat. 2011;32:70–72. doi: 10.1002/humu.21384. - DOI - PubMed

Publication types

LinkOut - more resources