. 2023 Feb 10;14(1):753.
doi: 10.1038/s41467-023-36293-7.

Nanotopography reveals metabolites that maintain the immunomodulatory phenotype of mesenchymal stromal cells

Affiliations

Nanotopography reveals metabolites that maintain the immunomodulatory phenotype of mesenchymal stromal cells

Ewan A Ross et al. Nat Commun. .

Abstract

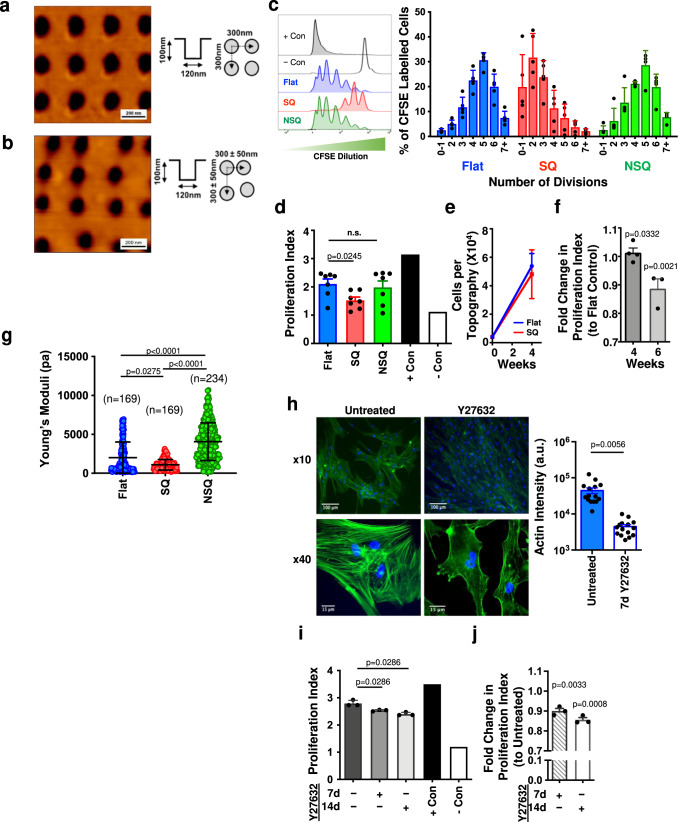
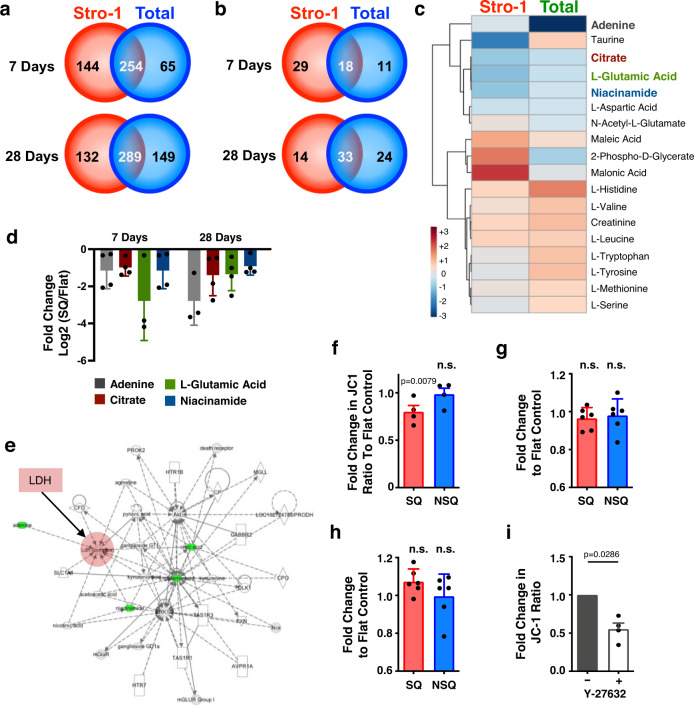
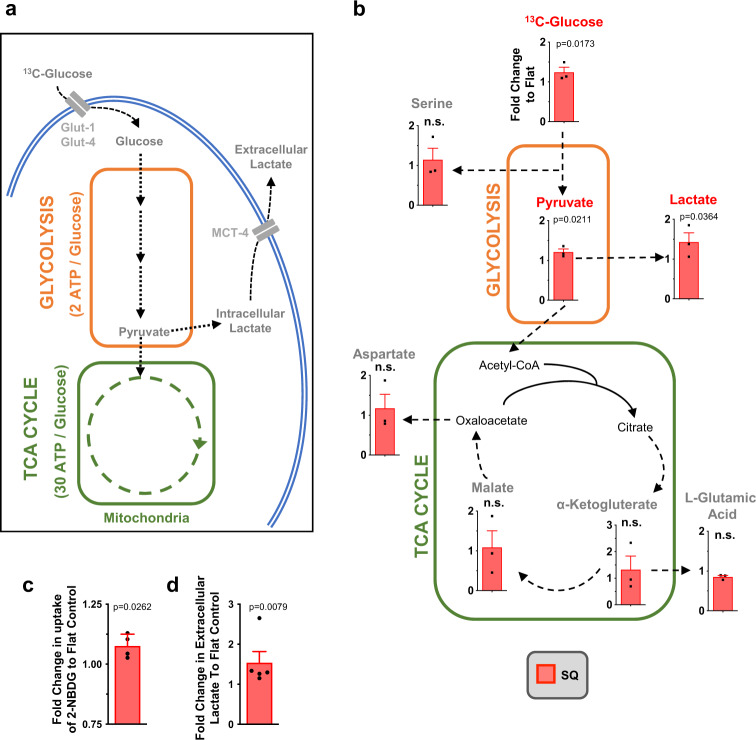
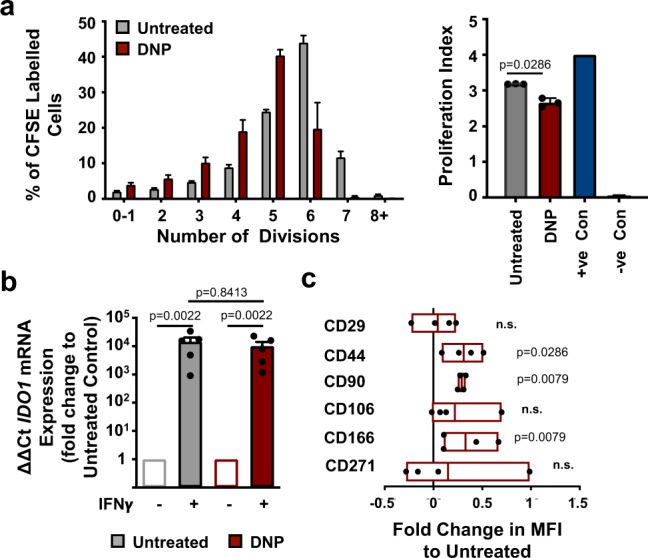
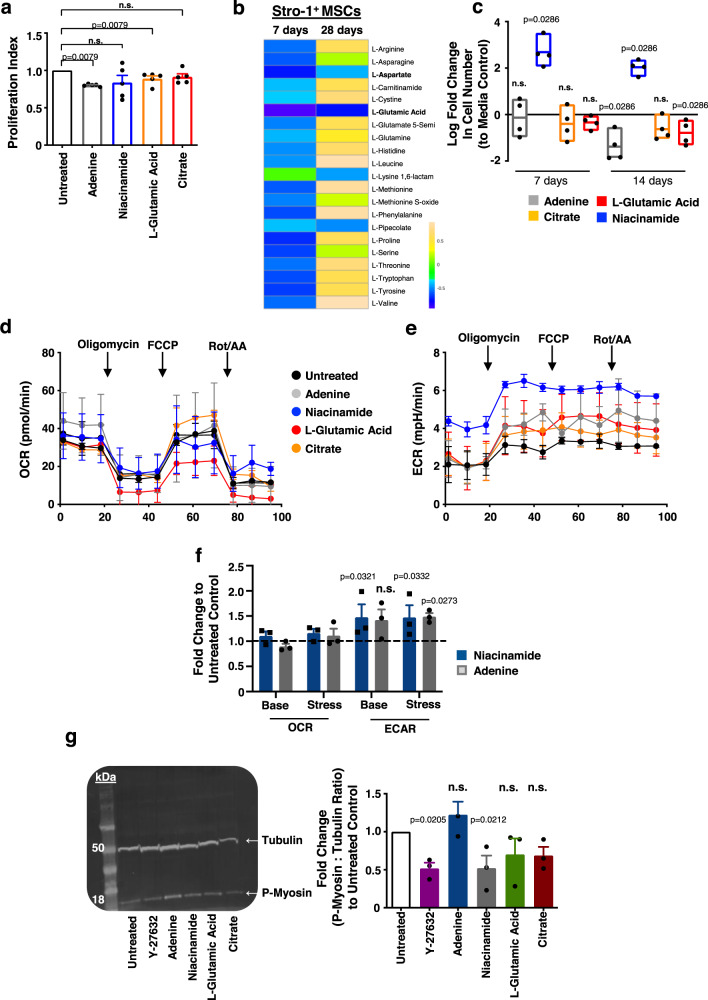
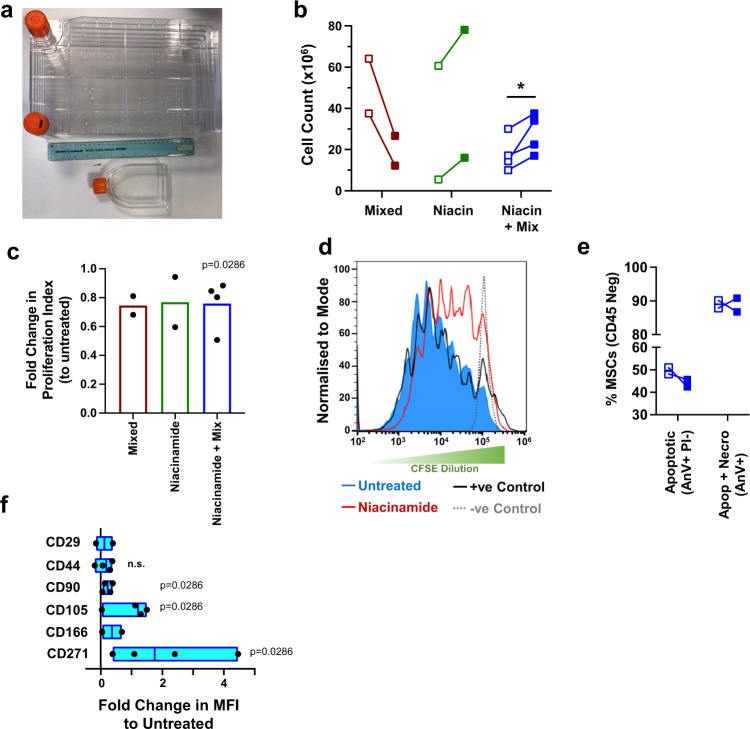
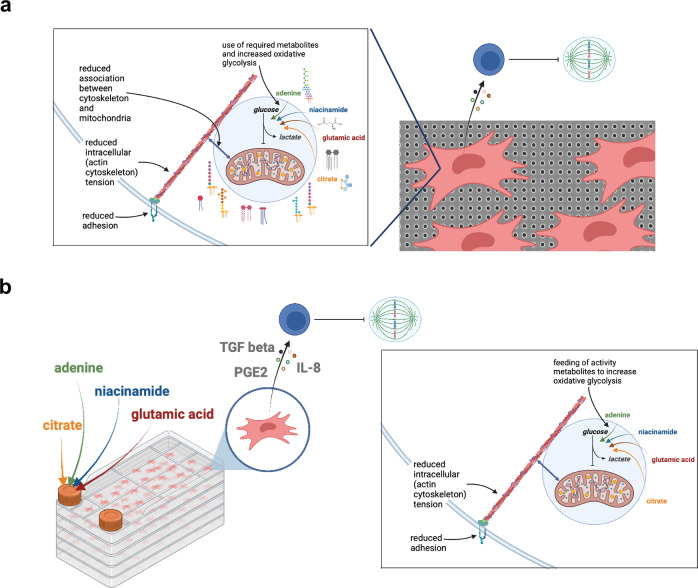
Mesenchymal stromal cells (MSCs) are multipotent progenitor cells that are of considerable clinical potential in transplantation and anti-inflammatory therapies due to their capacity for tissue repair and immunomodulation. However, MSCs rapidly differentiate once in culture, making their large-scale expansion for use in immunomodulatory therapies challenging. Although the differentiation mechanisms of MSCs have been extensively investigated using materials, little is known about how materials can influence paracrine activities of MSCs. Here, we show that nanotopography can control the immunomodulatory capacity of MSCs through decreased intracellular tension and increasing oxidative glycolysis. We use nanotopography to identify bioactive metabolites that modulate intracellular tension, growth and immunomodulatory phenotype of MSCs in standard culture and during larger scale cell manufacture. Our findings demonstrate an effective route to support large-scale expansion of functional MSCs for therapeutic purposes.


Conflict of interest statement

The authors declare no competing interests.

Figures

Fig. 1
Fig. 1. Nanotopography can maintain MSC immunomodulatory capacity via decreased intracellular tension.
a Representative atomic force microscopy images of square (SQ) patterned and b osteogenic-enhancing, offset near square (NSQ) polycarbonate nanotopographies. c Stro-1+ MSCs were cultured on nanotopographies for 14 days, then co-cultured with CFSE-labelled, PHA and IL-2 stimulated PBMCs for a further 5 days. CFSE dilution was quantified by flow cytometry (left panel) and graph shows representative results from one co-culture (n = 4 topographies per group, mean ± S.D.). d Proliferation index was calculated to allow comparison of MSCs immunomodulatory potential from multiple donors (n = 7 donors). e Over longer, 4 week, culture, no change in cell growth was observed. f MSCs were cultured on SQ versus flat topographies for 4 or 6 weeks and effects on the proliferation index of co-cultured CFSE-labelled PBMCs assessed. In e and f, n = 4 topographies per group from one donor; representative of two independent experiments. g Cell stiffness of MSCs cultured on the three topographies was measured using nanoindentation and showed reduced stiffness on the SQ topography and increased stiffness on NSQ. Numbers in brackets represent the number of individual measurements. h MSCs were cultured on flat nanotopographies for 14 days in the presence or absence of the ROCK inhibitor, Y27632. Actin cytoskeleton changes were revealed by phalloidin staining (n = 15 fields per group). i The immunomodulatory capacity of cells cultured on flat topographies for 7 or 14 days in the presence or absence of Y27632 was assessed (n = 3 topographies per group, mean ± S.D.). j Fold change in proliferation index to untreated controls of MSCs grown on flat topographies in the presence of Y27632 for 7 or 14 days (n = 3 independent donors; mean of n = 4 topographies per donor). Means ± SEM and number of donors (N) are shown for each condition. ***p ≤ 0.0001; *p < 0.05; n.s., non-significant. Direct comparisons by two-tailed student T-test (Mann–Whitney) and in (f, g and j) by one-way ANOVA with Kruskal–Wallis test of multiple comparisons. Source data are provided as a Source data file.
Fig. 2
Fig. 2. Metabolome analysis reveals nanotopography-mediated changes in cellular respiration, independent of mitochondrial dynamics.
a Stro-1+ (red) or total BM (green) MSCs were cultured on SQ or flat surfaces for 7 or 28 days, and the number of metabolites specific or common to both cell types were enumerated. Common metabolites with a confidence value of 10 were identified using IDEOM software in both MSC populations (b), and the heat map shows the distribution of these at day 7 of culture (c). d Fold change in selected metabolite concentrations. Data in (ad) show mean of 6 nanotopographies per condition. e Biochemical network analysis of metabolite changes in MSCs cultured on flat versus SQ. f Changes in mitochondrial activity were measured using JC-1 staining, in MSCs cultured on SQ or NSQ nanotopographies relative to flat control. Each data point is the mean of 3 technical repeats per independent donor (n = 4). Comparisons by one-way ANOVA (*p = 0.0079). g, h Mitochondrial mass (Mitotracker Green) and superoxide generation (Mitosox Red) were also evaluated by flow cytometry (single measurement from n = 4 donors). i Stro-1+ MSCs were cultured on flat and SQ nanotopographies (n = 4 topographies per donor, n = 4 independent donors) for 14 days in the presence (hatched bars) or absence (open bars) of the ROCK inhibitor, Y27632, and changes in mitochondrial activity measured using JC-1 staining. Means ± SEM are shown in f, g, h and i and number of donors (N) are shown for each condition. Means ± S.D. in d, g and h by one-way ANOVA. Direct comparisons of means by two-tailed student T-test (Mann–Whitney), *p < 0.05; n.s., non-significant). Source data are provided as a Source data file.
Fig. 3
Fig. 3. MSCs increase oxidative glycolysis on SQ nanotopographies, as revealed by [13C6]-glucose tracing.
a Schematic of MSC respiration during culture. Changes to these pathways relative to MSCs on planar controls can be traced using heavy labelled [13C6]-glucose. b Stro-1+ MSCs were cultured for 14 days on nanotopographies in the presence of [13C6]-glucose for 72 h. LC-MS was then used to measure the conversion and abundance of [13C6]-labelled metabolites in the glycolysis and TCA cycle pathways. Graphs show a fold change in [13C6]-labelled metabolites in MSCs cultured on SQ relative to flat nanotopographies. c MSCs were cultured for 14 days on SQ or flat surfaces (n = 3-4 topographies per donor, n = 4 independent donors), and glucose uptake was measured using 2-NBDG (a fluorescent glucose analogue) by flow cytometry. d Cell culture supernatants were collected from MSCs grown for 14 days on flat or SQ nanotopographies, and extracellular secreted lactate was quantified (n = 2 samples per donor, n = 3 independent donors). Means ± SEM and number of donors (N) are shown for each condition (Direct comparisons by two-tailed student T-test (Mann–Whitney), *p < 0.05; n.s., non-significant). Source data are provided as a Source data file.
Fig. 4
Fig. 4. Uncoupling oxidative phosphorylation increases MSC immunomodulation.
a Stro-1+ MSCs were cultured in the presence or absence of DNP for 14 days, then co-cultured with CFSE-labelled, IL-2 and PHA stimulated PBMCs for a further 5 days. Proliferation was assessed by flow cytometry. Data in left graph is a representative experiment (n = 4 replicates per group; mean ± S.D.); data in right graph shows the proliferation index of 3 independent experiments (n = 3; mean ± SEM). b Following culture with or without DNP, MSCs were challenged with IFN-γ for 24 h and IDO1 expression was evaluated by qPCR (n = 1 sample per donor, n = 5 independent donors). c Fold change in MSC surface marker expression following DNP treatment, relative to untreated controls, as assessed by flow cytometry (at least 5000 cells per sample from n = 4 independent donors). Floating box plots show mean with high and low values (CD29, min −0.227 max 0.2319 mean 0.0446; CD44, min 0.0853 max 0.51276 mean 0.3106; CD90, min 0.2485 max 0.3313 mean 0.2906; CD106, min −0.0182 max 0.6987 mean 0.2195; CD166 min 0.1042 max 0.6667 mean 0.2906; CD271 min −0.2814 max .0987 mean 0.14892). Means ± SEM and number of donors (N) are shown for each condition. Multiple comparisons (a and b) by two-way ANOVA with Tukey’s multiple comparison test or direct comparisons by two-tailed student T-test (Mann–Whitney) in (c). ***p ≤ 0.0001; *p < 0.05; n.s., non-significant. Source data are provided as a Source data file.
Fig. 5
Fig. 5. Addition of defined metabolites influences MSCs immunomodulation capability.
a Stro-1+ MSCs were cultured in the presence of metabolites for 14 days, followed by co-culture with CFSE labelled, IL-2 and PHA stimulated PBMCs for a further 5 days. Graph shows the proliferative index of T cells normalised to untreated controls and is representative of 2 independent experiments (n = 4 topographies per group, mean ± S.D). b Changes in amino acid synthesis in Stro-1+ MSCs grown on SQ versus flat nanotopographies for 7 or 28 days. At both time points, L-glutamic acid and L-aspartate were depleted (n = 6 topographies per group). c Stro-1+ MSCs were cultured with selected metabolites and fold change in total cell number was measured by flow cytometry relative to untreated controls cytometry (at least 5000 cells per sample from n = 4 independent donors). Floating bar plots show mean with high and low values at day 7 (Adenine, min −0.9783 max 0.6816 mean −0.1351; Niacinamide, min 2.0646 max 3.5192 mean 2.6851; Glutamic Acid, min −1.1782 max 0.4436 mean −0.399; Citric Acid, min −0.7059 max −0.0395 mean −0.3411) and day 14 (Adenine, min −1.8668 max −0.5363 mean −1.3839; Niacinamide, min 1.6152 max 2.3692 mean 2.0345; Glutamic Acid, min −1.0469 max 0.0458 mean −0.6289; Citric Acid, min −1.3269 max −0.2179 mean −0.7857). Representative Seahorse XF Mito Stress Test analysis of metabolite-treated Stro-1+ MSCs and normalised mitochondrial respiration shown as oxygen consumption rate (OCR) (d) and extracellular acidification rate (ECAR) (e). Data in e and f is from n = 3 technical repeats from one representative donor. f Fold change of baseline (Base) and stressed (Stress) OCR and ECAR in metabolite-treated Stro-1+ MSCs compared to untreated controls (mean of 3 technical replicates per donor, n = 3 independent donors). g Stro-1+ MSCs were cultured with selected metabolites for 14 days or ROCK inhibitor Y-27632 for 7 days. Levels of phospho-myosin (18 kDa) relative to β-tubulin (50 kDa) was quantified by western blotting. Blot is representative of 3 independent donors. Graph on right shows quantitative changes in phospho-myosin expression normalised to β-tubulin. Means ± SEM and number of donors (N) are shown for each condition. Comparisons (a, g) by two-way ANOVA with Dunnett’s multiple comparison test or two-tailed student T-test (Mann–Whitney) in (c, f). *p < 0.05; n.s., non-significant. Source data are provided as a Source data file.
Fig. 6
Fig. 6. Upscaling cell cultures using metabolite treatment supports production of immunosuppressive MSCs.
a Stro-1+ MSCs were grown using five-layer cell stacks to increase cell yields (3180 cm2 growth area, shown next to a standard T75 flask). b Numbers of cells recovered from the cell stacks after two weeks of culture with (filled square) and without (empty square) metabolite treatment. Treatments were mixed (adenine, niacinamide, L-glutamic acid and citrate), niacinamide only (niacin) and niacinamide followed by mixed. c MSCs grown in large culture conditions were harvested, replated and their immunosuppressive capacity measured co-cultured with CFSE-labelled, IL-2 and PHA stimulated PBMCs for a further 5 days. Proliferation was assessed by flow cytometry. Fold change in the proliferation index to matched untreated controls shown for each metabolite treatment. d Representative flow cytometry histogram of CFSE dilution in T cells co-cultured with niacinamide and mixed treated MSCs for 5 days. e Stro-1+ MSCs were cultured with niacinamide followed by the four metabolite mixture and assessed for susceptibility to apoptosis when co-cultured with activated PBMCs at 1:10 ratio using Annexin-V and PI staining by flow cytometry (n = 2 independent donors). The proportion of apoptotic (Annexin-V+PI-) and necrotic (Annexin-V+PI+) are shown for either untreated (empty squares) or metabolite-treated (filled squares) MSCs. f Fold change in MSC surface marker expression following niacinamide and mixed treatment for 14 days, relative to untreated controls, as assessed by flow cytometry (at least 5000 cells per sample from n = 4 independent donors). Floating box plots show mean with high and low values (CD29, min 0.8442 max 1.3912 mean 1.1177; CD44, min 0.8056 max 1.3757 mean 1.1353; CD90, min 1.0511 max 1.39 mean 1.2236; CD105, min 1.0342 max 2.494 mean 1.9871; CD166, min 1.0481 max 1.3575 mean 1.9871; CD271, min 1.3867 max 5.460 mean 3.0874). All graphs show n = 2–4 donors for each metabolite treatment. Paired comparisons (b, c and f) by two-tailed student T-test (Mann–Whitney) *p < 0.05; n.s., non-significant. Source data are provided as a Source data file.
Fig. 7
Fig. 7. Schematic illustrating main findings.
a Culture on the SQ nanotopography causes a lowering of cell adhesion, cytoskeletal tension and mitochondrial association with actin microfilaments. This results in use of adenine, niacinamide, glutamic acid and citrate by the cells to drive glycolysis resulting in reduced T cell proliferation. b Addition of the glycolysis-driving metabolites into large-scale MSC culture results in similar adhesion and intracellular tension reduction as seen when the cells are cultured on the SQ nanotopography along with secretion of TGFβ, PGE-2 and IL-8 and resultant reduced T cell proliferation. Red cells = MSCs, blue cells = T cells. Created with BioRender.com.

Similar articles

Cited by

References

    1. Engler AJ, Sen S, Sweeney HL, Discher DE. Matrix elasticity directs stem cell lineage specification. Cell. 2006;126:677–689. - PubMed
    1. McBeath R, Pirone DM, Nelson CM, Bhadriraju K, Chen CS. Cell shape, cytoskeletal tension, and RhoA regulate stem cell lineage commitment. Dev. Cell. 2004;6:483–495. - PubMed
    1. Kilian KA, Bugarija B, Lahn BT, Mrksich M. Geometric cues for directing the differentiation of mesenchymal stem cells. Proc. Natl Acad. Sci. USA. 2010;107:4872–4877. - PMC - PubMed
    1. Dalby MJ, et al. The control of human mesenchymal cell differentiation using nanoscale symmetry and disorder. Nat. Mater. 2007;6:997–1003. - PubMed
    1. Benoit DS, Schwartz MP, Durney AR, Anseth KS. Small functional groups for controlled differentiation of hydrogel-encapsulated human mesenchymal stem cells. Nat. Mater. 2008;7:816–823. - PMC - PubMed

Publication types